How's life in the Russian Federation?

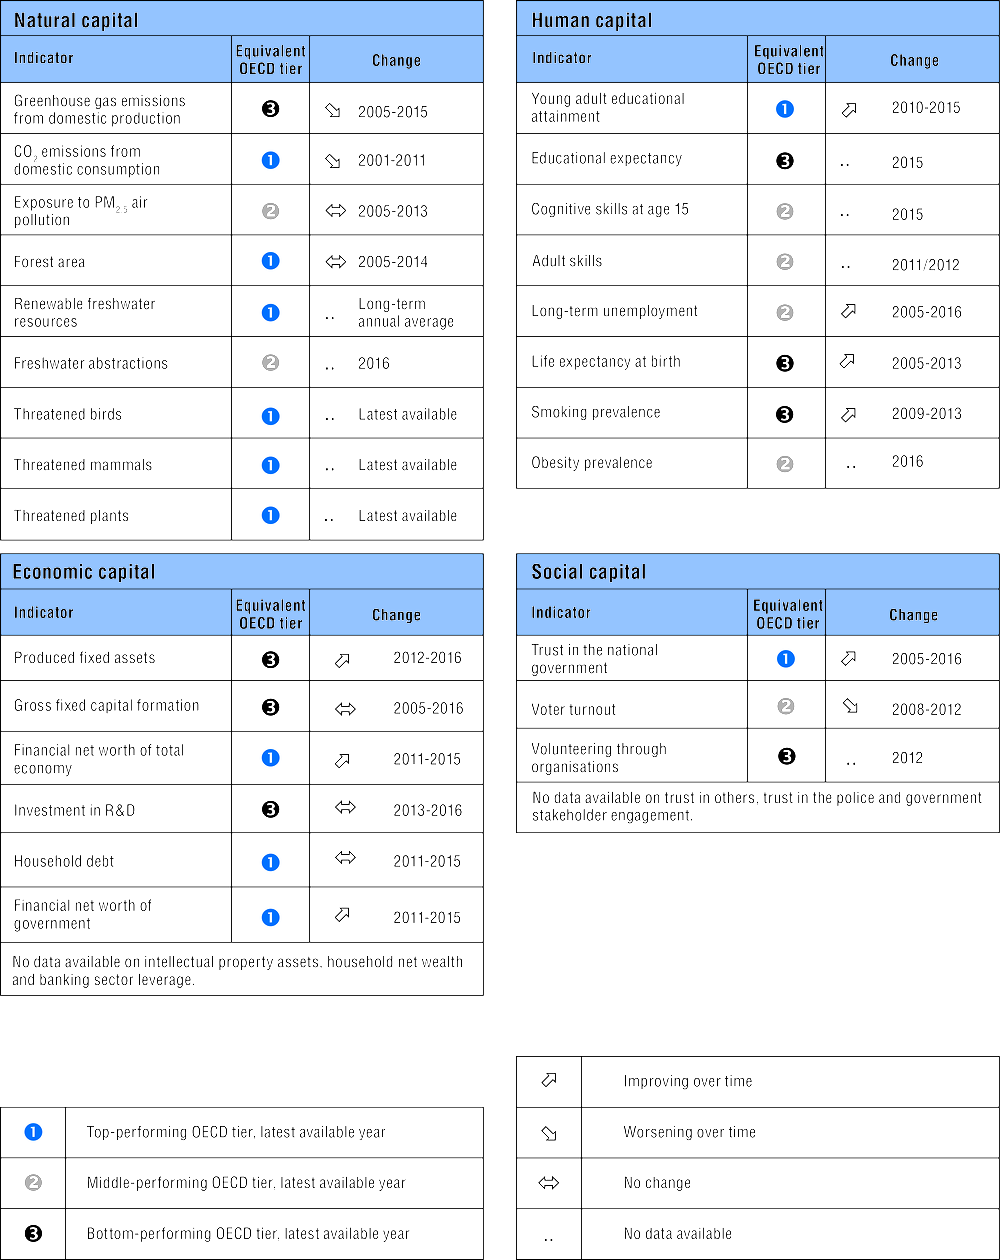
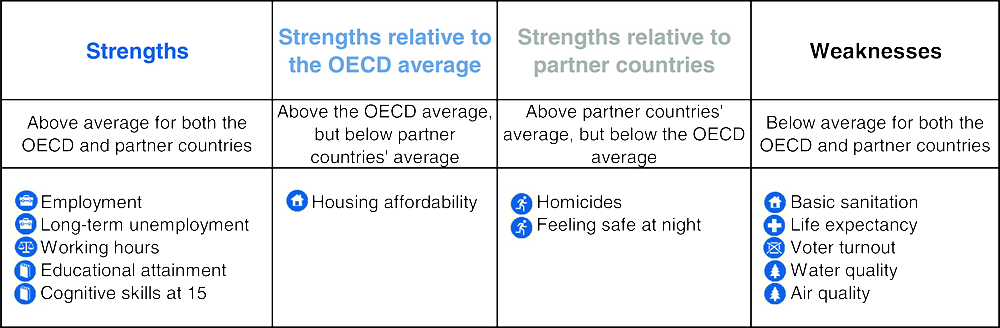
Figure 5.40 shows the Russian Federation’s relative strengths and weaknesses in well-being, with reference to both the OECD average and the average outcomes of the OECD partner countries considered in How’s Life? 2017 (i.e. Brazil, Colombia, Costa Rica, Lithuania, the Russian Federation and South Africa).

The Russian Federation has several areas of strength relative to both the OECD and the partner countries. At 70% in 2016, the employment rate is the highest among the OECD partner countries, and higher than the OECD average (67%). Adults’ upper secondary educational attainment (almost 95%) and students’ cognitive skills at age 15 are the highest among the OECD partner countries, and above the OECD average. Long-term unemployment is low compared to several partner countries, and stands below the OECD average.

Social support is in line with both the OECD and partner country average: 90% of Russians reported having friends or relatives whom they can count on in times of trouble.

The Russian Federation performs better or close to the OECD average, but below the average for partner countries in one area: housing is more affordable, on average, than in the OECD, but is less affordable than among the OECD partner countries.

There are also some areas where the Russian Federation’s performance is above average for the partner countries but below the OECD average. The homicide rate is lower than the average of OECD partner countries, but exceeds the OECD average. 52% of Russians feel safe walking alone at night in the area where they live, above the partner country average (43%) but below that for the OECD (almost 69%).

The Russian Federation also has several areas of weakness compared to both the OECD and the other partner countries. The share of people living in housing without access to basic sanitation is high compared to both the OECD and partner country averages. Life expectancy is close to the average of the partner countries but 9 years below the OECD average. Voter turnout (65% in 2012) stands below both the OECD average (69%) and that of the partner countries (70%). Finally, both air quality and satisfaction with local water quality lie below the OECD and partner country averages.

Figure 5.40. Current well-being strengths and weaknesses in the Russian Federation
picture

Note : Both the OECD and partner country averages are typically population-weighted (see the online data annex for further details). Only headline well-being indicators with a complete or almost complete coverage of OECD partner countries are considered (i.e. one or no missing countries per indicator).

 StatLink https://doi.org/10.1787/888933599612

Change in the Russian Federations’ average well-being over the past 10 years

Dimension

Description

Change

Income and wealth

Household net adjusted disposable income increased by 11% between 2011 and 2014, but remains considerably lower than the OECD average level.

Jobs and earnings

The employment rate has risen by 6 percentage points since 2005, compared to 1.2 points for the OECD on average. At 1.6% in 2016, the long-term unemployment rate has almost halved from 2005 (2.8%), while job strain has improved by more than 8 percentage points over the past decade.

Housing conditions

The average number of rooms per person has remained stable over the past 10 years. Basic sanitation has improved: the share of households lacking an indoor flushing toilet has fallen from 18.8% to 14.8%. Housing has become more affordable since 2011, with the average share of household disposable income spent on housing costs falling by 1 percentage point.

Work-life balance

At just below 0.2%, the share of employees working 50 hours or more per week in 2016 is very similar to the level reported in 2005.

Health status

The 10-year change in life expectancy at birth cannot be assessed, due to a recent break in the data. However, between 2005 and 2013 life expectancy increased by 5 years. The percentage of adults reporting to be in “good” or “very good” health has also increased, by 6 points between 2012 and 2016.

Education and skills

Over the last 10 years, the percentage of adults attaining an upper secondary level of education increased by over 4 points.

Social connections

Social support has increased, with the share of the population reporting that they have relatives or friends whom they can count on to help in case of need rising from 86% to 90%.

Civic engagement

At 65%, voter turnout in the 2012 presidential elections was considerably lower than in 2008 (70%), with a stronger decline than for the OECD average.

Environmental quality

The percentage of people satisfied with their local water quality is currently 24 points higher than 10 years ago. However, annual exposure to PM2.5 air pollution has remained relatively stable over the past decade.

Personal security

The homicide rate fell from 25 deaths per 100 000 in 2005 to 11.3 in 2011 (the latest available year). The proportion of people declaring that they feel safe when walking alone at night has increased by 25 percentage points.

Subjective well-being

Average levels of life satisfaction have increased from 5.1 (on a 0 to 10 scale) to 6.0 over the past decade.

Note : For each indicator in every dimension: ➚ refers to an improvement; ↔ indicates little or no change; and ➘ signals deterioration. This is based on a comparison of the starting year (2005 in most cases) and the latest available year (usually 2015 or 2016). The order of the arrows shown in column three corresponds to that of the indicators mentioned in column two.

The Russian Federation’s resources and risks for future well-being: Illustrative indicators

picture