How's life in the United States?

Relative to other OECD countries, the United States performs well in terms of material living conditions: the average household net adjusted disposable income was the highest in the OECD in 2015, and the average American enjoys good housing conditions and a low long-term unemployment rate. However, work-life balance is an area of comparative weakness: over 11% of employees work very long hours, and full-time employees report having less time off than in most other OECD countries. At 79 years, life expectancy falls within the bottom third of the OECD. A high share of Americans report good levels of perceived health, although these data are not directly comparable with those of the other OECD countries due to a difference in the reporting scale. Moreover, nearly 90% of the adult working-age population have attained at least an upper secondary education. However, the skills of both American adults and 15-year-olds are lower than the OECD averages. Furthermore, the United States has the third-highest rate of homicides in the OECD.

Figure 5.35. The United States’ average level of current well-being: Comparative strengths and weaknesses
picture

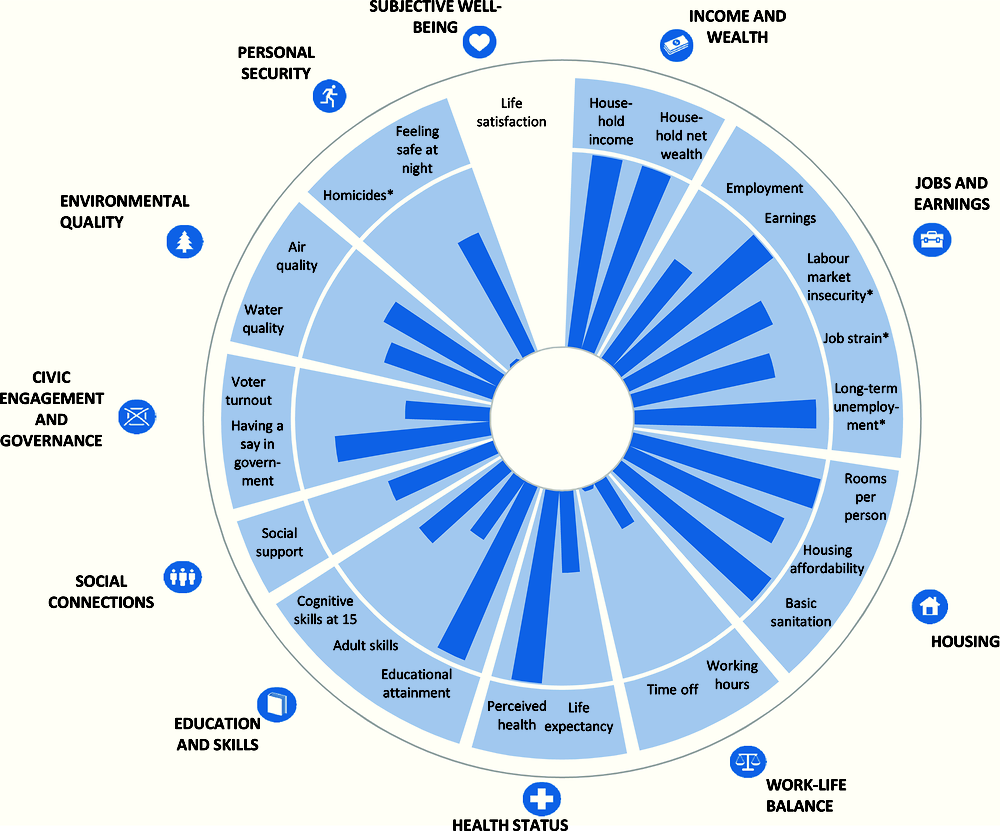
Note : This chart shows the United States’ relative strengths and weaknesses in well-being when compared with other OECD countries. For both positive and negative indicators (such as homicides, marked with an “*”), longer bars always indicate better outcomes (i.e. higher well-being), whereas shorter bars always indicate worse outcomes (lower well-being). If data are missing for any given indicator, the relevant segment of the circle is shaded in white.

 StatLink https://doi.org/10.1787/888933599517

Change in the United States’ average well-being over the past 10 years

Dimension

Description

Change

Income and wealth

The average household net adjusted disposable income has risen by 11% cumulatively over the past decade, in real terms. This is despite two periods of stalled growth in 2008-9 and 2012-13.

Jobs and earnings

Although the employment rate has made a gradual recovery since 2011, it is still below the 72% level reached in 2006. Real earnings improved consistently over the past decade. However, labour market insecurity also increased sharply during the crisis and is yet to recover. Both long-term unemployment and job strain are currently at similar levels to those recorded a decade ago.

Housing conditions

The average number of rooms per person has increased from 2.3 in 2005-2010 to 2.4 in 2011-2015, and access to basic sanitation has remained stably high. Housing affordability has improved in the last decade: the proportion of income spent on housing costs has fallen from 19.5% in 2005 to 18.4% in 2015.

Work-life balance

At 11.4%, the share of employees working 50 hours or more per week in 2016 is very similar to the level reported in 2005.

Health status

Despite an overall improvement since 2005, the United States continues to lag behind the OECD average in terms of life expectancy, and the gap has widened from 0.8 years in 2005 to 1.3 years in 2015. Perceived health has remained relatively stable.

Education and skills

Since 2005, the United States has recorded one of the highest shares of adults with at least an upper secondary level of education in the OECD. Reflecting this high starting point, the cumulative growth rate has been only 3% in the last decade.

Social connections

The share of people reporting to have relatives or friends whom they can count on to help in case of need fell over the past decade from 96% to 90%.

Civic engagement

Voter turnout in last year’s Presidential elections increased slightly compared to 2012, but was still below the 70.3% turnout in 2008. This is in line with the OECD average trend, which has fallen by 2.4% since 2005.

Environmental quality

Satisfaction with local water quality has remained stable in the last few years. However, annual exposure to PM2.5 air pollution has improved over the past decade, and in 2013 the level reported was 14% lower than in 2005.

Personal security

Although the homicide rate has fallen by 18% over the decade, it is still among the highest in the OECD. Feelings of safety are broadly similar to their level 10 years ago.

Subjective well-being

People’s life satisfaction has fallen gradually during the past 10 years, from an average of 7.3 to 6.9 (measured on a 0-10 scale). This is twice as large as the OECD average decline.

Note : For each indicator in every dimension: ➚ refers to an improvement; ↔ indicates little or no change; and ➘ signals deterioration. This is based on a comparison of the starting year (2005 in most cases) and the latest available year (usually 2015 or 2016). The order of the arrows shown in column three corresponds to that of the indicators mentioned in column two.

The United States’ resources and risks for future well-being: Illustrative indicators

picture