How's life in Ireland?

Relative to other OECD countries, Ireland’s performance across the different well-being dimensions is mixed. While Ireland’s average household net adjusted disposable income was below the OECD average in 2015, average earnings were among the highest in the OECD (around 52 000 USD compared to an average of 44 000). At around 5%, the long-term unemployment rate is more than twice the OECD average, but both labour market insecurity and job strain are better than average. Housing conditions, health status and environmental quality are generally good, while civic engagement and governance is an area of comparative weakness. 80% of Irish adults have attained at least an upper secondary education, which is above the OECD average (75%), yet adult literacy and numeracy skills are in the lowest tier of the OECD. Perceived social support is a clear area of comparative strength: almost 96% of the Irish population reported having friends or relatives whom they can count on in times of trouble, compared to the OECD average of 89%.

Figure 5.15. Ireland’s average level of current well-being: Comparative strengths and weaknesses
picture

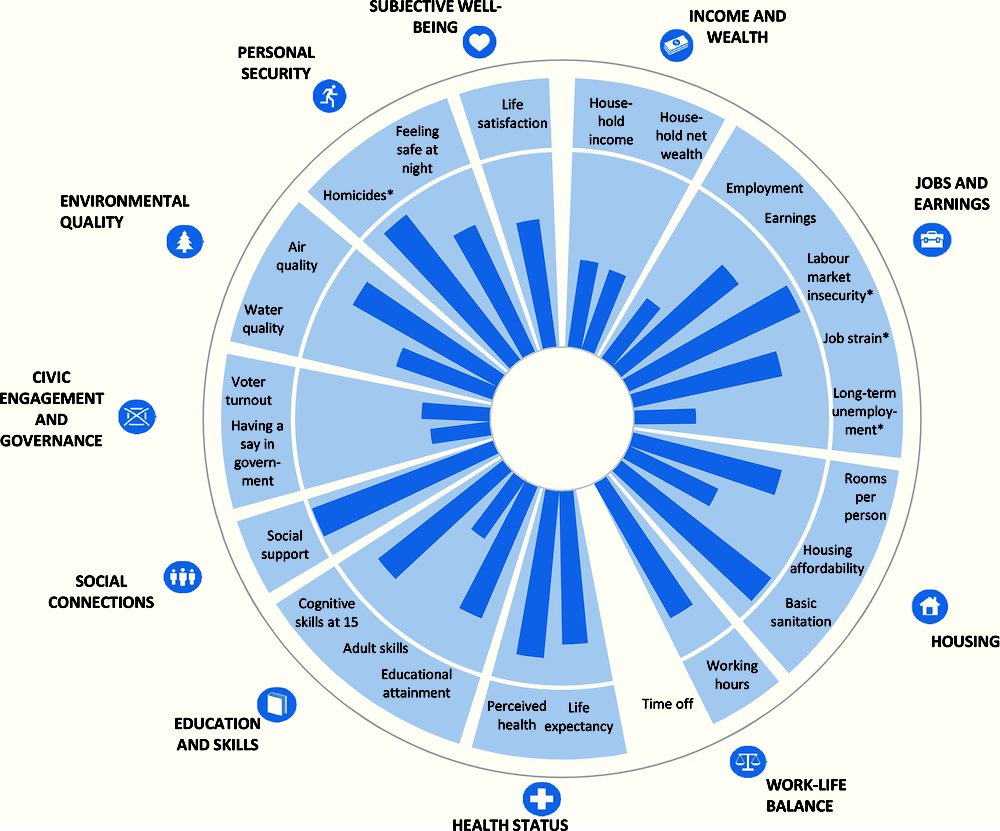
Note : This chart shows Ireland’s relative strengths and weaknesses in well-being when compared with other OECD countries. For both positive and negative indicators (such as homicides, marked with an “*”), longer bars always indicate better outcomes (i.e. higher well-being), whereas shorter bars always indicate worse outcomes (lower well-being). If data are missing for any given indicator, the relevant segment of the circle is shaded in white.

 StatLink https://doi.org/10.1787/888933599137

Change in Ireland’s average well-being over the past 10 years

Dimension

Description

Change

Income and wealth

The current level of household net adjusted disposable income is 4% higher, in real terms, than in 2005. Following a sustained period of growth, household income fell between 2009 and 2013, and began to recover only in 2014.

Jobs and earnings

The employment rate is now 2.8 percentage points lower than in 2005; after falling significantly between 2007 and 2012, it has recovered only moderately in recent years. Conversely, earnings have risen and are currently 15% higher (in real terms) than in 2005 – although they remain just below their 2009 peak. Following a very strong increase between 2007 and 2008, labour market insecurity has now returned to its 2005 level (2%). Long-term unemployment peaked at 9.2% in 2012, and despite falling to 4.7% since then, it is still three times higher than in 2005. After having peaked at 35% in 2010, the share of Irish employees suffering from job strain has now fallen to 27%, close to the 2005 level.

Housing conditions

The number of rooms per person has remained relatively stable since 2005, just above the OECD average. Housing affordability has worsened: the proportion of household disposable income spent on housing costs has risen from 19.3% in 2005 to 20.8% in 2015. Ireland is one of few OECD countries where the percentage of people living in dwellings without basic sanitary facilities has increased since 2005.

Work-life balance

After falling to a low of 3.4% in 2009, the share of employees working 50 hours or more per week has increased back to 4.7% in 2016, the same level as in 2005.

Health status

Life expectancy at birth has increased by two-and-a-half years since 2005, and is now higher than the OECD average by just over a year. Perceived health status has remained relatively stable at above the OECD average.

Education and skills

The 10-year change in upper secondary educational attainment cannot be assessed, due to a recent break in the data. However, between 2014 and 2015, attainment rates in Ireland increased by 1 percentage point.

Social connections

The percentage of people who have relatives or friends whom they can count on to help in case of need has seen little change since 2005-07.

Civic engagement

At 69.9%, voter turnout in the 2011 parliamentary elections was slightly higher than in 2007, but then dropped to 65.1% in 2016. This is in line with the OECD average trend, which has seen voter turnout decline by 2.4 percentage points over the last decade.

Environmental quality

Consistent with the OECD average, satisfaction with local water quality has fallen slightly in the last few years. On the other hand, annual exposure to air pollution has changed very little since 2005 and was still half the OECD average in 2013.

Personal security

There have been clear signs of progress in personal security since 2005: the homicide rate has decreased by 40%, and the share of people declaring that they feel safe when walking alone at night has risen by 5 percentage points.

Subjective well-being

Life satisfaction in recent years is similar to the levels reported 10 years earlier.

Note : For each indicator in every dimension: ➚ refers to an improvement; ↔ indicates little or no change; and ➘ signals deterioration. This is based on a comparison of the starting year (2005 in most cases) and the latest available year (usually 2015 or 2016). The order of the arrows shown in column three corresponds to that of the indicators mentioned in column two.

Ireland’s resources and risks for future well-being: Illustrative indicators

picture