How's life in Iceland?

In general, Iceland performs well across the different well-being dimensions relative to other OECD countries. 86% of the Icelandic population aged 15-64 was in employment in 2016, the largest share in the OECD, and average earnings are in the top tier of the OECD. Iceland is the OECD’s top performer in terms of environmental quality: air quality (measured as average exposure to PM2.5 air pollution) is the best in the OECD, and almost everybody in Iceland is satisfied with their local water quality. 98% of Icelanders report that they have friends or relatives whom they can count on in times of trouble, the highest share in the OECD. Personal security and life satisfaction are also areas of comparative strength. In terms of housing conditions, access to basic sanitation is high, but Icelanders spend a higher proportion of their disposable income on housing costs (24%) relative to the OECD average (21%), making housing affordability in Iceland a clear area of comparative weakness.

Figure 5.14. Iceland’s average level of current well-being: Comparative strengths and weaknesses
picture

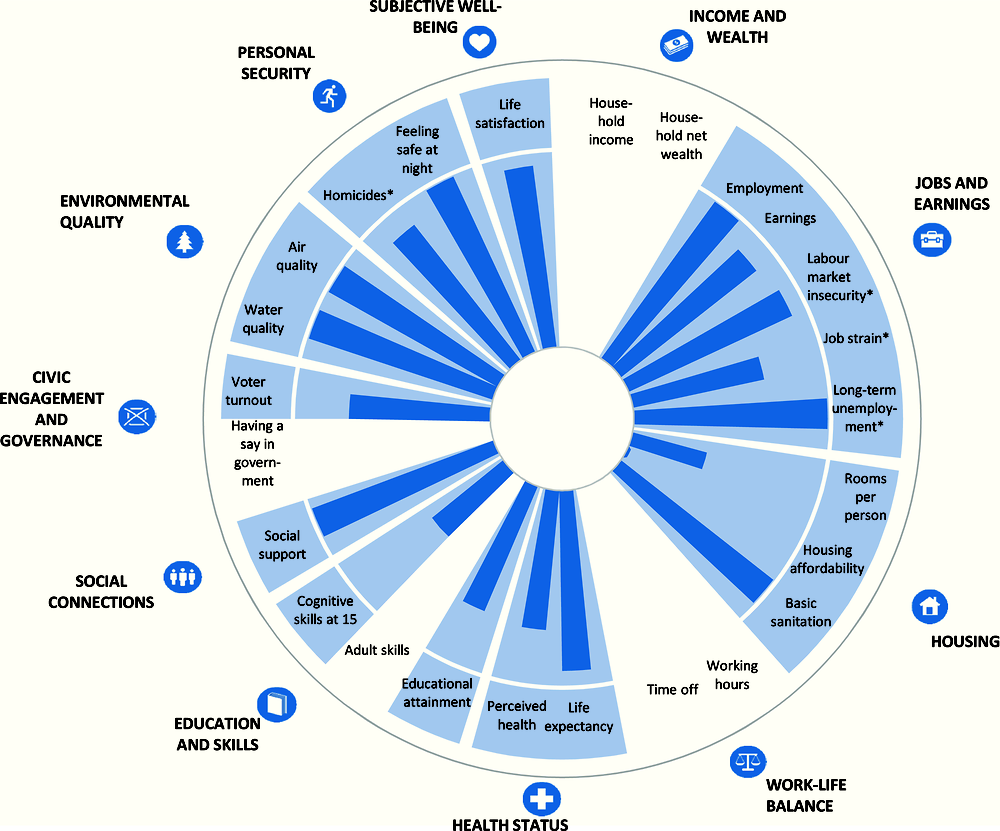
Note : This chart shows Iceland’s relative strengths and weaknesses in well-being when compared with other OECD countries. For both positive and negative indicators (such as homicides, marked with an *), longer bars always indicate better outcomes (i.e. higher well-being), whereas shorter bars always indicate worse outcomes (lower well-being). If data are missing for any given indicator, the relevant segment of the circle is shaded in white.

 StatLink https://doi.org/10.1787/888933599118

Change in Iceland’s average well-being over the past 10 years

Dimension

Description

Change

Income and wealth

After falling substantially between 2008 and 2010, household net adjusted disposable income has gradually climbed back to its 2005 level, in real terms, in 2014. Nevertheless, it has yet to regain its 2008 peak.

Jobs and earnings

In 2016, the employment rate was 2 percentage points higher than in 2005, having fallen sharply in 2009 and gradually recovered since. Earnings increased by 5% (in real terms) over the decade, but labour market insecurity reached a peak of 5.7% in 2011, and still has not recovered to its pre-crisis level of 1%. Long-term unemployment rose sharply during the crisis, but has since fallen back to 2005 levels.

Housing conditions

Although the average number of rooms per person has remained relatively stable over the past decade, spending on housing costs (as a proportion of household disposable income) went up from 22.6% in 2005 to 24.4% in 2014. The share of people living in dwellings without basic sanitary facilities has fallen from 0.4% to 0% in the last 10 years.

Work-life balance

[No time series data available]

..

Health status

Despite a slight fall between 2014 and 2015, life expectancy at birth has increased by 2 years overall since 2005, and is now over 2 years higher than the OECD average. Conversely, the share of Icelanders reporting to be in “good” or “very good” health has remained relatively stable.

Education and skills

Between 2005 and 2015, there has been a sustained improvement in the share of working-age adults who have attained at least an upper secondary level of education: at 78% in 2016, it was nearly 10 points higher than in 2005.

Social connections

The current level of social support has not changed significantly compared to 2008-2010, and it is still the highest in the OECD.

Civic engagement

At 79.2%, voter turnout in the 2016 parliamentary elections was considerably lower than in 2013, and below the 83.6% turnout in 2007 as well. This is in line with the OECD average trend, which has seen voter turnout decrease by 2.4 percentage points over the last decade.

Environmental quality

Satisfaction with local water quality has remained relatively stable, and is still among the highest in the OECD. Annual exposure to PM2.5 air pollution has meanwhile remained stably low over the past decade, and in 2013 it was 78% lower than the OECD average level.

Personal security

The number of deaths due to assault has seen little change over the past decade, while the proportion of people declaring that they feel safe when walking alone at night has increased by 10 percentage points.

Subjective well-being

[No time series data available]

..

Note : For each indicator in every dimension: ➚ refers to an improvement; ↔ indicates little or no change; and ➘ signals deterioration. This is based on a comparison of the start year (2005 in most cases) and the latest available year (usually 2015 or 2016). The order of the arrows shown in column three corresponds to that of the indicators mentioned in column two.

Iceland’s resources and risks for future well-being: Illustrative indicators

picture