How's life in Finland?

In general, Finland performs well across the different well-being dimensions relative to other OECD countries. Despite levels of household net adjusted disposable income and household net wealth that fall below the OECD average, Finland benefits from comparatively low levels of both job strain and labour market insecurity. Only around 4% of Finnish employees regularly work very long hours, approximately one-third of the OECD average level, but time off (i.e. time spent on leisure and personal care) is close to the average. Finland performs very well in terms of education and skills as well as social support: 95% of Finns report having friends or relatives whom they can count on in times of trouble, compared to the OECD average of 89%. Air and water quality are both areas of comparative strength, and in 2013, life satisfaction in Finland was among the highest in the OECD. However, housing affordability is below the OECD average, and despite having a comparatively high share of people who feel that they have a say in what the government does (47%, compared to 33% for the OECD on average), Finland has a mid-ranking level of voter turnout.

Figure 5.9. Finland’s average level of current well-being: Comparative strengths and weaknesses
picture

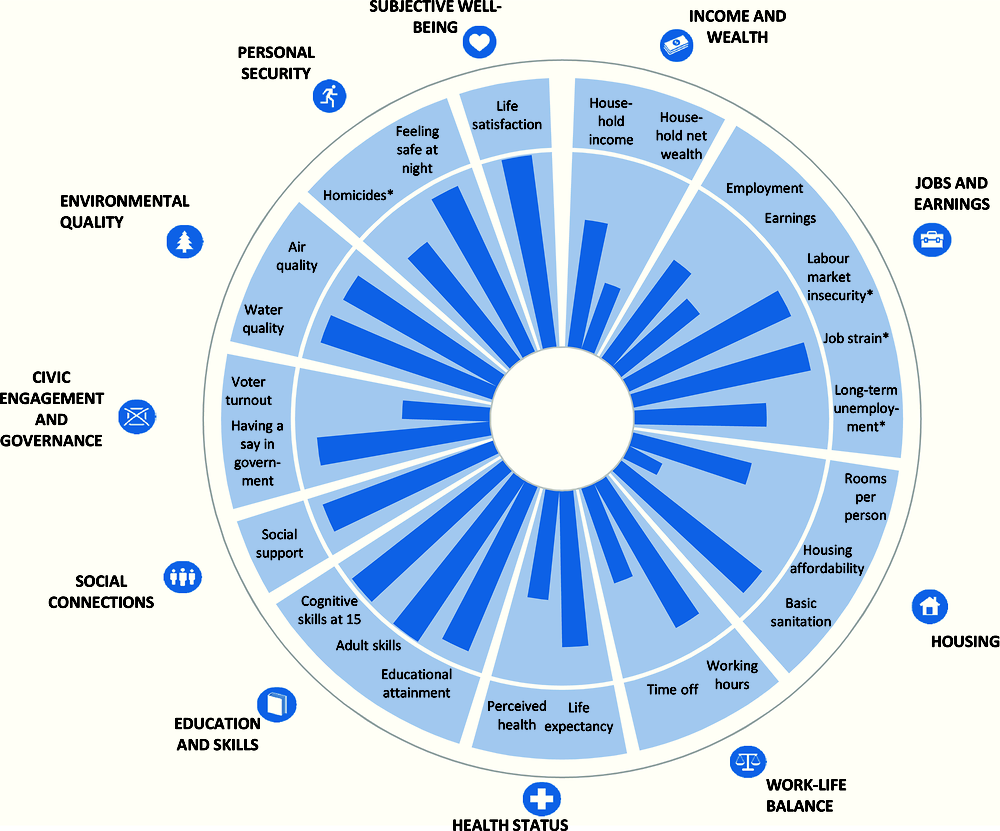
Note : This chart shows Finland’s relative strengths and weaknesses in well-being when compared with other OECD countries. For both positive and negative indicators (such as homicides, marked with an “*”), longer bars always indicate better outcomes (i.e. higher well-being), whereas shorter bars always indicate worse outcomes (lower well-being). If data are missing for any given indicator, the relevant segment of the circle is shaded in white.

 StatLink https://doi.org/10.1787/888933599023

Change in Finland’s average well-being over the past 10 years

Dimension

Description

Change

Income and wealth

Household net adjusted disposable income is now 8% higher, in real terms, than 10 years ago. However, the steady growth since 2005 peaked in 2011, with a moderate fall since then. In real terms, Finnish household net wealth was 15% higher in 2013 than it was in 2010.

Jobs and earnings

The employment rate has made a gradual recovery since 2011 and is now close to its level in 2005, but it remains 2 points below its 2008 peak. Average earnings improved consistently over the past decade (with a cumulative growth of 8%). However, labour market insecurity has also increased slightly. Following a period of improvement, long-term unemployment rose sharply during the crisis, then declined from 2010 to 2012, but has grown beyond 2005 levels since then. In 2015, the incidence of job strain was similar to levels reported in 2005.

Housing conditions

The average number of rooms per person has been stable over the decade, and so has access to basic sanitation. Housing affordability has meanwhile worsened during this period, with the proportion of income spent on housing costs climbing from 20.9% in 2005 to 22.7% in 2015.

Work-life balance

The proportion of people working very long hours is slightly lower than it was a decade ago, and, at 3.9%, it now stands nearly 9 percentage points below the OECD average.

Health status

Life expectancy at birth has improved by 2.5 years in Finland since 2005, a stronger gain than the OECD average increase of 1.7 years. Self-reported health has remained relatively stable over the last decade.

Education and skills

The 10-year change in upper secondary educational attainment cannot be assessed, due to a recent break in the data. However, between 2014 and 2016, attainment rates increased by 1.4 percentage points.

Social connections

The percentage of people who have relatives or friends whom they can count on to help in case of need has seen little change in Finland over the decade.

Civic engagement

Voter turnout among the population registered to vote fell by 5 points between the 2006 and 2012 presidential elections – slightly more than the OECD average fall of 2.4 points.

Environmental quality

Consistent with the OECD average trend, there has been no major change in the level of satisfaction with local water quality since 2005. Exposure to PM2.5 air pollution has however improved over the past decade, and in 2013 it was 55% lower than the OECD average level.

Personal security

At 83%, the proportion of Finns who report feeling safe when walking alone at night is currently 4 points higher than 10 years ago. Similarly, the rate of deaths due to assault has fallen by a quarter over the decade.

Subjective well-being

People’s life satisfaction has remained relatively stable in Finland during the last 10 years.

Note : For each indicator in every dimension: ➚ refers to an improvement; ↔ indicates little or no change; and ➘ signals deterioration. This is based on a comparison of the starting year (2005 in most cases) and the latest available year (usually 2015 or 2016). The order of the arrows shown in column three corresponds to that of the indicators mentioned in column two.

Finland’s resources and risks for future well-being: Illustrative indicators

picture