How's life in Canada?

Canada typically performs above the OECD average level across most of the different well-being indicators shown below. It falls within the top tier of OECD countries on household net wealth, the employment rate is high (73% in 2016), the long-term unemployment rate is low (0.8% in 2016) and fewer than 4% of employees usually work 50 hours or more per week, less than a third of the OECD average rate. However, full-time employees on average reported having less time off (i.e. time spent on leisure and personal care) than those in most other OECD countries. Housing conditions are generally good, but housing affordability stood below the OECD average in 2016. The average Canadian enjoys relatively good air and water quality, and both feelings of security and life satisfaction are among the highest in the OECD area. A high share of Canadians also report good levels of perceived health, although these data are not directly comparable with those of the other OECD countries, due to a difference in the reporting scale.

Figure 5.4. Canada’s average level of current well-being: Comparative strengths and weaknesses
picture

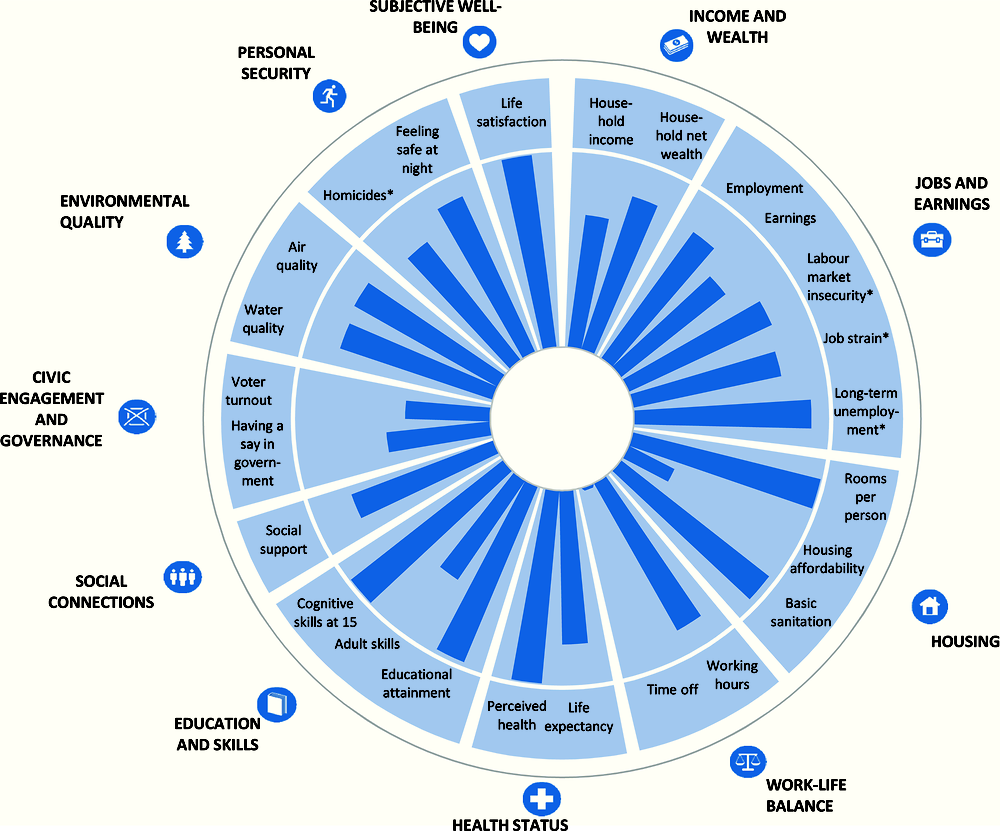
Note : This chart shows Canada’s relative strengths and weaknesses in well-being when compared with other OECD countries. For both positive and negative indicators (such as homicides, marked with an “*”), longer bars always indicate better outcomes (i.e. higher well-being), whereas shorter bars always indicate worse outcomes (lower well-being). If data are missing for any given indicator, the relevant segment of the circle is shaded in white.

 StatLink https://doi.org/10.1787/888933598928

Change in Canada’s average well-being over the past 10 years

Dimension

Description

Change

Income and wealth

Household net adjusted disposable income has risen by 20% cumulatively over the past decade in Canada, overtaking the OECD average in 2013-2014.

Jobs and earnings

In 2016, the employment rate in Canada was very close to its 2005 level, having fallen sharply in 2009 and gradually recovered since. Average earnings have increased strongly, and are now 18% higher, in real terms, than in 2005. Like most OECD countries, in Canada labour market insecurity was higher in 2015 than in 2007, although there has been some improvement since the 2009 peak. Although starting from a low base, long-term unemployment doubled between 2008 and 2016, and stands above its 2005 levels.

Housing conditions

The number of rooms per person has remained stable in the Canada over the past decade, and is the highest in the OECD. Housing affordability has slightly improved since 2005.

Work-life balance

The proportion of employees working 50 hours or more per week has decreased gradually over the last 10 years, from 4.7% in 2005 to 3.7% in 2016.

Health status

Life expectancy at birth in Canada increased from 80.5 years in 2007 to 81.5 in 2012 (comparable data for 2005 and 2015 are not available). The share of adults reporting to be in good health has remained relatively stable since 2005, at around 88%.

Education and skills

In line with the OECD average trend, the share of adults with at least an upper secondary level of education has increased from 85% in 2005 to 91% in 2016.

Social connections

The percentage of people who have relatives or friends whom they can count on to help in case of need has fallen slightly (from 96% to 93%) in the last 10 years in Canada.

Civic engagement

Voter turnout in parliamentary elections increased by nearly 4 percentage points in the last 10 years in Canada. This upward trend was particularly pronounced between the 2011 and 2015 federal elections, when the share of votes cast among the population registered to vote grew from 61% to 68%.

Environmental quality

The proportion of Canadians satisfied with their local water quality has risen from 87% to 91% over the last decade and is currently among the highest in the OECD. Annual exposure to PM2.5 air pollution improved substantially between 2005 and 2008, and has remained relatively stable in recent years.

Personal security

The rate of deaths due to assault fell in Canada from 2005 to 2012, whereas the share of people saying that they feel safe when walking alone at night increased by 4 percentage points over the decade – in line with the trend in over half of the OECD countries where data is available.

Subjective well-being

Life satisfaction in Canada has been broadly unchanged over the past 10 years.

Note : For each indicator in every dimension: ➚ refers to an improvement; ↔ indicates little or no change; and ➘ signals deterioration. This is based on a comparison of the starting year (2005 in most cases) and the latest available year (usually 2015 or 2016). The order of the arrows shown in column three corresponds to that of the indicators mentioned in column two.

Canada’s resources and risks for future well-being: Illustrative indicators

picture