How's life in Australia?

In general, Australia performs well across the different well-being dimensions relative to other OECD countries. Air quality is among the best in the OECD, and average household net adjusted disposable income and household net wealth were among the highest in the OECD in 2015 and 2014 respectively. Despite a good performance in jobs and earnings, Australia lies below the OECD average in terms of work-life balance: Australian full-time employees reported having 30 minutes less time off (i.e. time spent on leisure and personal care) than those in other OECD countries, and more than 13% of employees regularly worked 50 hours or more per week in 2016. In terms of personal security, despite the comparatively low homicide rate, only 64% of Australians felt safe walking alone at night, compared to the OECD average of 69% in the period 2014-16. A high share of Australians report good levels of perceived health, although these data are not directly comparable with those of the other OECD countries, due to a difference in the reporting scale.

Figure 5.1. Australia’s average level of current well-being: Comparative strengths and weaknesses
picture

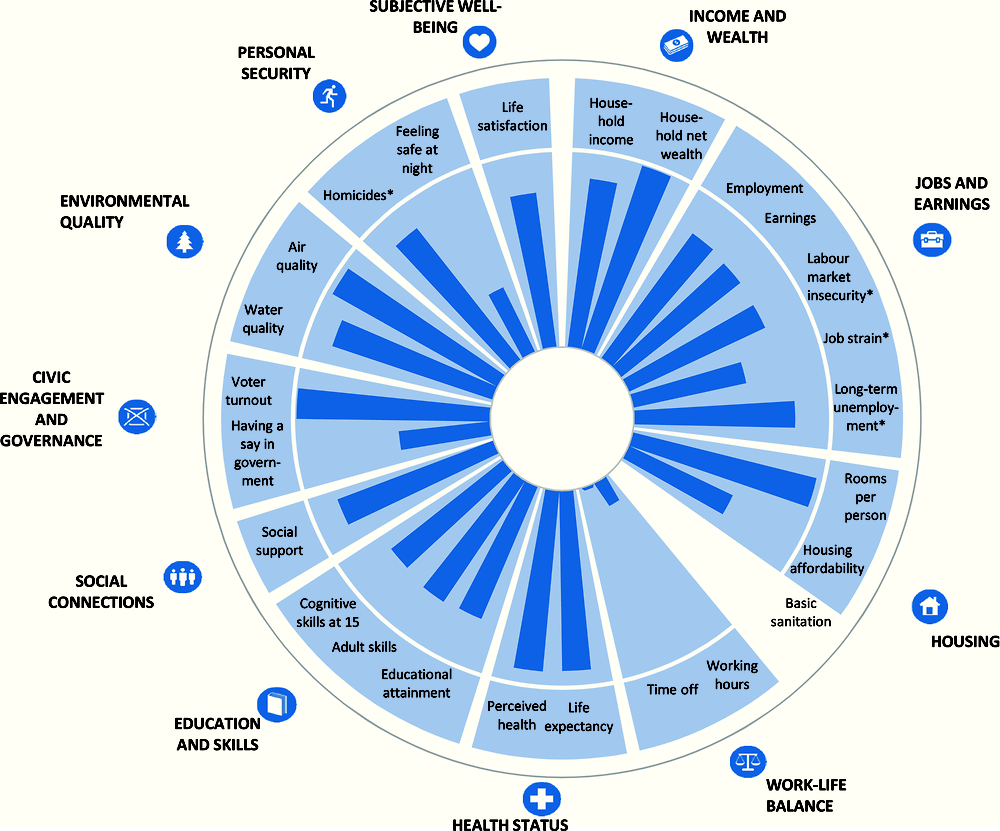
Note : This chart shows Australia’s relative strengths and weaknesses in well-being when compared with other OECD countries. For both positive and negative indicators (such as homicides, marked with an “*”), longer bars always indicate better outcomes (i.e. higher well-being), whereas shorter bars always indicate worse outcomes (lower well-being). If data are missing for any given indicator, the relevant segment of the circle is shaded in white.

 StatLink https://doi.org/10.1787/888933598871

Change in Australia’s average well-being over the past 10 years

Dimension

Description

Change

Income and wealth

Household net adjusted disposable income has increased considerably in Australia over the past decade. After rising sharply from 2005 to 2008, it fell during the first year of the financial crisis before recovering up until 2011, when growth took another hit. It stabilised since then at one of the highest levels in the OECD. Household net wealth meanwhile grew by 10% cumulatively between 2012 and 2014.

Jobs and earnings

Earnings in Australia are currently 10% higher (in real terms) than in 2005, but there has been a slight decline in recent years following a peak in 2011-2012. Although employment rates have remained relatively stable, other jobs indicators have all worsened since 2008: the share of people experiencing job strain increased by 3 percentage points; labour market insecurity remains as high as it was at the peak of the crisis; and long-term unemployment has doubled since 2007.

Housing conditions

Despite a sharp drop in 2008, housing costs (as a proportion of disposable income) have risen and are now 1 percentage point higher than a decade ago. The number of rooms per person has remained relatively stable at 2.3, which is the fourth highest in the OECD.

Work-life balance

The share of employees working 50 hours or more per week in Australia has fallen by 2.1 percentage points in the past decade, a steeper fall than the 0.9 recorded for the OECD on average.

Health status

While life expectancy at birth has improved consistently in Australia since 2005, the 1.6 years gained is slightly below the OECD average increase. Self-reported health has remained relatively stable, with 85% of adults reporting to be in “good” or “very good” health from 2007 to 2014.

Education and skills

The 10-year change in upper secondary educational attainment cannot be assessed due to a recent break in the data. However, between 2014 and 2016, attainment rates in Australia increased by 2.8 percentage points.

Social connections

The share of people who have relatives or friends whom they can count on to help in case of need has remained reasonably stable in the past 10 years.

Civic engagement

Despite compulsory voting, voter turnout (among the population registered to vote) has fallen by 4 percentage points between the 2007 and 2016 parliamentary elections.

Environmental quality

The share of the population exposed to fine particulate matter (PM2.5) air pollution has been stable in Australia since 2009, after having improved slightly between 2005 and 2009. Satisfaction with local water quality has improved since 2005 by 5.6 percentage points.

Personal security

The number of deaths due to assault was stably low in Australia from 2006 to 2014. The proportion of people who report feeling safe when walking alone at night has also remained reasonably stable.

Subjective well-being

Life satisfaction in Australia has remained broadly stable and at relatively high levels over the past decade.

Note : For each indicator in every dimension: ➚ refers to an improvement; ↔ indicates little or no change; and ➘ signals deterioration. This is based on a comparison of the starting year (2005 in most cases) and the latest available year (usually 2015 or 2016). The order of the arrows shown in column three corresponds to that of the indicators mentioned in column two.

Australia’s resources and risks for future well-being: Illustrative indicators

picture