Mortality from all causes
The burden from non-communicable diseases among adults – the most economically productive age group – is rapidly increasing in Asia-Pacific. Increasing development in countries is bringing an “epidemiological transition”, whereby early deaths are replaced by late deaths, and communicable diseases by non-communicable diseases (Omran, 2005). The level of adult mortality, all-cause mortality for the population and cause of death are important for identifying the country’s public health priorities and assessing the effectiveness of a country’s health system.
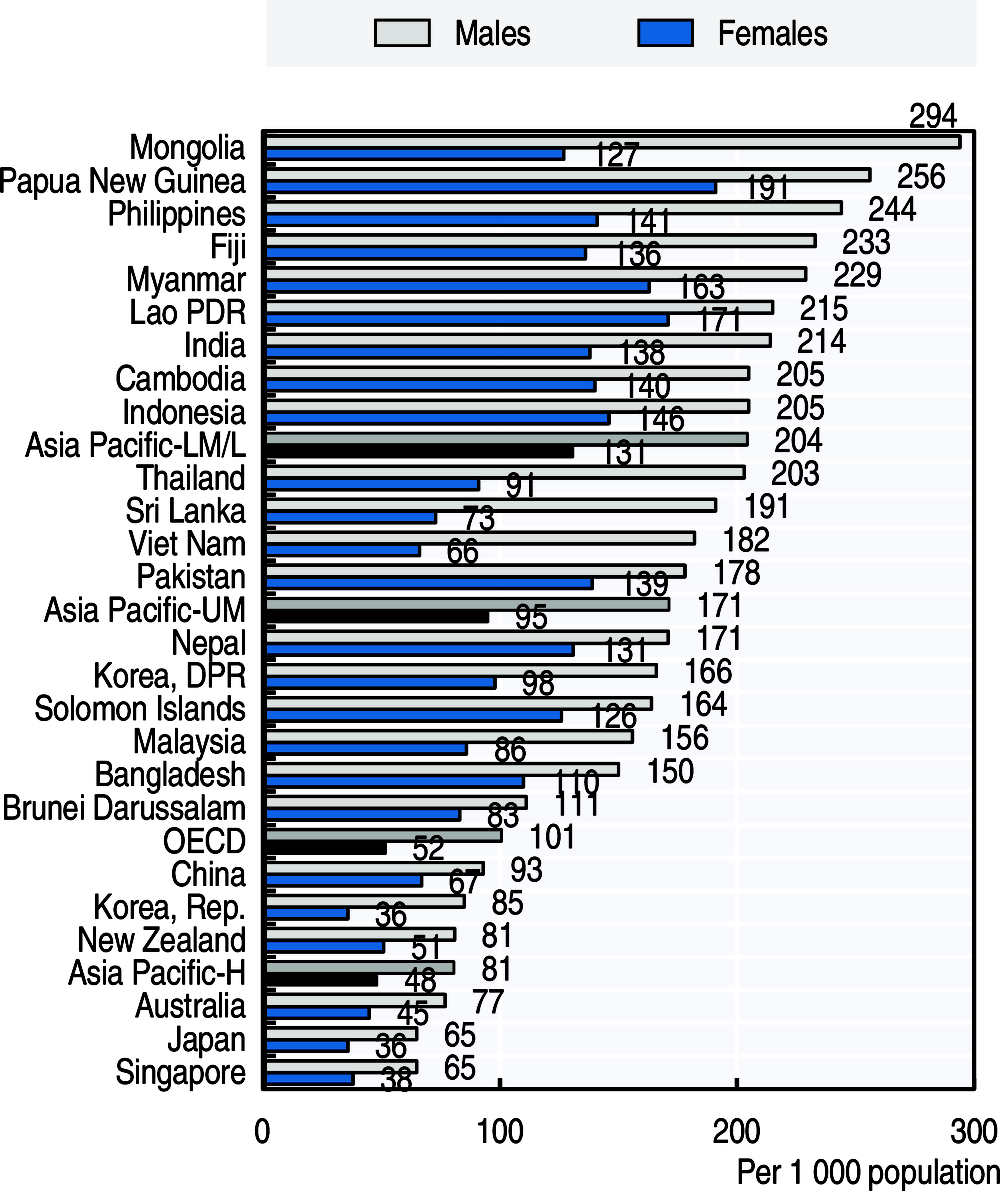
There are wide disparities in adult mortality in the region. For males in 2016, the probability of dying between ages 15 and 60 ranged from a low of 65 per 1 000 population in Singapore and Japan to 294 per 1 000 in Mongolia (Figure 3.8). It also exceeded 250 per 1 000 population in Papua New Guinea, and was less than 80 also in Australia. Among females, the probability ranged from 36 per 1 000 population in the Republic of Korea and Japan to a high of 191 in Papua New Guinea. Probabilities were also less than 40 in Singapore. Mortality was higher among men than women across countries and in Viet Nam, Sri Lanka, the Republic of Korea, Mongolia and Malaysia, rates for men were more than twice as high as those for females. Across lower-middle and low income Asia-Pacific countries, the average probability of dying was 204.3 per 1 000 population for adult men and 130.7 per 1 000 population for adult women, still much higher than the average adult mortality in OECD countries (101 per 1 000 population for men and 52 per 1 000 population for women), and higher than the average adult mortality in upper-middle income Asia-Pacific countries (171.3 for men and 95 for women).
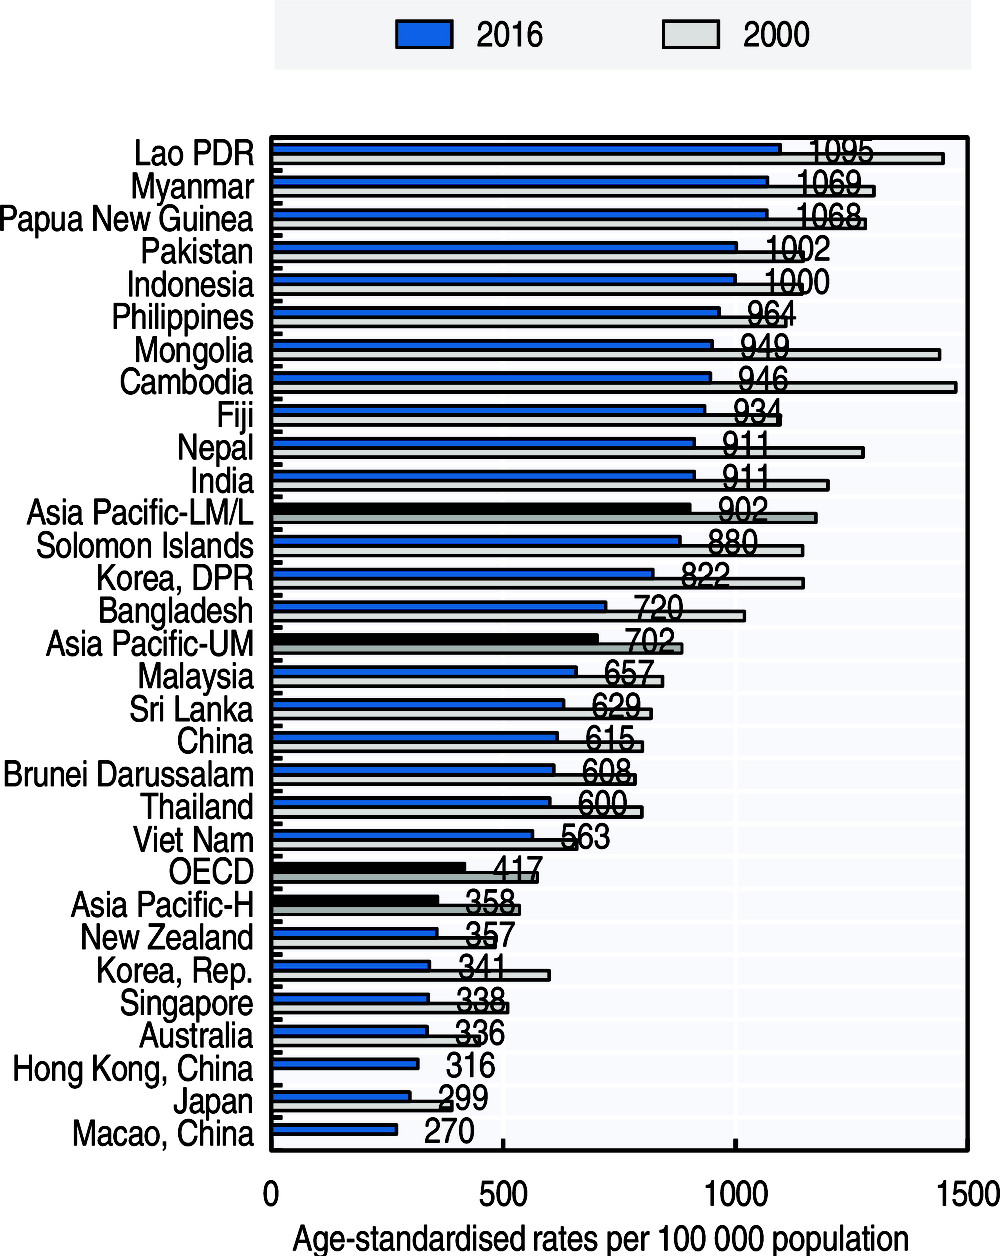
All-cause mortality for the entire population ranged from less than 300 per 100 000 population in Japan and Macau, China, to over 1 000 in Pakistan, Papua New Guinea, Myanmar and the Lao PDR (Figure 3.9). The average rate in lower-middle and low income Asia-Pacific countries was 902, 50% higher than that of the OECD. Nonetheless, mortality for the entire population had declined in all reporting Asia-Pacific between 2000 and 2016, and the gap with OECD countries had narrowed.
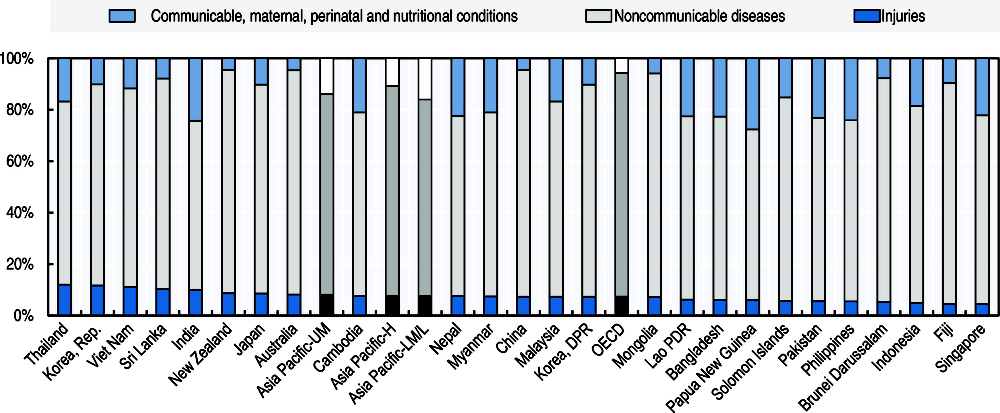
The share of deaths due to non-communicable diseases is increasing in Asia-Pacific. Non-communicable diseases such as cardiovascular diseases and cancers were the most common causes of death, being responsible for over 82% and 78% of all deaths, on average, across high and upper-middle income Asia-Pacific countries (Figure 3.10; see also indicator “Mortality from cardiovascular diseases” and indicator “Mortality from cancer” in Chapter 3). In OECD countries, the average was at 87% and the share was also increasing. But communicable diseases such as respiratory infections, diarrhoeal diseases and tuberculosis, along with maternal and perinatal conditions, also remained major causes of death among lower-middle and low income countries in Asia-Pacific accounting for 16% of all deaths. In WPRO, violence and injuries are the leading cause of death for those aged 5-49, and the first five leading causes of deaths in the 15-29 age group are all violence and injury subtypes (see indicator “Mortality from injuries” in Chapter 3).
Mortality rates are calculated by dividing annual numbers of deaths by mid-year population estimates. Rates have been age-standardised to the World Standard Population to remove variations arising from differences in age structures across countries.
Complete vital registration systems do not exist in many developing countries, and about one-third of countries in the region do not have recent data. Misclassification of causes of death is also an issue. A general assessment of the coverage, completeness and reliability of causes of death data has been published by WHO (Mathers et al., 2005).
The WHO Global Health Estimates (GHE) project draws on a wide range of data sources to quantify global and regional effects of diseases, injuries and risk factors on population health. WHO has also developed life tables for all member states, based on a systematic review of all available evidence on mortality levels and trends. The probability of dying between 15 and 60 years of age (adult mortality rate) derive from these life tables.
All-cause mortality rates for Hong Kong, China and Macau, China are not age-standardised.
Source: WHO Global Health Observatory (GHO) 2018.
Source: WHO Global Burden of Disease, 2018; Department of Health, Hong Kong, China, 2018; Statistics and Census Service, Macau, China, 2017.
Source: WHO Global Burden of Disease, 2018.