Demographic trends
Longer life expectancies (see indicators on life expectancy in Chapter 3) and declining fertility rates mean that older people make up an ever-increasing proportion of the populations of OECD countries.
On average across OECD countries, the share of the population aged over 65 years increased from less than 9% in 1960 to 17% in 2015, and is expected to continue to increase, reaching 28% in 2050 (Figure 11.1, left panel). In more than two-thirds of OECD countries, at least one-quarter of the population will be over 65 years of age by 2050. This proportion is expected to be especially large in Japan, Spain, Portugal, Greece and Korea, where nearly 40% of the population will be aged over 65 years by 2050. Population ageing will also occur rapidly in China, where the share of the population over 65 is expected to nearly triple between 2015 and 2050, to reach a level just below the OECD average. Conversely, Israel, the United States and Mexico will see a more gradual increase in the share of the elderly population due to significant inflows of migrants or higher fertility rates.
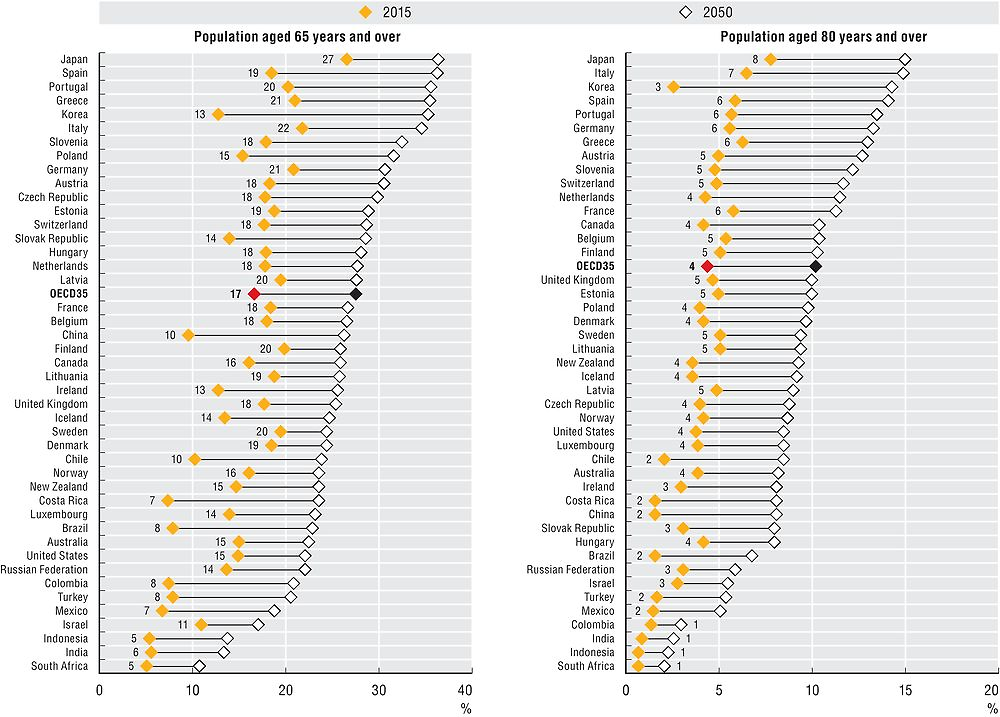
Source: OECD Health Statistics 2017, OECD Historical Population Data and Projections Database, 2017.
The growth in the share of the population aged 80 years and over will be even more dramatic (Figure 11.1, right panel). On average across OECD countries, nearly 5% of the population was 80 years old and over in 2015. By 2050, the percentage will increase to more than 10%. In Italy, Spain, Portugal, and Germany, the proportion of the population aged over 80 is expected to more than double between 2015 and 2050. The rise will be even faster in Korea, where the share of the population aged over 80 years will grow from 3% to 14% over the next four decades.
Population ageing is a phenomenon affecting most countries around the world, but the speed of the process varies (Figure 11.2). The speed of population ageing has been particularly fast in Japan, where the share of the population aged 80 years and over increased from 2% in 1990 to nearly 8% in 2015, and is expected to rise to 15% by 2050. The population in Korea remains relatively young, but is expected to age rapidly in the coming decades, so that by 2050 the share of the population over 80 will be nearly the same as in Japan. The pace of population ageing has been slower in non-OECD countries, although it is expected to accelerate. In large partner countries including Brazil and China, less than 2% of the population was 80 years and over in 2015, though this share is expected to reach close to 7% in Brazil and more than 8% in China by 2050.
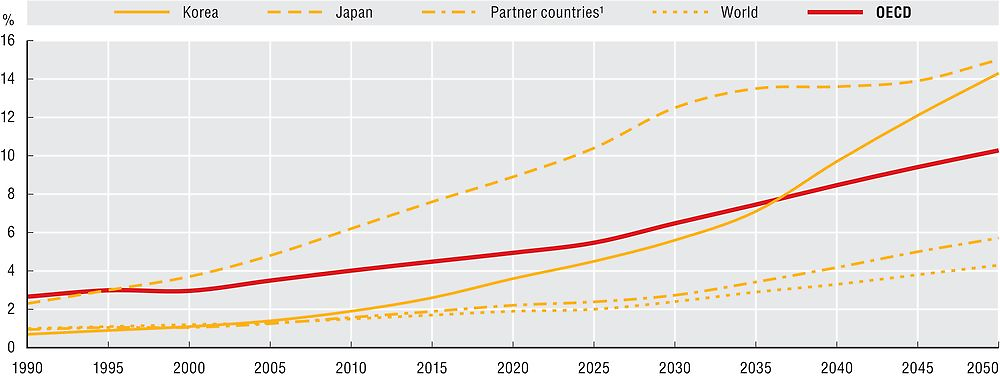
1. Partner countries include Brazil, China, Colombia, Costa Rica, India, Indonesia, Lithuania, the Russian Federation and South Africa.
Source: OECD Historical Population Data and Projections Database, 2017.
Although the pressure that this growing proportion of people aged 65 and 80 over will put on long-term care systems will depend on the health status of people as they reach these ages, population ageing will likely lead to greater demand for elderly care and contribute to increases in health spending. Nevertheless, most studies have found new technologies and rising incomes to be more significant drivers of health spending growth than population ageing (OECD, 2015).
As populations age, the potential supply of labour in the economy is expected to decline. On average across OECD countries, there were slightly more than four people of working age (15-64 years) for every person 65 years and older in 2012. This rate is projected to halve from 4.2 in 2012 to 2.1 on average across OECD countries over the next 40 years (OECD, 2013). Moreover, ageing may lead to shortfalls in certain revenue-raising mechanisms, particularly payroll taxes, making it more difficult for countries to maintain or increase government spending on health.
Data on the population structure have been extracted from the OECD historical population data and projections (1950-2050). The projections are based on the most recent “medium-variant” population projections from the United Nations, World Population Prospects – 2017 Revision.
References
Muir, T. (2017), “Measuring Social Protection for Long-term Care”, OECD Health Working Papers, No. 93, OECD Publishing, Paris, https://doi.org/10.1787/a411500a-en.
OECD (2015), Fiscal Sustainability of Health Systems: Bridging Health and Finance Perspectives, OECD Publishing, Paris, https://doi.org/10.1787/9789264233386-en.
OECD (2013), Pensions at a Glance 2013: OECD and G20 Indicators, OECD Publishing, Paris, https://doi.org/10.1787/pension_glance-2013-en.
United Nations (2017), 2017 Revision of World Population Prospects, United Nations, https://esa.un.org/unpd/wpp/.