Pharmaceutical consumption
In general, pharmaceutical consumption continues to increase, partly driven by a growing need for drugs to treat ageing-related and chronic diseases, and by changes in clinical practice. This section examines consumption of four categories of pharmaceuticals: antihypertensive, cholesterol-lowering, antidiabetic and antidepressant drugs.
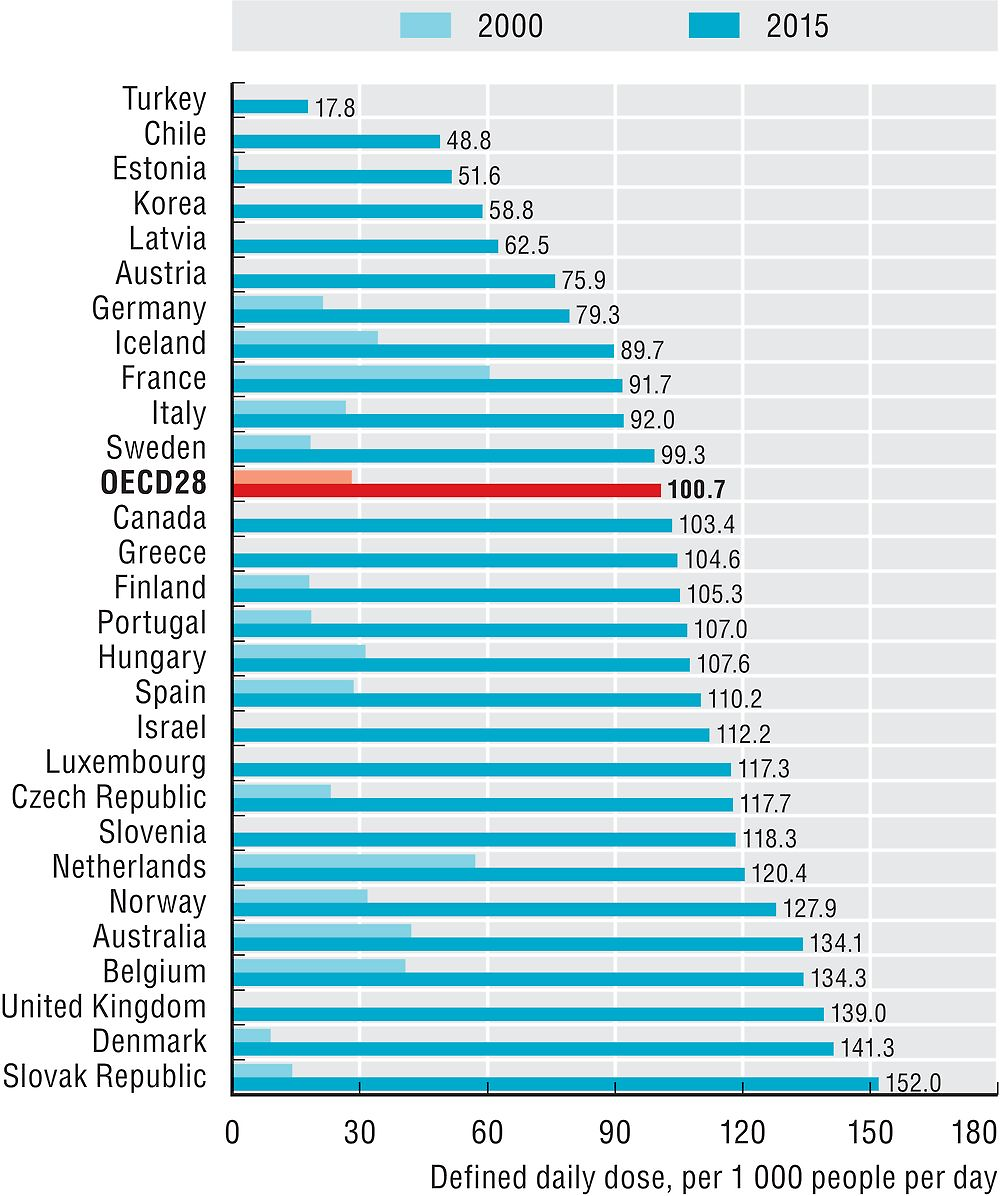
Consumption of antihypertensive drugs has nearly doubled in OECD countries between 2000 and 2015. It has nearly quadrupled in Luxembourg and Estonia (Figure 10.6). It is highest in Germany and Hungary, which report almost five times the consumption levels in Korea and Turkey. These variations reflect both differences in the prevalence of high blood pressure and in clinical practice.

Source: OECD Health Statistics 2017.
The use of cholesterol-lowering drugs has nearly quadrupled in OECD countries between 2000 and 2015 (Figure 10.7). The Slovak Republic, Denmark and the United Kingdom report the highest consumption per capita in 2015. Across OECD countries, there is an eight fold variation in consumption levels of cholesterol-lowering drugs.
Source: OECD Health Statistics 2017.
The use of antidiabetic drugs has almost doubled in OECD countries between 2000 and 2015 (Figure 10.8). This growth can be explained by the rising prevalence of diabetes, largely linked to increases in the prevalence of obesity (see indicators on overweight and obesity in Chapter 4), a major risk factor for the development of type 2 diabetes. In 2015, the consumption of antidiabetic drugs was highest in Finland, the Czech Republic and Greece.

Source: OECD Health Statistics 2017.
Consumption of antidepressant drugs has doubled in OECD countries between 2000 and 2015 (Figure 10.9). This might reflect improved recognition of depression, availability of therapies, guidelines and changes in patient and provider attitudes (Mars et al., 2017). However, there is significant variation in consumption of antidepressants between countries. Iceland reports the highest level of consumption of antidepressants in 2015, twice the OECD average, followed by Australia, Portugal and the United Kingdom. Latvia, Korea and Estonia report the lowest consumption levels of antidepressants.

Source: OECD Health Statistics 2017.
Defined daily dose (DDD) is the assumed average maintenance dose per day for a drug used for its main indication in adults. DDDs are assigned to each active ingredient(s) in a given therapeutic class by international expert consensus. For instance, the DDD for oral aspirin equals 3 grams, which is the assumed maintenance daily dose to treat pain in adults. DDDs do not necessarily reflect the average daily dose actually used in a given country. DDDs can be aggregated within and across therapeutic classes of the Anatomic-Therapeutic Classification (ATC). For more detail, see www.whocc.no/atcddd.
The volume of antihypertensive drugs consumption presented in Figure 10.6 refers to the sum of five ATC2 categories, which can all be prescribed for hypertension (Antihypertensives, Diuretics, Beta-blocking agents, Calcium channel blockers and Agents acting on the Renin-Angiotensin system).
Data generally refer to outpatient consumption only, except for Chile, the Czech Republic, Estonia, Finland, France, Iceland, Italy, Korea, Norway, the Slovak Republic and Sweden, where data also include hospital consumption. The data for Canada relate to three provinces only (British Columbia, Manitoba and Saskatchewan). The data for Luxembourg and Spain refer to outpatient consumption for prescribed drugs covered by the National Health System (public insurance). Data for Luxembourg are underestimated due to incomplete consideration of products with multiple active ingredients.
References
Belloni, A., D. Morgan and V. Paris (2016), “Pharmaceutical Expenditure and Policies: Past Trends and Future Challenges”, OECD Health Working Papers, No. 87, OECD Publishing, Paris, https://doi.org/10.1787/5jm0q1f4cdq7-en.
Grandfils, N. and C. Sermet (2009), “Evolution 1998-2002 of the Antidepressant Consumption in France, Germany and the United Kingdom”, Document de travail IRDES, No. 21, Paris.
Mars, B. et al. (2017), “Influences on Antidepressant Prescribing Trends in the UK: 1995–2011”, Social Psychiatry and Psychiatric Epidemiology, Vol. 52, No. 2, pp. 193-200
OECD (2014), Making Mental Health Count: The Social and Economic Costs of Neglecting Mental Health Care, OECD Publishing, Paris, https://doi.org/10.1787/9789264208445-en.