Life expectancy by sex and education level
There remain large gaps in life expectancy between women and men in all OECD countries. On average across OECD countries, life expectancy at birth for women was 83.1 years in 2015, compared with 77.9 years for men, a gap of 5.2 years (Figure 3.4). The gender gap in life expectancy increased substantially in many OECD countries during the 1970s and early 1980s to reach a peak of almost seven years in the mid-1980s, but it has narrowed since, reflecting higher gains in life expectancy among men than women. This can be attributed at least partly to narrowing of differences in risk-increasing behaviours such as smoking, accompanied by sharp reductions in mortality rates from circulatory diseases among men.
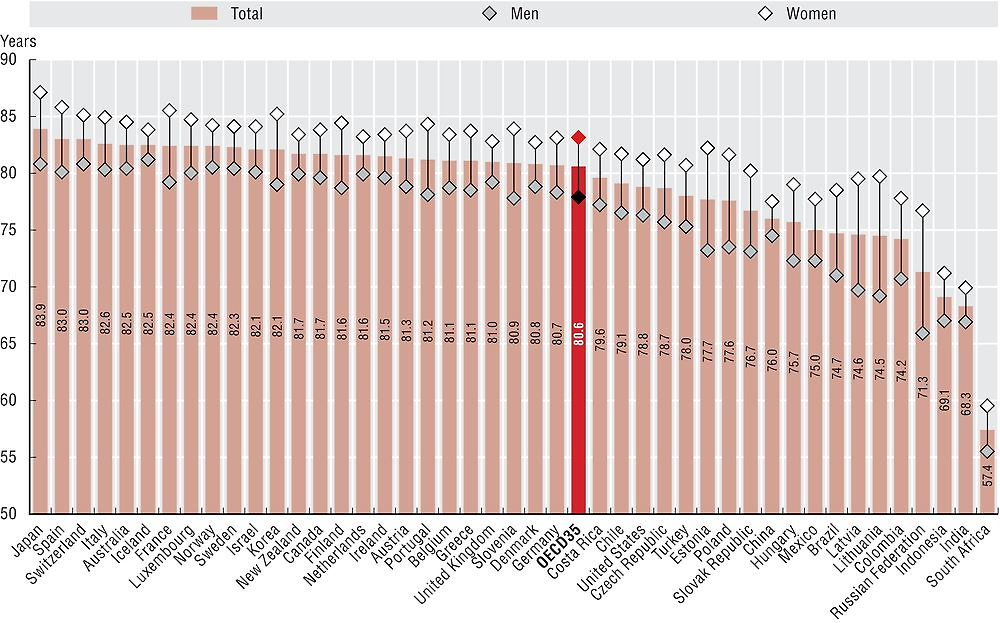
Note: Countries are ranked in descending order of life expectancy for the whole population.
Source: OECD Health Statistics 2017.
In 2015, life expectancy for women in OECD countries ranged from less than 80 years in Hungary, Latvia and Mexico to more than 85 years in Japan, Spain, France, Korea and Switzerland. Life expectancy for men ranged from less than 75 years in Latvia, Mexico, Hungary, the Slovak Republic, Estonia and Poland to over 80 years in Iceland, Japan, Switzerland, Norway, Australia, Sweden, Italy, Israel and Spain.
Among OECD countries, the gender gap in life expectancy is relatively narrow in Iceland, the Netherlands, New Zealand, the United Kingdom, Norway, Sweden, Ireland and Denmark (a gap of less than four years), but much larger in Latvia (around ten years) Estonia (around nine years), Poland (around eight years), the Slovak Republic and Hungary (around seven years). In this latter group of countries, gains in life expectancy of men over the past few decades have been much more modest than in other countries. For partner countries, the gender gap is also large in the Russian Federation, Lithuania and Colombia (seven years or more), and small in China (around three years).
Life expectancy in OECD countries varies by socio-economic status as measured, for instance, by education level (Figure 3.5). A higher education level not only provides the means to improve the socio-economic conditions in which people live and work, but may also promote the adoption of healthier lifestyles and facilitate access to appropriate health care.
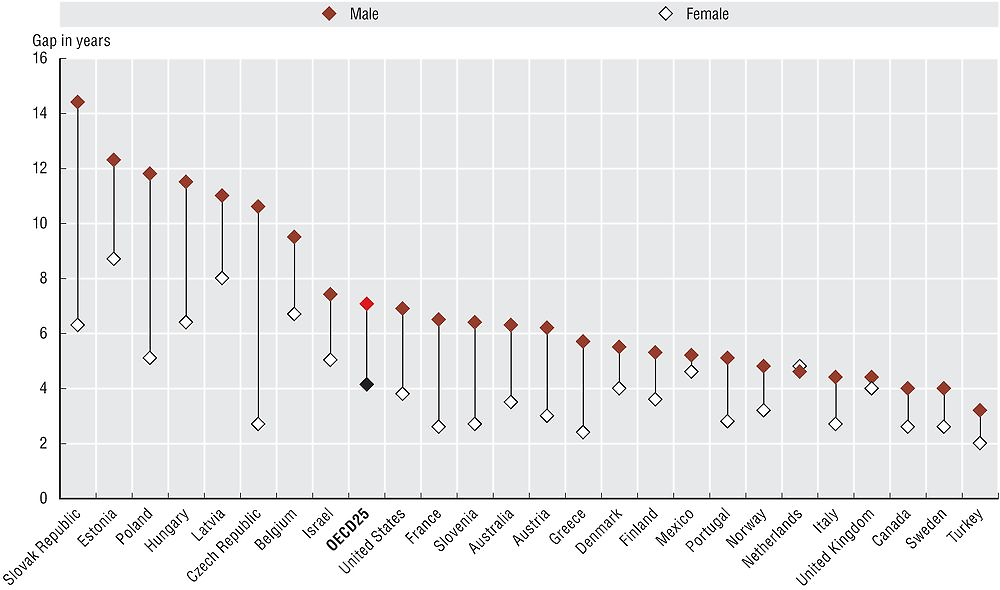
Note: The figures show the gap in the expected years of life remaining at age 30 between adults with the highest level (“tertiary education”) and the lowest level (“below upper secondary education”) of education.
Source: Eurostat database complemented with OECD Statistics Directorate data and national data for Israel, Mexico and the Netherlands.
On average among 25 OECD countries for which recent data are available, people with the highest level of education can expect to live around six years longer than people with the lowest level of education at age 30 (53.4 versus 47.8 years). These differences in life expectancy by education level are particularly pronounced for men, with an average gap of seven years. Differences are especially pronounced in central and eastern European countries (Slovak Republic, Estonia, Poland, Hungary, Latvia and the Czech Republic), where the life expectancy gap between higher and lower educated men is more than ten years. This is largely explained by older people in these countries having lower levels of education, and the greater prevalence of risk factors among men, such as tobacco and alcohol use. In other countries such as Turkey, Sweden and Canada, inequalities are less pronounced. Differences in lifespan between people with low and high education have been estimated to account for about 10% of overall inequalities in ages at death (Murtin et al., 2017).
Life expectancy at birth measures how long, on average, people would live based on a given set of age-specific death rates. However, the actual age-specific death rates of any particular birth cohort cannot be known in advance. If age-specific death rates are falling (as has been the case over the past decades), actual life spans will be higher than life expectancy calculated with current death rates. Data for life expectancy at birth comes from Eurostat for EU countries, and from national sources elsewhere. The methodology used to calculate life expectancy can vary slightly between countries. This can change a country’s estimates by a fraction of a year.
Data for life expectancy by education level come from national suveys provided for the OECD Health Data questionnaire for Israel, Mexico and the Netherlands; from the OECD Statistics Directorate project (see Murtin et al. below) for Australia, Austria, Belgium, Canada, France, Latvia, the United Kingdom and the United States; and from Eurostat for the remaining 14 European countries shown in Chart 3.5.
To calculate life expectancies by education level, detailed data on deaths by sex, age and education level are needed. However, not all countries have information on education as part of their deaths data. In such cases, data linkage to another source (e.g. a census) which does have information on education may be required (Corsini, 2010). Note further that data disaggregated by education are only available for a subset of the population for Belgium, the Czech Republic and Norway, and that there are more missing data on education among the deceased than the population at large. In these three countries, the large share of the deceased population with missing education (above 40%) could affect the accuracy of results.
References
Corsini, V. (2010), “Highly Educated Men and Women Likely to Live Longer: Life Expectancy by Educational Attainment”, Eurostat Statistics in Focus 24/2010, European Commission, Luxembourg.
Murtin, F. et al. (2017), “Inequalities in Longevity by Education in OECD Countries: Insights from New OECD Estimates”, OECD Statistics Working Papers, No. 2017/02, OECD Publishing, Paris, https://doi.org/10.1787/6b64d9cf-en.