Capital expenditure in the health sector
Although health systems remain a highly labour-intensive sector, capital has been an increasingly important factor of production of health services over recent decades, as reflected for example by the growing importance of diagnostic and therapeutic equipment or the expansion of information and communications technology (ICT) in health care (see previous indicator on eHealth adoption in general practice and hospital). However, the level of resources invested in infrastructure, equipment and ICT tends to fluctuate more with economic cycles than current spending on health services, as investment decisions are often more discrete and can more easily be postponed or brought forward depending on economic circumstances. In making capital investment decisions, policy-makers need to carefully assess not only the short-term costs, but also the potential benefits in the short, medium and longer-term. Slowing down investment in health infrastructure and equipment may also reduce the capacity to treat patients and contribute to increases in waiting times for different types of services.
In 2016, OECD countries allocated, on average, around 0.5% of their GDP for capital expenditure in the health sector (Figure 7.16). This compares with the 9% of GDP going on current spending, that is on medical care, pharmaceuticals, etc. (see indicator “Health spending as a share of GDP”). As is the case with current spending, there are significant differences in the current levels of investment expenditure between countries and in the recent trends observed following the economic crisis.
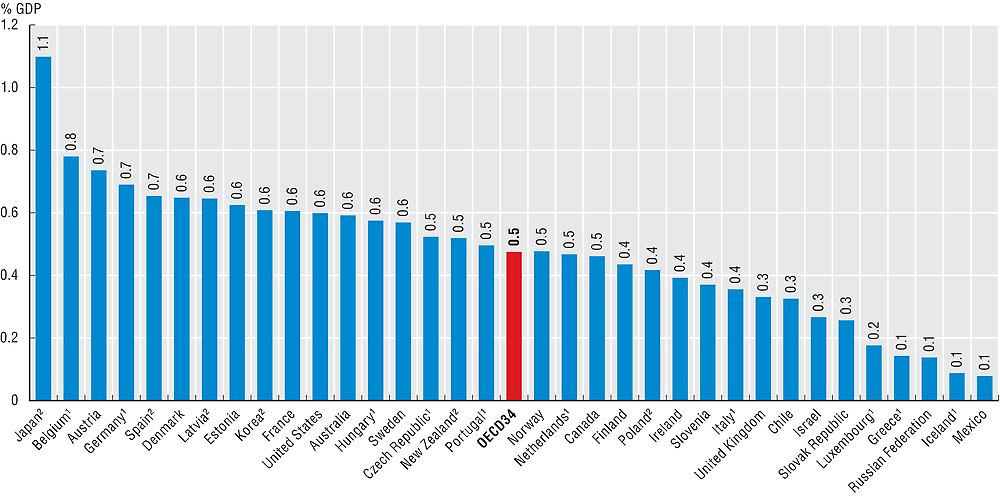
1. Refers to gross fixed capital formation in ISIC 86: Human health activities (ISIC Rev. 4).
2. Refers to gross fixed capital formation in ISIC Q: Human health and social work activities (ISIC Rev. 4).
Source: OECD Health Statistics 2017, OECD National Accounts.
As a proportion of GDP, Japan was the highest spender on capital investment in 2015 with more than 1% of its GDP going on construction, equipment and technology in the health and social sector. A number of European countries – Belgium, Austria and Germany – were also relatively high capital spenders in 2015, with between 0.7-0.8% of GDP invested. For the most part, OECD countries find themselves within a relatively narrow band of between 0.4-0.6% of GDP each year. However, either due to the economic conditions or the peculiarities of a small economy (Luxembourg and Iceland) capital spending can be significantly lower. Greece, for example, spent just under 0.15% of its GDP on capital investment in the health sector in 2015.
By its very nature, capital spending fluctuates from year to year more than current spending as capital projects on construction (i.e. building of hospitals and other health care facilities) and investment programmes on new equipment (e.g., medical and ICT equipment) are implemented. Decisions on capital spending also tend to be more affected by economic cycles, with spending on health system infrastructure and equipment often a prime target for reduction or postponement in economic downturns. Figure 7.17 shows that a number of hard-hit European countries have seen annual investment in the health sector fall in real terms post-crisis. Greece, in particular, reported capital spending in the health sector at around a third of the level reported ten years before. Portugal and Italy have both seen investment drop by 30% or more from the peaks in 2010. The United Kingdom is also notable in seeing a significant reduction in investment: up to 2009, capital spending was increasing rapidly year-on-year whereas between 2011 and 2014 it was back to 2003 levels.
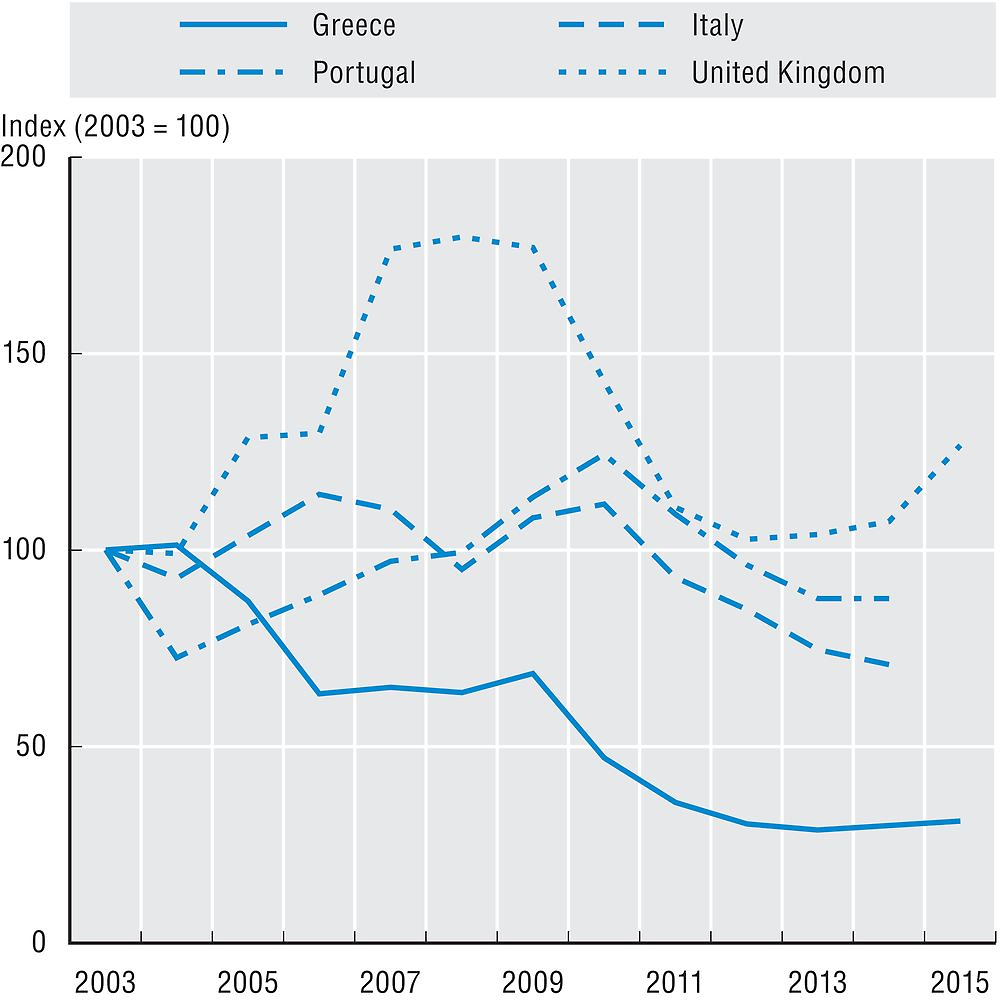
Source: OECD Health Statistics 2017, OECD National Accounts.
Outside of Europe a number of countries reported a continual increase in capital expenditure. Korea and Japan have seen recent investment in the health care sector around 50% higher, in real terms, than the levels of ten years earlier (Figure 7.18).
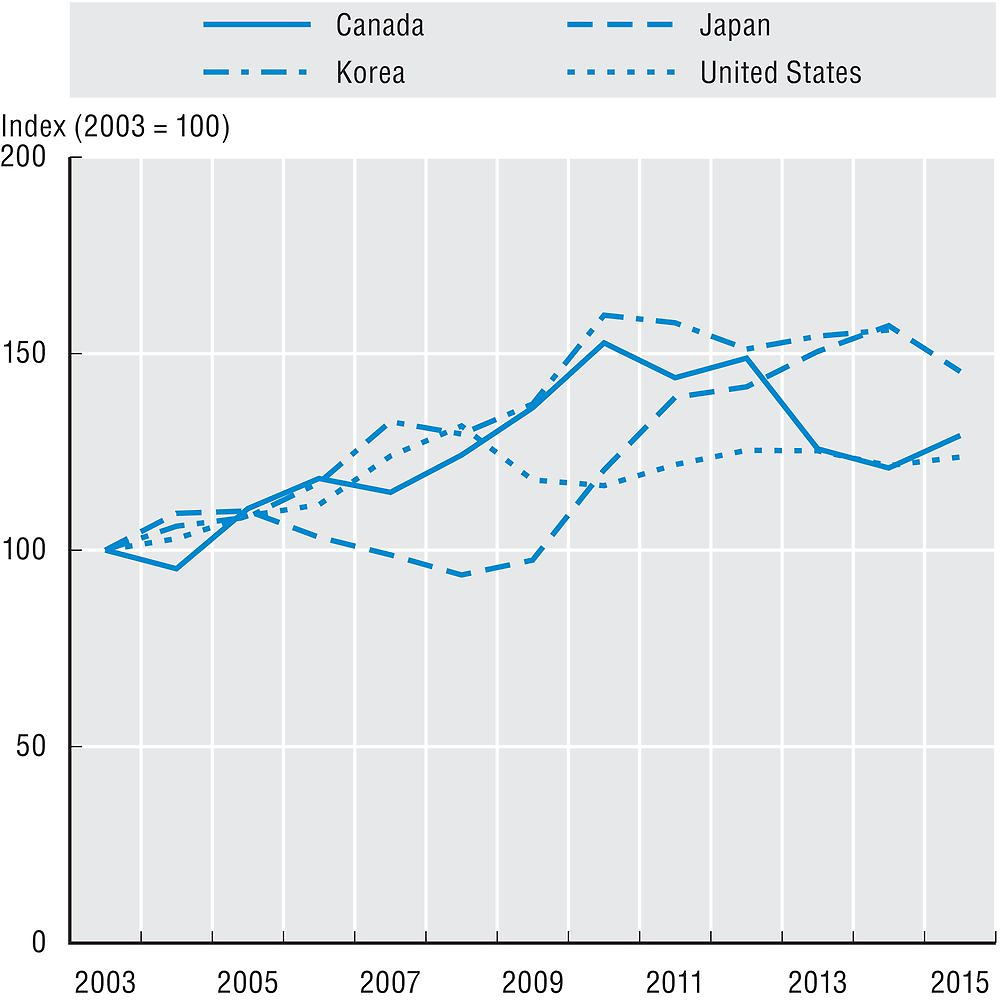
Source: OECD Health Statistics 2017, OECD National Accounts.
Gross fixed capital formation in the health sector is measured by the total value of the fixed assets that health providers have acquired during the accounting period (less the value of the disposals of assets) and that are used repeatedly or continuously for more than one year in the production of health services. The breakdown by assets includes infrastructure (e.g. hospitals, clinics, etc.), machinery and equipment (including diagnostic and surgical machinery, ambulances, and ICT equipment), as well as software and databases.
Gross fixed capital formation is reported by many countries under the System of Health Accounts. It is also reported under the National Accounts broken down by industrial sector according to the International Standard Industrial Classification (ISIC) Rev. 4 using Section Q: Human health and social work activities or Division 86: Human health activities. The former is normally broader than the SHA boundary while the latter is narrower.