Health expenditure per capita
The financial resources that a country devotes to health care, both for individuals and for the population as a whole, and how this changes over time is the result of a wide array of social and economic factors, as well as the financing and organisational structures of a country’s health system.
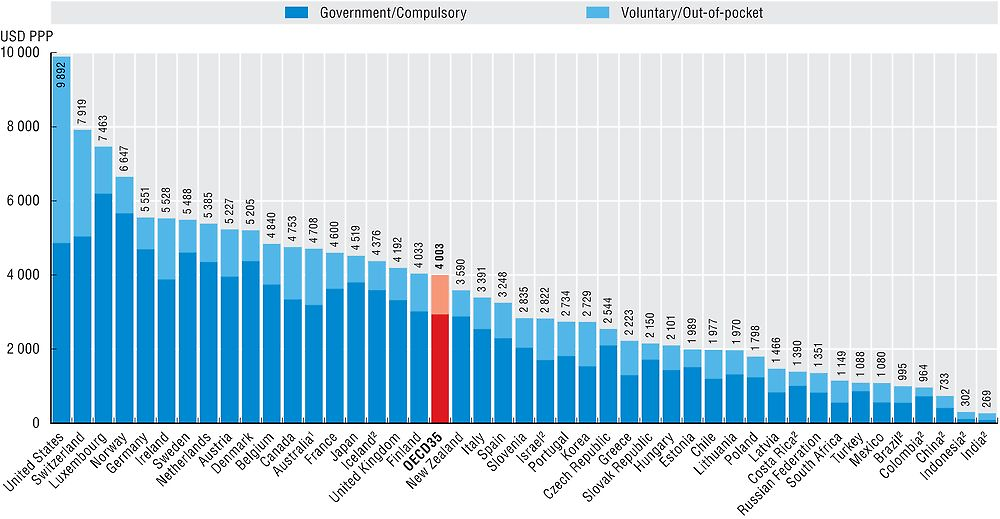
In 2016, the United States is estimated to have outspent all other OECD countries by a wide margin, spending the equivalent of USD 9 892 for each resident (Figure 7.1). This level of health spending is almost two-and-a-half times the average of the 35 OECD countries (USD 4 003) and 25% above Switzerland, the next highest spender (adjusted for the different purchasing powers – see box “Definition and comparability”). Compared with the other G7 countries, the United States spends almost 80% more than Germany and more than twice as much on health care per person as Canada, France and Japan. OECD countries spending half or less of the OECD average include many of the Central and Eastern European members of the OECD, such as Estonia and Poland, together with Chile. Lowest per capita spenders on health in the OECD were Mexico and Turkey with levels around a quarter of the OECD average, and similar to spending in key emerging economies such as the Russian Federation, South Africa and Brazil. China spent around 20% of the OECD per capita spending level, while both India and Indonesia spent less than 10% of the OECD average based on latest available figures.
Note: Expenditure excludes investments, unless otherwise stated.
1. Australian expenditure estimates exclude all expenditure for residential aged care facilities in welfare (social) services.
2. Includes investments.
Source: OECD Health Statistics 2017, WHO Global Health Expenditure Database.
Figure 7.1 also shows the split of health spending based on whether it is paid from government sources or some kind of compulsory insurance, or through voluntary means such as voluntary health insurance or direct payments (see indicator on “Financing of health care”). In general, the ranking of per capita expenditure of government and compulsory schemes is comparable to that of total spending. Even if voluntary insurance in the United States continues to play a significant role in financing health care, the level of spending from federal and state programmes (such as Medicaid) and Medicare is still greater on a per capita basis in the United States than in most other OECD countries, with the exceptions being Luxembourg, Norway and Switzerland.
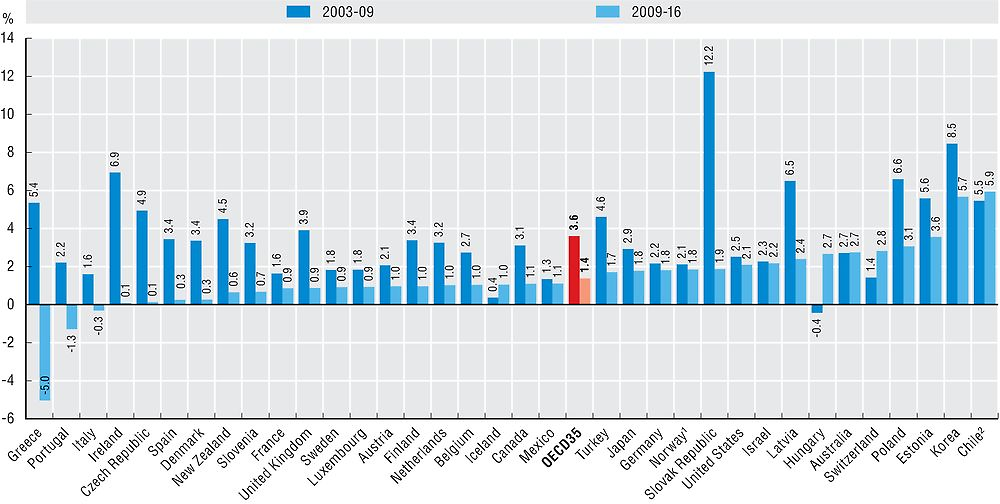
Per capita spending on health across the OECD continued to grow in 2016 following the trend of recent years. This comes after the abrupt slowdown in health spending growth between 2009 and 2011 in the wake of the global financial and economic crisis. On average, annual health spending growth across the OECD since 2009 has been 1.4% compared with 3.6% in the six years up to 2009 (Figure 7.2).
1. Mainland Norway GDP price index used as deflator.
2. CPI used as deflator.
Source: OECD Health Statistics 2017.
In a number of countries there have been significant turnarounds in annual growth rates in health spending in the years before, compared with after the financial crisis. In Greece, strong annual growth increases were reversed after 2009 (5.4% vs. -5.0%). A similar if less dramatic picture is also observed in Portugal (2.2% vs. -1.3%). In general, health spending growth slowed down in the vast majority of OECD countries and preliminary figures or estimations for 2016 still point to negative or near-zero growth in a few. Only four countries – Iceland, Hungary, Switzerland and Chile – have recorded higher average growth in the period since 2009 compared to the period before. Indeed, health spending in Hungary together with Poland and Estonia has remained relatively resilient since 2009 with annual growth of between 2.7-3.6%
Away from Europe, Korea and Chile have continued to report annual health spending increases above 5% in real terms since 2009. Preliminary country estimates for 2016 suggest further strong spending growth of 6.3% in Korea and 4.5% in Chile. In the United States, health spending grew by 4.1% in real terms in 2015, the fastest rate for more than ten years, with a preliminary estimate by the OECD suggesting a further increase of 2.7% in 2016. In the medium-term, the US Centers for Medicare & Medicaid Services (CMS) expect health spending growth above that of GDP in the United States, driven on by faster growing medical prices.
Expenditure on health measures the final consumption of health goods and services (i.e. current health expenditure). This includes spending by both public and private sources on medical services and goods, public health and prevention programmes and administration.
To compare spending levels between countries, per capita health expenditures are converted to a common currency (US dollar) and adjusted to take account of the different purchasing power of the national currencies, in order to compare spending levels. Economy-wide (GDP) PPPs are used as the most available and reliable conversion rates. For the calculation of growth rates in real terms, economy-wide GDP deflators are used for all countries. In some countries (e.g. France and Norway), health specific deflators exist, based on national methodologies, but these are not used in this publication due to limited comparability.
Note that data for 2016 are based on preliminary figures either provided by the country or estimates made by OECD Secretariat.
References
Morgan, D., M. Gmeinder and J. Wilkens (2017), “An OECD analysis of health spending in Norway”, OECD Health Working Papers, No. 91, OECD Publishing, Paris, https://doi.org/10.1787/63302bbf-en.
OECD/Eurostat/WHO (2017), A System of Health Accounts 2011: Revised edition, OECD Publishing, Paris, https://doi.org/10.1787/9789264270985-en.