Prescribing in primary care
Prescribing can be used as an indicator of health care quality supplementing consumption and expenditure information (see Chapter 10). Antibiotics, for example, should be prescribed only where there is an evidence based need to reduce the risk of resistant strains. Likewise, quinolones and cephalosporins are considered second-line antibiotics in most prescribing guidelines. They should generally be used only when first line antibiotics are ineffective. Total volume of antibiotics prescribed, and second-line antibiotics as a proportion of total volume have been validated as markers of quality in the primary care setting.
Figure 6.4 shows volume of all antibiotics prescribed in primary care in 2015, with volumes of second-line antibiotics embedded within the total amount. Total volumes vary more than three-fold across countries, with the Netherlands, Estonia and Sweden reporting the lowest volumes, and Greece and France reporting volumes much higher than the OECD average. Volumes of second-line antibiotics vary almost 16-fold across countries. The Scandinavian countries and the Netherlands report the lowest volumes of second line antibiotics, whereas Korea, Italy and Turkey reported the highest. Variation is likely to be explained, on the supply side, by differences in the regulation, guidelines and incentives that govern primary care prescribers and, on the demand side, by cultural differences in attitudes and expectations regarding the natural history and optimal treatment of infective illness. There has been some growth in the overall volume of antibiotics between 2010 and 2015. The highest growth was seen in Ireland and Poland and the largest decline in Sweden and Iceland.
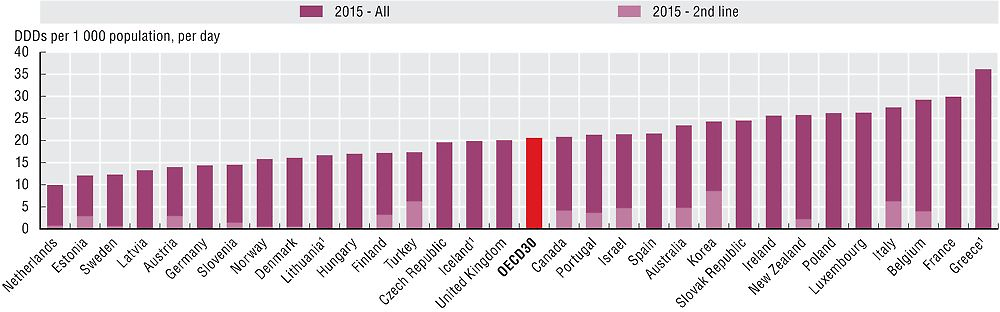
1. Data refer to all sectors (not only primary care).
Source: European Centre for Disease Prevention and Control and OECD Health Statistics 2017.
Antibiotic consumption is consistently higher among children and young adults and older adults. Volumes of antibiotics dispensed to children aged 0-9 years varies by 15-fold across countries but only 5-fold across young adults aged 10-19 years of age (Figure 6.5). Consumption data subdivided by age groups can allow identification of specific age groups that are prescribed high proportion of certain antibiotics and provide detailed information for campaigns or interventions aimed at more prudent use of antibiotics in these sub-groups of population.
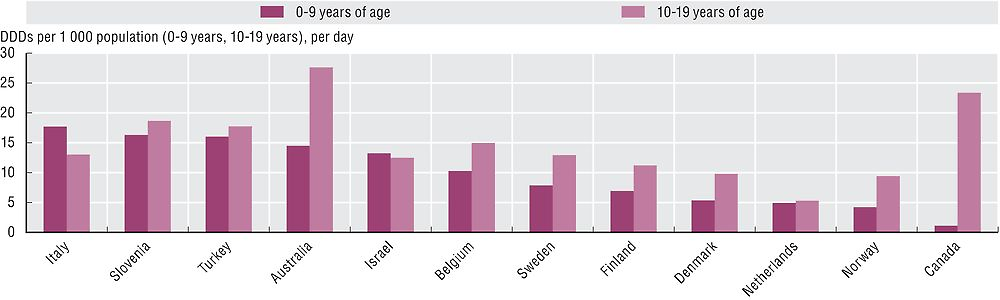
Source: European Centre for Disease Prevention and Control and OECD Health Statistics 2017.
Benzodiazepines are often prescribed for older adults for anxiety and sleep disorders, despite the risk of adverse side effects such as fatigue, dizziness and confusion. Long-term use of benzodiazepines can lead to adverse events (falls, road accidents and overdose), tolerance, dependence and dose escalation. Beside the period of use, there is concern about the type of benzodiazepine prescribed, with long-acting types not recommended for older adults because they take longer for the body to eliminate. Figures 6.6 and 6.7 indicate that, across the OECD, on average around 25 per 1 000 older adults are chronic benzodiazepine users (>365 defined daily doses in one year), and 64 per 1 000 older adults have received at least one prescription for a long-acting benzodiazepine or related drugs within the year. The large variation can be explained by different reimbursement and prescribing policies for benzodiazepines as well as differences in disease prevalence and treatment guidelines.
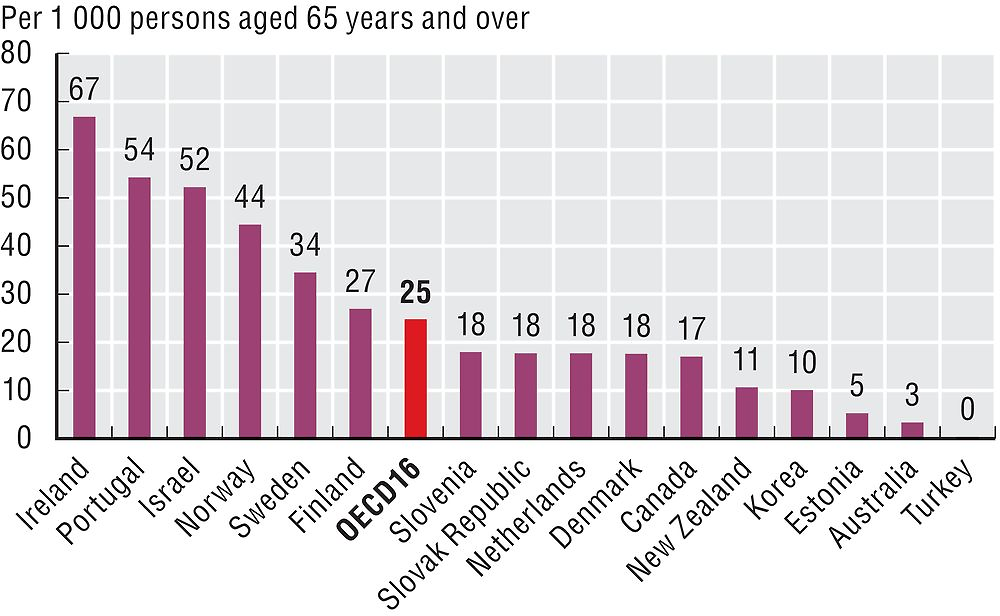
Source: OECD Health Statistics 2017.
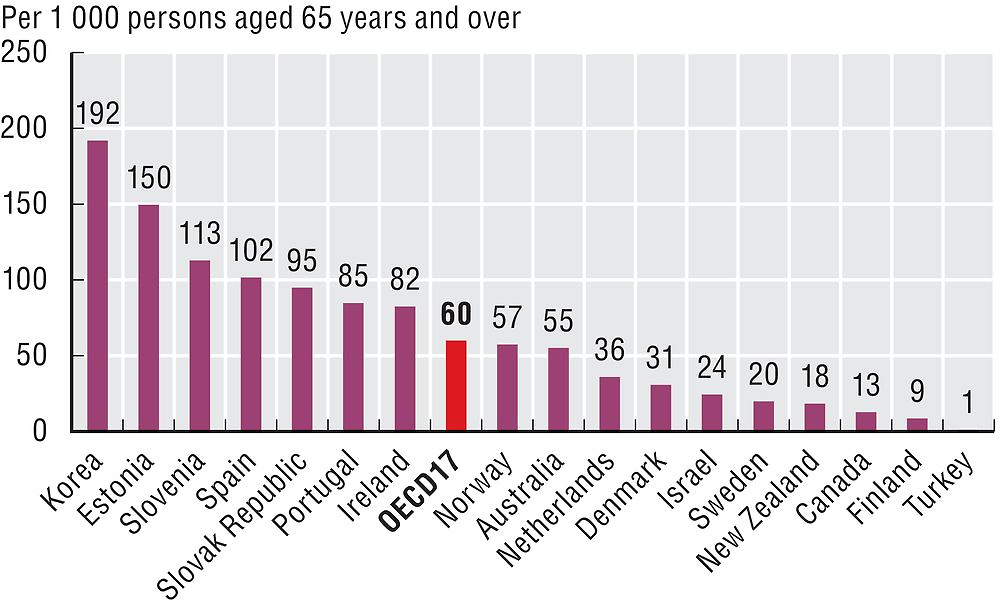
Source: OECD Health Statistics 2017.
Defined daily dose (DDD) is the assumed average maintenance dose per day for a drug used for its main indication in adults. DDDs are assigned to each active ingredient(s) in a given therapeutic class by international expert consensus. For instance, the DDD for oral aspirin equals 3 grams, which is the assumed maintenance daily dose to treat pain in adults. DDDs do not necessarily reflect the average daily dose actually used in a given country. For more detail, see http://www.whocc.no/atcddd.
Data for Spain, Estonia, United Kingdom, Portugal and Sweden include data for primary care physicians only. Data for Canada, Ireland, Slovenia and New Zealand include only those dispensed by community pharmacies. Data for Finland, Italy, and Korea include outpatients only. Data for Belgium, Denmark and the Netherlands include outpatients and nursing homes. Data for Turkey include primary care, nursing and residential facilities. Data for Australia include prescriptions dispensed at community pharmacies, private hospital pharmacies and public hospital outpatients and admitted day patients. Results for Canada only include data from the provinces of British Columbia, Manitoba and Saskatchewan.
Denominators comprise the population held in the national prescribing database, rather than the general population.
References
Cecchini, M. (2016), “Tackling Antimicrobial Resistance”, on OECD Insights blog, June, see http://oe.cd/1JI.
OECD (2017), Tackling Wasteful Spending on Health, OECD Publishing, Paris, https://doi.org/10.1787/9789264266414-en.
OECD (2015), “Antimicrobial Resistance in G7 Countries”, OECD Policy Brief, October, see www.oecd.org/els/health-systems/Antimicrobial-Resistance-in-G7-Countries-and-Beyond-Policy-Brief.pdf.