Air pollution
Air pollution is a major environment-related health threat, especially to children and the elderly, as it can cause respiratory diseases, lung cancer, and cardiovascular diseases. It has also been linked to low birth-weight, dementia, and damage to DNA and the immune system (WHO, 2017). Outdoor air pollution in both cities and rural areas was estimated to cause 3 million premature deaths worldwide in 2012 (WHO, 2016), and can also have substantial economic and social consequences, from health costs to building restoration needs and agricultural output (OECD, 2015). Of particular concern for outdoor air pollution are carbon monoxide, nitrogen oxide and ozone, but also fine particulates, or PM2.5, whose diameter is 2.5 μm or smaller. These are potentially more dangerous than the larger particulates (PM10), as they can penetrate deeper into the respiratory tract, and cause severe health effects. In 2015, particulate matter pollution was the cause of over 4.2 million deaths worldwide (Forouzanfar et al., 2016). The WHO has claimed that air pollution is one of the most pernicious threats facing global public health today and on a bigger scale than HIV or Ebola (WHO, 2017).
In 2015, exposure levels to PM2.5 exceeding the WHO guidelines were higher than 90% in 21 OECD countries (Figure 4.20). In 19 of those countries, 100% of the population was exposed. Australia, Canada, Finland, Iceland, New Zealand and Sweden display rates of nearly 0%, followed by the United States and Norway with rates below 10%. The OECD average is 68%.
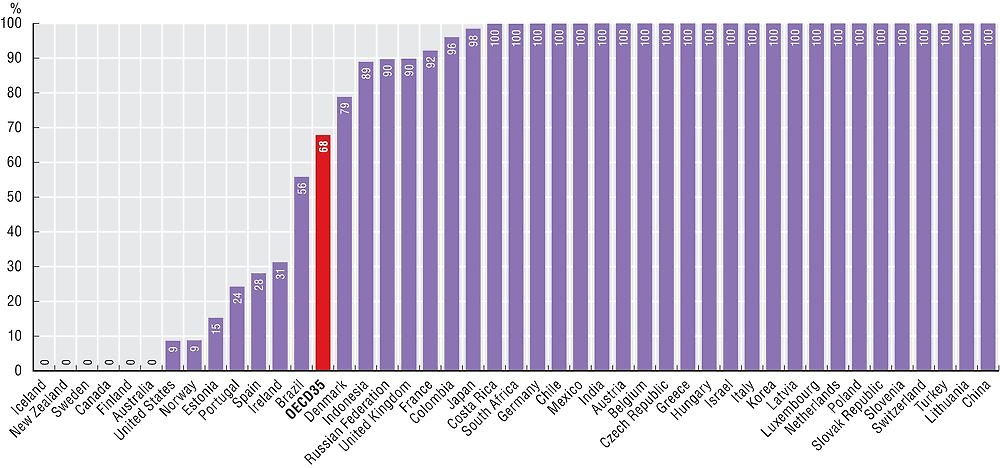
Source: World Bank (2017), World Development Indicators (database).
The mean annual population exposure to PM2.5 has decreased in the OECD, on average, from 18.2 microgrammes/m3 in 1990 to 15.1 microgrammes/m3 in 2015 (Figure 4.21). While the overall trend since 1990 has been downward, there have been some increases in population exposure in more recent years. This is largely due to the concentration of pollution sources in urban areas and to increasing use of private vehicles for urban trips (OECD, 2015).
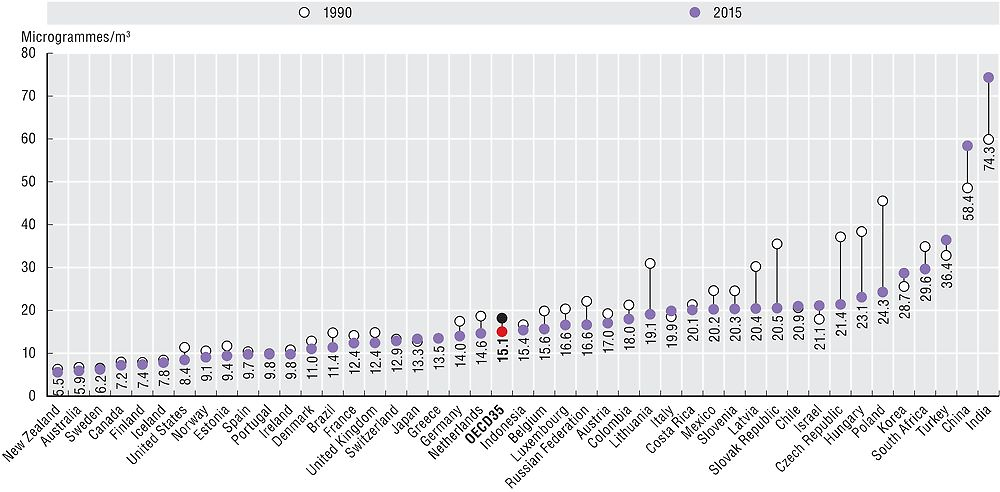
Source: World Bank (2017), World Development Indicators (database).
In 2015, population exposure was lowest in Australia, Canada, Finland, Iceland, New Zealand and Sweden, and highest in Korea and Turkey, as well as China, India and South Africa. Population exposure has decreased in most countries since 1990, except in Israel, Italy, Japan, Korea, Turkey, China and India where increases range from 5% in Japan to 24% in India. In countries where exposure has dropped, the decreases range from 3-8% in Finland, Iceland, Spain, Sweden, Switzerland as well as Costa Rica and Indonesia, to 30-40% in the Czech Republic, Hungary, Latvia, Poland, the Slovak Republic as well as Lithuania.
The WHO estimates that overall, 92% of the world’s population is breathing air above the PM2.5 guidelines (WHO, 2017), and indoor and outdoor air pollution cause approximately 7 million premature deaths per year (WHO, 2014). OECD projections estimate that outdoor air pollution will cause 6 to 9 million premature deaths by 2060, and cost 1% of global GDP (OECD, 2016). Policies to limit air pollution consist of regulatory approaches, such as air quality standards, fuel quality standards or emission ceilings, as well as economic instruments, which include fuel taxes, road pricing or taxes on emissions.
The WHO has established guidelines for air pollution, expressed as the average level of exposure of a nation’s population (urban and rural) to concentrations of suspended particles which must not be exceeded. The indicators presented here reflect the estimated average level of exposure to concentrations of fine particulates, which measure less than 2.5 microns in diameter. The WHO guidelines for PM2.5 are an annual mean of 10 microgrammes/m3, which is the lower range over which adverse health effects have been observed.
Data for PM2.5 are made available by the World Bank, through the Global Burden of Disease Study. They are generated by combining data from different sources, including satellite observations of aerosols in the atmosphere and round-level monitoring of particulates. However, pollutant concentrations are sensitive to local conditions, and measurement protocols may differ across countries. The data must therefore serve as a general indicator of air quality, mostly allowing for cross-country comparison.
References
Forouzanfar, M.H. et al. (2016), “Global, Regional, and National Comparative Risk Assessment of 79 Behavioural, Environmental and Occupational, and Metabolic Risks or Clusters of Risks, 1990–2015: A Systematic Analysis for the Global Burden of Disease Study 2015”, The Lancet, Vol. 388, pp. 1659-1724.
OECD (2015), Environment at a Glance 2015: OECD Indicators, OECD Publishing, Paris, https://doi.org/10.1787/9789264235199-en
OECD (2016), The Economic Consequences of Outdoor Air Pollution, OECD Publishing, Paris, https://doi.org/10.1787/9789264257474-en.
WHO (2017), “Healthier, Fairer, Safer: The Global Health Journey”, WHO, Geneva.
WHO (2016), “Ambient (Outdoor) Air Quality and Health Fact Sheet”, WHO, Geneva.
WHO (2014), “7 Million Premature Deaths Annually Linked to Air Pollution”, press release, WHO, Geneva.