Diabetes prevalence
Diabetes is a chronic disease, characterised by high levels of glucose in the blood. It occurs either because the pancreas stops producing the hormone insulin (Type 1 diabetes), or because the cells of the body do not respond properly to the insulin produced (Type 2 diabetes). People with diabetes are more likely to suffer from cardiovascular diseases such as heart attack and stroke, sight loss, foot and leg amputation and renal failure.
Across the OECD, over 93 million adults – or 7% of all adults – were diabetics in 2015 (Figure 3.23). The International Diabetes Federation estimates that a further 33 million adults have undiagnosed diabetes in OECD countries. Diabetes prevalence is highest in Mexico, where more than 15% of adults have diabetes. Diabetes prevalence is also high in Turkey, the United States and Chile, where 10% or more of adults were diabetics. In contrast, less than 5% of adults suffered from diabetes in Estonia, Ireland, Luxembourg, Sweden and the United Kingdom. Among partner countries, diabetes prevalence is relatively high in Brazil and Colombia, at about 10% of the adult population, and low in Lithuania.
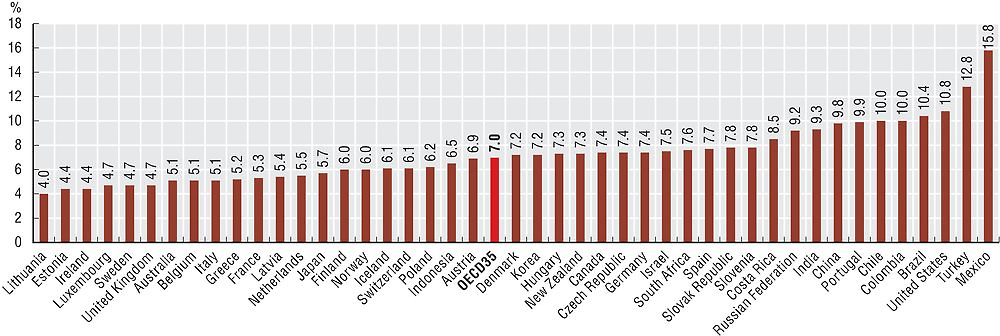
Note: Data cover those aged between 20 and 79 years old with Type 1 or Type 2 diagnosed diabetes.
Source: IDF Atlas, 7th Edition, 2015.
Diabetes prevalence has risen slowly or stabilised in the majority of OECD countries, especially in Western Europe, but it has increased markedly in Turkey and most partner countries (Figure 3.24) These trends mirror partly trends in population ageing, as well as the rise of obesity and physical inactivity, and their interactions (NCD Risk Factor Collaboration, 2016). The share of obese people has been increasing strongly all around the world, and especially in the BRIICS (see indicators on obesity in Chapter 4).
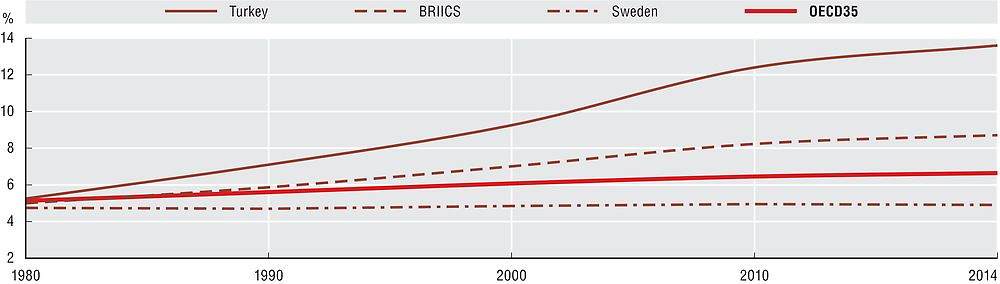
Note: Data cover those aged 18 years and over with Type 1 or Type 2 diagnosed diabetes.
Source: NCD Risk Factor Collaboration (2016).
Diabetes is slightly more common among men than women and the prevalence increases substantially with age. For example, in the United States the estimated share of diagnosed diabetics was about 3% for those aged 20-44, 12% for those aged 45-64 and 21% for those aged 65 years and over (Menke et al., 2015). Diabetes also disproportionately affects those in lower socio-economic groups and people from certain ethnicities.
Diabetes prevalence among children is much lower than among adults (Figure 3.25). Nevertheless, almost 230 000 children suffered from Type 1 diabetes in OECD countries in 2015. In Finland, almost five children per 1 000 were Type 1 diabetics. Prevalence rates were next highest in Sweden (2.6) and Norway (2). Korea and Japan had the lowest rates amongst OECD countries.
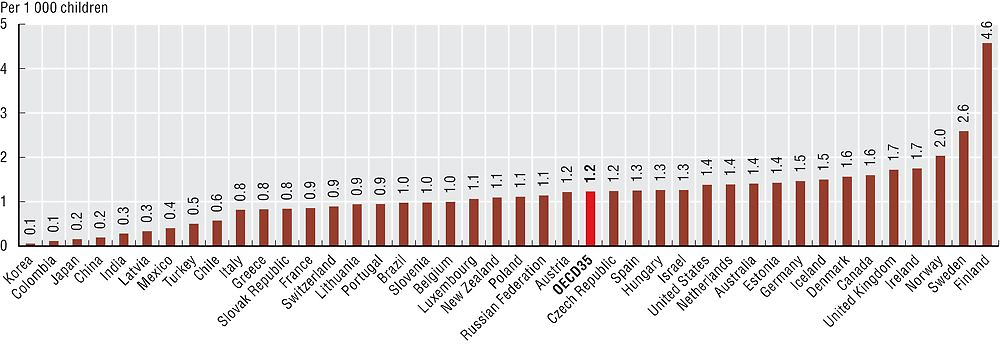
Note: Data cover those aged under 14 years old.
Source: OECD estimates based on IDF Atlas, 7th Edition, 2015 and the United Nations population statistics.
Diabetes bears heavy consequences on communities. Over 700 000 people died partly because of diabetes in OECD countries and these countries spent an average of about USD 4 600 per diabetic adult in 2015 (IDF, 2015). These burdens highlight the need for effective management of diabetes and its complications (see indicator on “Diabetes care” in Chapter 6), as well as appropriate preventive actions (see Chapter 4).
The sources and methods of the NCD Risk Factor Collaboration is described in the Lancet article and appendix (Lancet, 2016). Sources were selected among population-based studies that had collected data on measurement of diabetes biomarkers for Type 1 or Type 2 diabetics. Prevalence in sources were converted to meet the definition of diagnosed diabetes as defined in the Global Monitoring Framework for NCDs. Then, Bayesian hierarchical models were applied to estimate trends in prevalence. Adult’s population covers those aged 18 years and over.
The sources and methods used by the International Diabetes Federation are outlined in their Diabetes Atlas, 7th edition (IDF, 2015). Sources were only included if they met several criteria for reliability. Age-standardised rates were calculated using the world population based on the distribution provided by the World Health Organization. Adult’s population covers those aged between 20 and 79 years old with Type 1 or Type 2 diagnosed diabetes.
References
IDF – International Diabetes Federation (2015), IDF Diabetes Atlas, 7th edition, International Diabetes Federation, Brussels.
Menke, A. et al. (2015), “Prevalence of and Trends in Diabetes Among Adults in the United States, 1988-2012”, Journal of American Medical Association, Vol. 314, No. 10, pp. 1021-1029, https://doi.org/10.1001/jama.2015.10029.
NCD Risk Factor Collaboration (2016), “Worldwide Trends in Diabetes Since 1980: A Pooled Analysis of 751 Population-based Studies with 4·4 Million Participants”, The Lancet, Vol. 387, pp. 1513-1530, https://doi.org/10.1016/S0140-6736(16)00618-8.