Slovak Republic
-
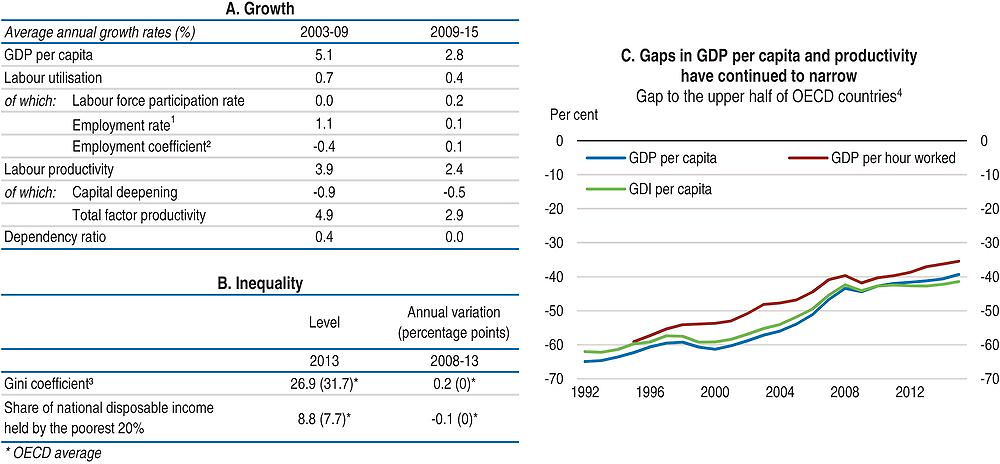
GDP per capita convergence towards leading OECD countries has continued, albeit at a significantly slower pace since the crisis. The shortfall related to the best performing countries remains substantial, notably because of low employment rates and weaker investment compared to the pre-crisis trend.
-
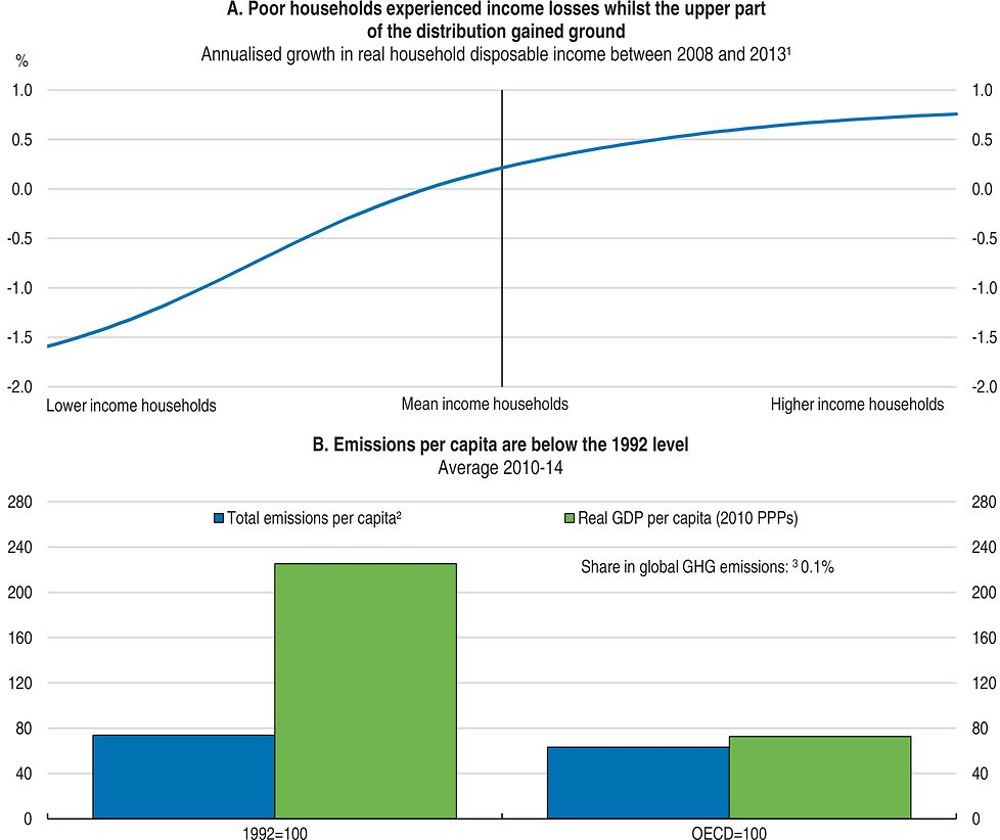
Income inequalities are below the OECD average but have increased in recent years. In particular, poverty is widespread in the eastern part of Slovakia, particularly among Roma minority.
-
Some progress has been made in the area of education. Teachers’ salaries have increased and a new Act on Vocational Education introduces elements of a dual system. Improvement in the recognition of non-formal learning can help increase participation in lifelong learning. More needs to be done to improve efficiency of the education system, as youth unemployment remains high. Improving the business environment and the innovation framework are no longer considered Going for Growth priorities, although further policy action in both areas is warranted.
-
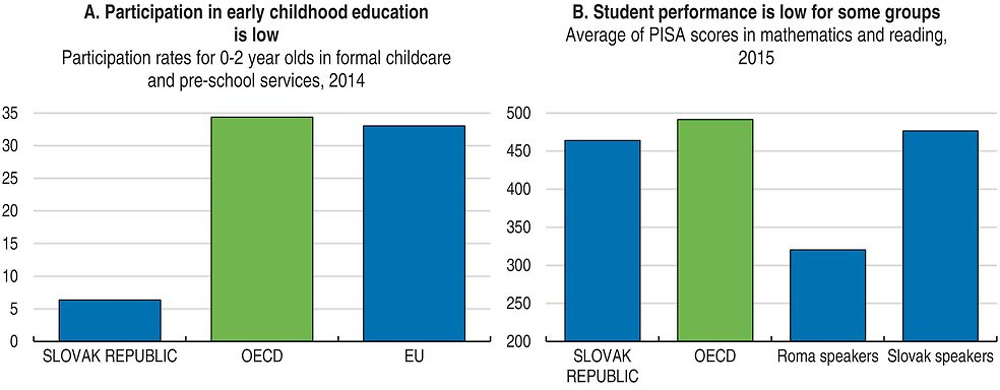
Pursuing the reform of the education system and public sector in general is a top priority. Developing advanced skills and better match those with labour market needs will be essential to maintain the income convergence towards the best OECD performers. This should be accompanied by policies improving the skills of students from disadvantaged backgrounds, notably Roma.
-
Increasing environmental taxation and abolishing subsidies on electricity will reduce the energy intensity and contribute to climate change.

1. The employment rate is defined with respect to the economically active population; a positive growth rate corresponds to a decline in the structural unemployment rate and vice-versa.
2. This adjustment variable is added to the decomposition to capture the impact of non-resident workers.
3. The Gini index measures the extent to which the distribution of disposable income among households deviates from perfect equal distribution. A value of zero represents perfect equality and a value of 100 extreme inequality.
4. Percentage gap with respect to the weighted average using population weights of the highest 17 OECD countries in terms of GDP per capita, GDP per hour worked and GDI per capita (in constant 2010 PPPs).
Source: Panel A: OECD, Economic Outlook No. 100 Database; Panel B: OECD, Income Distribution Database; Panel C: OECD, National Accounts and Productivity Databases.

Source: Panel A: OECD, Family Database; Panel B: OECD, PISA Database.
Going for Growth 2017 priorities
*Improve public sector efficiency.*1 Slovakia is underperforming in terms of public sector efficiency, which reduces the room of manoeuvre for both ensuring fiscal consolidation and financing growth-friendly measures.
Recommendations: The government should effectively implement the Value for Money initiative, which incorporates evidence-based analysis into policy making. This should be accompanied by improved human resource management and modernisation of public administration, to reduce the high turnover of civil servants and dependence on the political cycle. Monitor the implementation of anti-shell law and operation of the electronic contracting system for public procurement.
Improve funding, equity and effectiveness of the education system. The education system fails to provide adequate skills for the labour market.
Actions taken: The government has introduced a new Act on vocational education and training in 2015, which incorporates elements of a dual system including apprenticeships. The new system is increasing incentives for enterprises to provide training by making costs for practical training provision deductible from taxes.
Recommendations: Promote the entry of industry practitioners into the teaching workforce. Regularly publish information on labour market outcomes of graduates. Make tertiary education more attractive to technical secondary school graduates by developing short occupationally oriented tertiary programmes. Make budgetary allocations to universities more dependent on labour market outcomes.
Strengthen policies to promote lifelong training and mobility. Low participation in lifelong training and weak mobility hinders workers adjustments to the rapid changes in the skills requirements.
Actions taken: The government have adopted legislative changes in 2015 to improve the recognition of non-formal learning.
Recommendations: Target long-term unemployment by providing efficient public employment services and active labour market policies, including requalification and training programmes. Introduce training vouchers to increase participation in lifelong learning and provide financial incentives for offering apprenticeships, with strict quality control. In order to promote workers’ mobility, which is hindered by the high level of home ownership, suppress subsidies for house purchases including grants allocated to youth for housing purchases, the state bonus on saving devoted to housing purchase, and subsidised interest rate mortgages.
Reduce barriers to female labour market participation. Raising female labour market participation would foster economic growth and help to counter the impact of population ageing.
Actions taken: The early childhood education capacities have increased in 2015 and other 14.5 million have been allocated in building new childcare facilities in 2016.
Recommendations: The government should continue to expand childcare facilities. This should be accompanied with the reduction of the length of parental leave by making the share of the parental allowance conditional on fathers taking part of the parental leave. The disincentives to work for second earners should be removed from the tax system.
*Improve opportunities and outcomes for Roma population*. Weak educational outcomes of the Roma contribute to their difficulty to access the labour market.
Recommendations: Encourage social diversity in classrooms and target more resources to disadvantaged schools. Expand second chance education opportunities based on provision of formal certification combined with programs improving the chance to acquire work experience. Develop statistics to monitor the effectiveness of support to the Roma population. Introduce policies to reduce discrimination against Roma in education and the labour market.

1. The data show average annual growth rates in disposable income (i.e. income after tax and transfers) across the distribution and refer to the period between 2008 and 2013. Disposable incomes cover the full population. Income data are expressed in constant prices (OECD base year 2010).
2. Total GHG emissions including LULUCF in CO2 equivalents (UNFCCC). The OECD average (excluding Israel and Korea) is calculated according to the same definition.
3. Share in world GHG emissions is calculated using International Energy Agency (IEA) 2010 data.
Source: Panel A: OECD, Income Distribution Database; Panel B: OECD, National Accounts and Energy (IEA) Databases, United Nations Framework Convention on Climate Change (UNFCCC) Database.
Note
← 1. New policy priorities identified in Going for Growth 2017 (with respect to Going for Growth 2015) are preceded and followed by an “*”.
