France
-
The widened gap in GDP per capita related to most advanced OECD countries has proven persistent. Potential GDP per capita growth has fallen since the recession, owing to a lower employment rate and weak labour productivity growth.
-
Inequality as measured by the Gini index has increased since 2008 but remains below the OECD average. The share of income going to the poorest remained stable and is above average.
-
The government streamlined in-work benefits and has been reducing social security contributions. It deregulated some energy tariffs, opened passenger coach services to competition, extended Sunday trading opportunities and facilitated entry into some legal professions, while reforming their tariffs. An education reform strengthens individualised support and work in smaller groups.
-
Reducing excess coverage in wage agreements, while improving union representation, would promote employment and equity. Quickly implementing the foreseen quality assurance system for training, more individualised support and apprenticeships in secondary schools would help low-skilled workers enhance their productivity. Building on recent competition reforms would bolster productivity and innovation.
-
The higher CO2 component of excise taxes helps finance labour tax cuts, while improving the environment.
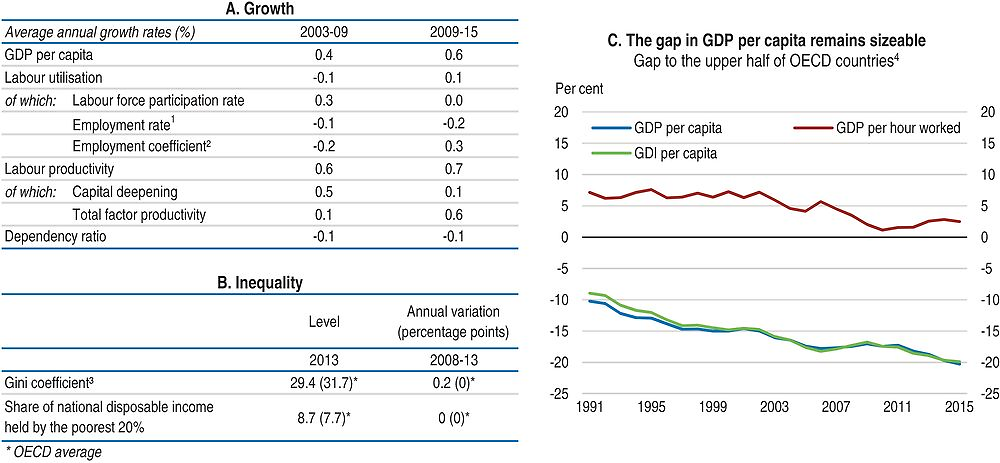
1. The employment rate is defined with respect to the economically active population; a positive growth rate corresponds to a decline in the structural unemployment rate and vice-versa.
2. This adjustment variable is added to the decomposition to capture the impact of non-resident workers.
3. The Gini index measures the extent to which the distribution of disposable income among households deviates from perfect equal distribution. A value of zero represents perfect equality and a value of 100 extreme inequality.
4. Percentage gap with respect to the weighted average using population weights of the highest 17 OECD countries in terms of GDP per capita, GDP per hour worked and GDI per capita (in constant 2010 PPPs).
Source: Panel A: OECD, Economic Outlook No. 100 Database; Panel B: OECD, Income Distribution Database; Panel C: OECD, National Accounts and Productivity Databases.
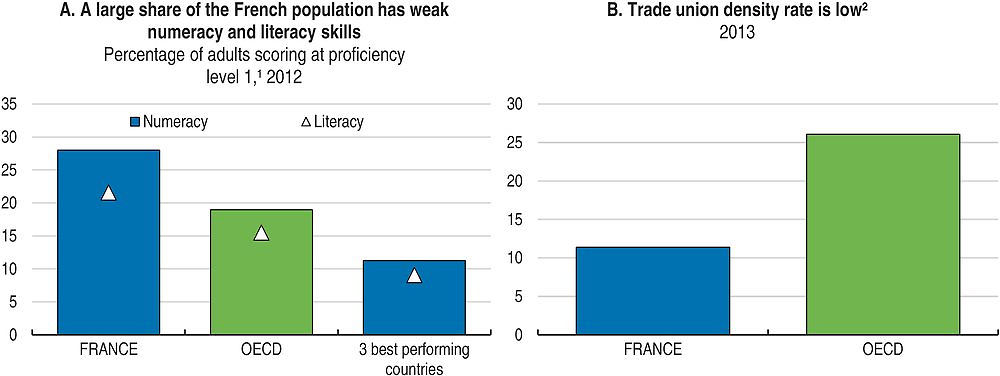
1. PIAAC levels of proficiency in numeracy and literacy are defined by particular score-point ranges and the level of difficulty of the tasks within these ranges. Includes adults scoring at PIAAC’s “below level 1” proficiency level. Adults scoring at proficiency level 1 or below are only able to perform basic arithmetic operations with whole numbers, whereas adults attaining the highest scores have proven to master analysis and more complex reasoning about quantities and data (level 4) or the ability to draw inferences and work with mathematical arguments and models (level 5).
2. Ratio of wage and salary earners that are trade union members, divided by the total number of wage and salary earners.
Source: Panel A: OECD (2013), OECD Skills Outlook 2013: First Results from the Survey of Adult Skills; Panel B: OECD estimates and J. Visser, ICTWSS Database on Institutional Characteristics of Trade Unions, Wage Setting, State Intervention and Social Pacts in 51 countries between 1960 and 2014; Version 5.1; Amsterdam Institute for Advanced Labour Studies AIAS, September 2016.
Going for Growth 2017 priorities
*Reduce excess coverage in wage agreements and streamline workers’ representation.*1 Reducing the use of administrative extensions and better alignment of union finances with membership fees would increase employment, while strengthening union representation and equity. Streamlining workers’ representation for larger firms would reduce impediments to firm growth.
Recommendations: Reduce the administrative extension of collective agreements, align union finances better with membership fees, and continue streamlining workers’ representation, in particular for larger firms.
Reform job protection and strengthen active labour market policies. More legal certainty for dismissals would reduce labour market duality and improve productivity. Bringing penalties more in line with job-search effort would make active labour market policies more effective.
Actions taken: A reform of labour courts setting deadlines for dismissal procedures was introduced in 2015, and the 2016 labour law reform clarifies conditions for economic dismissals. In 2015 the government stepped up individualised support and wage subsidies for young, low-qualified workers further and announced a doubling of training offers to the unemployed in 2016.
Recommendations: Continue to improve legal certainty for dismissals, evaluate wage subsidies and enhanced counselling for the young and bring penalties more into line with job-search efforts.
Improve the equity and quality of education. Individualised support for weak students and access to training for low-skilled adults would strengthen their productivity and employment prospects, enhancing equity.
Actions taken: Following a 2014 reform a personal account with training rights is being implemented along with guidance and quality-assurance systems. A lower-secondary school reform implemented in 2015 provides more resources for schools with many weak students for individual support and work in small groups.
Recommendations: Implement the guidance and quality-assurance systems for training quickly, and ensure access to a wide range of training offers through the personal account. Introduce more apprenticeships in upper-secondary schools and provide teachers with professional training and pedagogical support to effectively implement individualised support for weak students.
Reduce regulatory barriers to competition. Easing firm entry in services and Sunday trading would boost competition, productivity and jobs.
Actions taken: In 2015 the government liberalised energy tariffs for large commercial customers, extended conditions for Sunday trading in some areas, opened passenger coach services to competition and eased entry into some legal profession along with a tariff reform.
Recommendations: Reduce entry barriers, quotas and exclusive rights in other regulated professions, and create the same conditions for Sunday trading everywhere.
Reduce labour taxation. Lower labour taxes across the board will translate into employment gains without creating low-wage traps.
Actions taken: In 2015 and 2016 the government streamlined in-work benefits, introduced temporary hiring subsidies and reduced the labour tax wedge on lower wages, by lowering various social contributions and introducing a business tax credit. This was financed by lower spending growth. CO2 taxes were gradually increased in 2016.
Recommendations: Labour cost reductions should be streamlined, by translating them into contribution cuts across the board, financed by spending cuts and an increase of taxes on other bases.
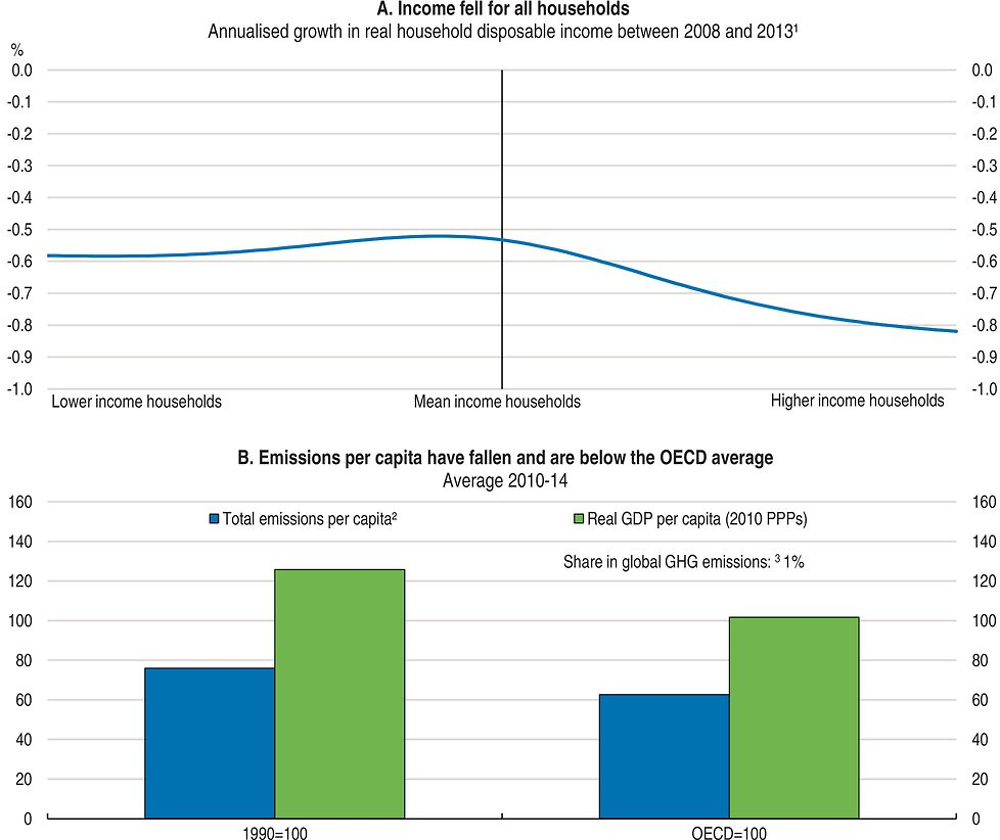
1. The data show average annual growth rates in disposable income (i.e. income after tax and transfers) across the distribution and refer to the period between 2008 and 2013. Disposable incomes cover the full population. Income data are expressed in constant prices (OECD base year 2010).
2. Total GHG emissions including LULUCF in CO2 equivalents (UNFCCC). The OECD average (excluding Israel and Korea) is calculated according to the same definition.
3. Share in world GHG emissions is calculated using International Energy Agency (IEA) 2010 data.
Source: Panel A: OECD, Income Distribution Database; Panel B: OECD, National Accounts and Energy (IEA) Databases, United Nations Framework Convention on Climate Change (UNFCCC) Database.
Note
← 1. New policy priorities identified in Going for Growth 2017 (with respect to Going for Growth 2015) are preceded and followed by an “*”.