Belgium
-
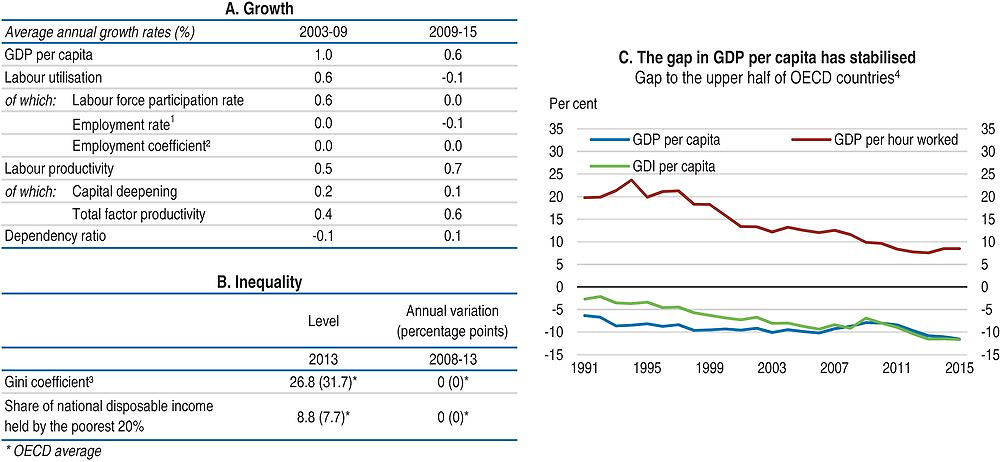
Income per capita gap relative to the upper half of OECD is widening due to a decline of both labour productivity and labour force participation growth rates. However, labour productivity level is still one of the highest among OECD countries.
-
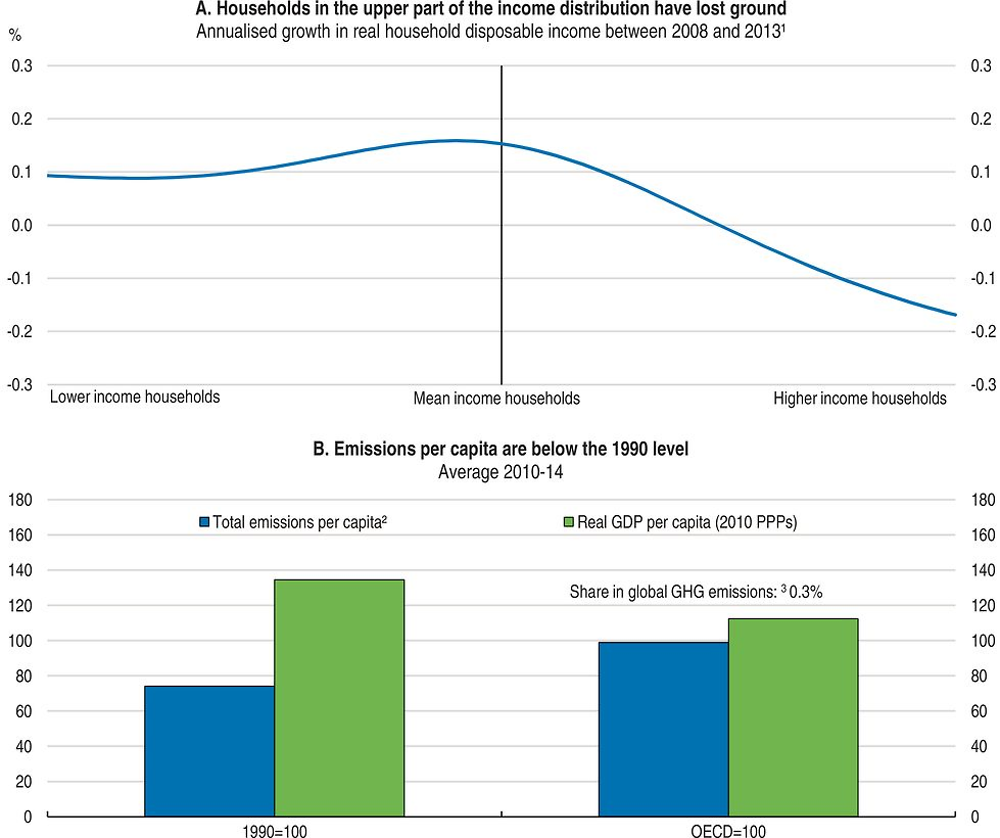
Income inequality is comparatively low and stable as households at the lower end of the income distribution have benefited just as the whole population from growth in GDP per capita, thanks to the tax and transfer system.
-
Important steps have been taken in August 2015 to strengthen the employment rate of older workers and to improve the sustainability of the pension system, including by increasing the minimum statutory retirement age and tightening early retirement schemes. The 2015 tax reform, shifting taxes from labour earnings to other bases, will progressively reduce labour cost but the tax wedge remains comparatively high and the work incentives of some low-skilled workers comparatively low. Despite reforms of the pension system in 2015, more needs to be done to improve employment rates of older workers. Further actions should also be taken to strengthen work incentives associated with tax and transfers.
-
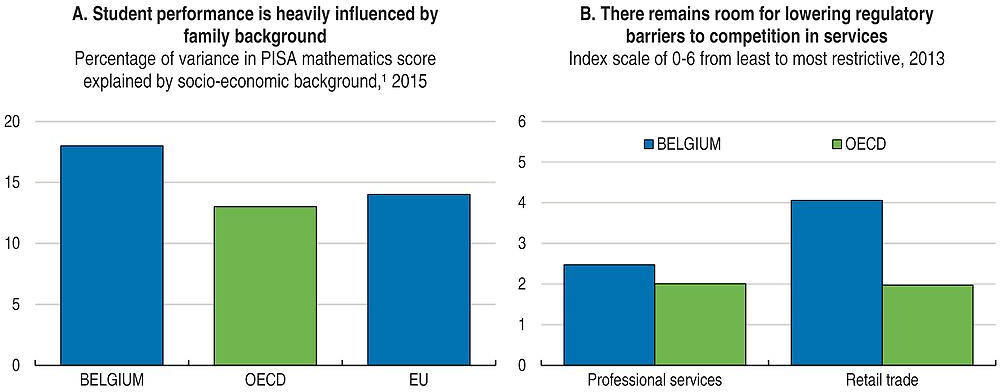
Strengthening equity in education by reducing the concentration of disadvantaged students in particular schools and attracting the best teachers in such schools would boost skills and reduce inequality. Easing administrative burden and simplifying entry regulation in professional services, retail and network industries would boost competition and productivity growth. Reforming the highly co-ordinated wage bargaining system would ensure a better alignment of wages with productivity and would contribute to preserve cost competitiveness.

1. The employment rate is defined with respect to the economically active population; a positive growth rate corresponds to a decline in the structural unemployment rate and vice-versa. Using the age group of 15-74 instead of 15-64 for the employment rate may exacerbate the decline in labour utilisation for Belgium.
2. This adjustment variable is added to the decomposition to capture the impact of non-resident workers.
3. The Gini index measures the extent to which the distribution of disposable income among households deviates from perfect equal distribution. A value of zero represents perfect equality and a value of 100 extreme inequality.
4. Percentage gap with respect to the weighted average using population weights of the highest 17 OECD countries in terms of GDP per capita, GDP per hour worked and GDI per capita (in constant 2010 PPPs).
Source: Panel A: OECD, Economic Outlook No. 100 Database; Panel B: OECD, Income Distribution Database; Panel C: OECD, National Accounts and Productivity Databases.

1. Strength of the relationship between mathematics performance and the PISA index of economic, social and cultural status (ESCS).
Source: Panel A: PISA Database; Panel B: OECD, Product Market Regulation Database.
Going for Growth 2017 priorities
*Improve outcomes and equity in education.*1 Education outcomes are strongly linked to socio-economic background, high concentration of disadvantaged students in particular schools hampers learning of disadvantaged children and early school leaving is comparatively high.
Recommendations: Strengthen school-level social diversity programmes and attract qualified and experienced teachers to disadvantaged schools. Reduce early tracking and grade repetition. Promote the participation of immigrants’ children in early childhood education to reduce language handicaps. Assess systematically language proficiency in primary and secondary school and provide languages classes when needed.
Reform the wage bargaining system. The wage setting system makes difficult the alignment of wages on productivity and undermines cost competiveness.
Actions taken: The wage indexation mechanism, which puts a floor on wage adjustment, was temporarily suspended as of April 2015 to allow real wages to decline by 2%. An ex-post correction mechanism has been introduced in the wage to better preserve cost-competitiveness “wage norm” system, which sets the maximum increase of wages based on projections of foreign wage development.
Recommendations: Assess the results of the reform of the wage indexation system and consider additional reforms to ensure a better alignment of wages with productivity Encourage social partners to gradually phase-out the wage indexation system.
Increase product market competition. Administrative burden, restrictive regulation in services and multi-layer regulators in network industries hamper competition and productivity.
Actions taken: Regulatory impact assessment has been made mandatory at the federal level. Administrative simplifications have been achieved by expanding further the use of e-procedures in the context of the e-government strategy.
Recommendations: Preserve external cost competitiveness by strengthening competition in various professions that provide services used notably by exporting industries. Reduce regulatory barriers to entry in accountancy, legal and architecture services. Ease regulation in retail services, in particular regarding the restrictions on large outlets, shop opening hours and the protection of incumbents. Simplify administrative procedures and licence requirements to start an activity. Simplify the regulatory structure of network industries by establishing a single regulator layer for each network industry.
Further reduce the tax wedge and enhance financial work incentives and activation policies. High labour costs and a quick phasing-out of the wedge reduction schemes contribute to reduce labour supply for low wage earners.
Actions taken: The employers’ social security contribution on low wages has been reduced in 2016 by seven percentage points. Financial incentives to work were strengthened in 2015 and 2016 by increasing the take-home pay of low paid workers thanks to lower social security contribution of employees.
Recommendations: Continue reducing the tax wedge, especially for low-skilled workers, as the tax wedge on labour earnings remains one of the highest in Europe. Reduce the risk of low wage trap by implementing a more gradual phasing-out of the reduced tax wedge as the wage rate increases. Combine specific rate reductions for older workers with expanded lifelong learning programmes to bring their labour cost in line with their productivity.
*Improve the integration of migrants*. The labour market achievement of immigrants is comparatively poorer with an employment rate ten percentage points lower than native born and an overrepresentation in low quality jobs.
Recommendations: Further develop validation programmes for skills acquired abroad. Expand language course programmes adapted to workplace needs, notably by combining them with other forms of training. Further engage social partners in firm-level diversity plans, including in the public sector where the share of immigrants employees is low. Narrow the scope of statuary public sector jobs for which EU citizenship is required.

1. The data show average annual growth rates in disposable income (i.e. income after tax and transfers) across the distribution and refer to the period between 2008 and 2013. Disposable incomes cover the full population. Income data are expressed in constant prices (OECD base year 2010).
2. Total GHG emissions including LULUCF in CO2 equivalents (UNFCCC). The OECD average (excluding Israel and Korea) is calculated according to the same definition.
3. Share in world GHG emissions is calculated using International Energy Agency (IEA) 2010 data.
Source: Panel A: OECD, Income Distribution Database; Panel B: OECD, National Accounts and Energy (IEA) Databases, United Nations Framework Convention on Climate Change (UNFCCC) Database.
Note
← 1. New policy priorities identified in Going for Growth 2017 (with respect to Going for Growth 2015) are preceded and followed by an “*”.
