Student performance and equity in education
The main goal of education systems in OECD and partner countries is to equip students and adults with the knowledge and skills necessary to achieve their full potential. The PISA survey, conducted every three years, measures the learning outcomes of 15 years old students in reading, mathematics and science. It allows a comparison not only of national averages but also of the differences in scores across various student groups and across schools. The focus of PISA 2015 was on science. The assessment measured three key abilities: to explain scientific phenomena, to design and evaluate scientific enquiry, and to interpret data and evidence scientifically.
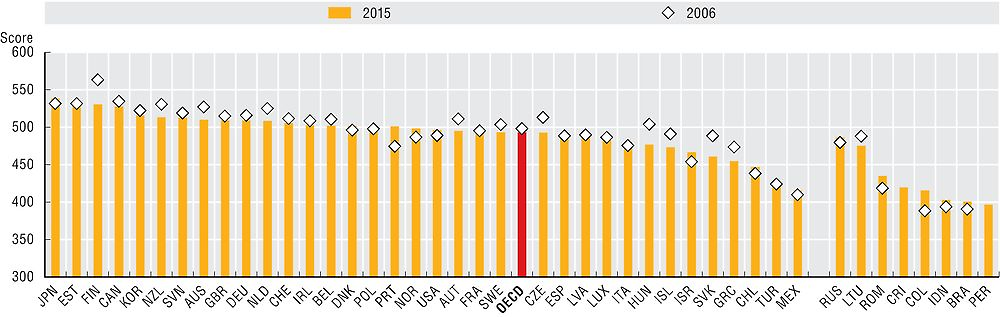
In 2015, the top PISA performers in science among OECD member countries were Canada, Estonia, Finland and Japan, all with an average student score above 525 points compared to an OECD average of 493. By contrast, Chile, Mexico and Turkey had the lowest student average scores among OECD countries. Over the past decade, the average PISA score in science increased significantly in Israel, Norway and Portugal by more than 10 points whereas it decreased the most in Finland, Hungary and the Slovak Republic by more than 25 points.
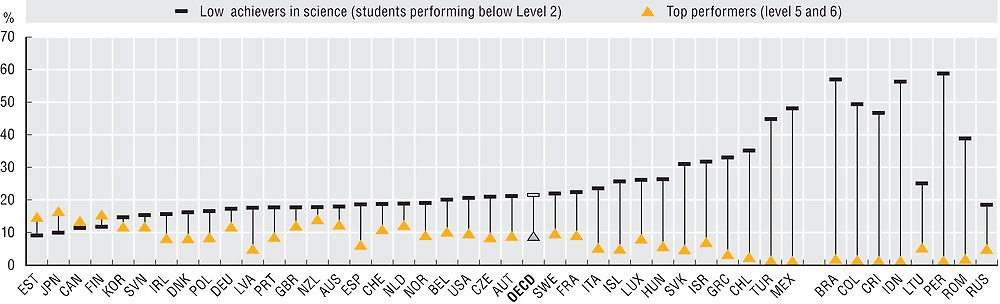
Moving away from country averages, the percentage of students who reach each level of proficiency indicates how well countries are able to tackle low performance while also supporting excellence. Attaining at least Level 2 is particularly important, as Level 2 is considered a baseline level of proficiency that all young adults should be expected to attain in order to take advantage of further learning opportunities and participate fully in the social, economic and civic life of modern societies in a globalised world (OECD, 2016). In science students that reach Level 2 students can draw on their knowledge of basic science content and procedures to identify an appropriate explanation, interpret data, and identify the question being addressed in a simple experiment.
In Canada, Estonia, Japan and Finland there are more top performers (Level 5 and 6) than low performers, (below Level 2). At Level 5 and 6, students use abstract scientific ideas or concepts to explain unfamiliar and more complex phenomena, events and processes involving multiple causal links. In Mexico and Turkey there are few top performers whereas the share of low performers is very high with more than 40% of all students performing below Level 2.
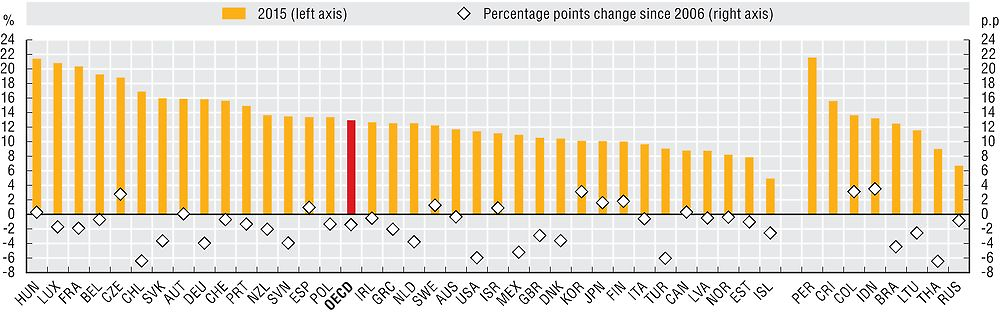
Socio-economically disadvantaged students are almost three times more likely than advantaged students not to attain the baseline level of proficiency in science (OECD, 2016). On average 13% of the variation in student performance in science across OECD countries can be explained by students’ socio-economic status. The socio economic status of students explains less than 10% of the variance in science performance in countries such as Canada, Estonia, Iceland, Italy, Latvia, Norway and Turkey whereas in France, Hungary and Luxembourg it explains more than 18% of the variance in performance.
Over the past decade, the share of the variance in science performance explained by students socio-economic status decreased significantly in Chile, Turkey and the United-States whereas it increased the most in the Czech Republic and Korea. In addition to socio-economic status, there is also substantial variation in scores between immigrant and non-immigrant students in some OECD member countries.
For disadvantaged students and more generally for students who have difficulty with science, additional resources targeted to students or schools with the greatest needs can make a difference in helping students acquire a baseline level of science literacy and develop a lifelong interest in the subject. All students would also benefit from a more limited application of policies that group students into different programme tracks or schools and from a limited and strategic use of grade repetition (OECD, 2016).
Data for all figures come from the 2015 Programme for International Student Assessment (PISA). It assessed the competencies of 15-year-olds in 72 countries and economies. For more information on the underlying data see: http://www.oecd.org/pisa/.
In PISA, a student’s socio-economic status is estimated by the index of economic, social and cultural status (ESCS), which is derived from several variables related to students’ family background: parents’ education, parents’ occupations, a number of home possessions that can be taken as proxies for material wealth, and the number of books and other educational resources available in the home. Advantaged and disadvantaged students are defined as those in the top/bottom 25% of the distribution of the ESCS index within their country.
The figure on the “Difference in science performance between immigrant and non-immigrant students, 2015” is available online (see Annex F). Only countries where the percentage of immigrant students is higher than 6.25% are shown.
Further reading
OECD (2016), PISA 2015 Results (Volume I): Excellence and Equity in Education, PISA, OECD Publishing, Paris. https://doi.org/10.1787/9789264266490-en
Figure notes
14.32. Variations in mean scores are only statistically significant in Australia, Austria, Czech Republic, Republic, Finland, Greece, Hungary, Iceland, Netherlands, New Zealand, Norway, Portugal and the Slovak Republic
The changes in the average mean scores are only statistically significant in Australia, Austria, Czech Republic, Republic, Finland, Greece, Hungary, Iceland, Netherlands, New Zealand, Norway, Portugal and the Slovak Republic are statistically significant.
14.33. Countries are ranked in ascending order of the share of low performers.
Information on data for Israel: https://doi.org/10.1787/888932315602
Source: PISA 2015 Results (Volume I): Excellence and Equity in Education
Source: PISA 2015 Results (Volume I): Excellence and Equity in Education
Source: OECD, PISA 2015 Database, Tables I.2.3, I.6.1, I.6.3a, I.6.7, I.6.17, I.7.1 and I.7.15a.