Public sector cost effectiveness
Public sector cost-effectiveness can be measured by looking at the relationship between inputs (human or financial) and some of the main outcomes in each sector. In general, outcomes refer to the results of public programmes and services in terms of health gains, learning gains, satisfaction gains and confidence gains. In a context of tight budget constraints, improving the cost-effectiveness of public services matters because the outcomes are ultimately what citizens care the most about and governments also need to demonstrate that expenditures are put to good use. However, while part of the ultimate outcomes can be attributed to public services, there is often an issue of attribution since many other factors can also have an impact on these outcomes in health, education and other aspects of people’s lives.
Health care
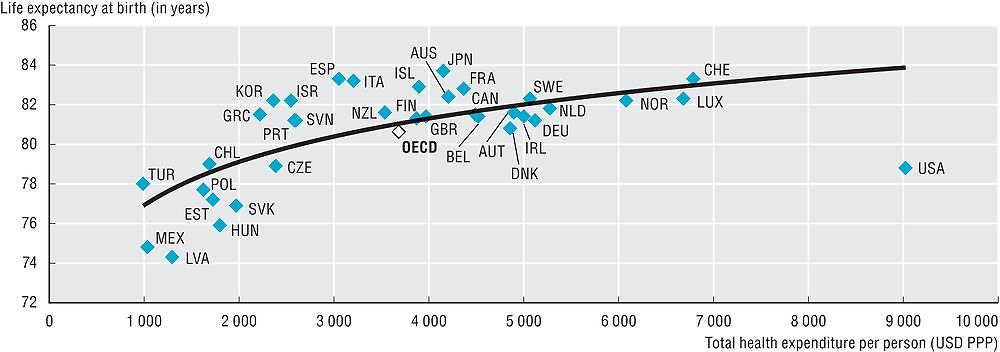
Cost-effectiveness in health care can be measured by looking at the relationship between total current health care expenditures (or only public expenditures on health, which account for about 75% of total health spending) and life expectancy at birth. While life expectancy at birth is a commonly used indicator of health outcomes, it is of limited value as an indicator of the effectiveness of health services, in that it is only measuring the length of life and not the health-related quality of life of people. It is also affected by many other factors beyond health care activities and spending, including the living and working conditions of people (education and income level), the physical environment (e.g. air pollution), behavioural factors (such as smoking, alcohol consumption and nutrition) and many others.
Higher health spending tends to be associated with longer lives, although the relationship generally becomes weaker as health spending increases. This suggests that after a certain spending level, most of the difference in life expectancy between countries can be explained by the quality of spending and other environmental and behavioural factors. Israel, Italy, Japan, Korea and Spain have relatively high life expectancy relative to their health expenditure. On the other hand, Hungary, Latvia, Mexico and the United States have a lower life expectancy than what might be predicted given their level of health spending. In Mexico and the United States about half of total health spending comes from private sources. The extent to which these two countries have a relatively low life expectancy compared to the OECD average is reduced when only public spending on health care is taken into account (online figure).
Education
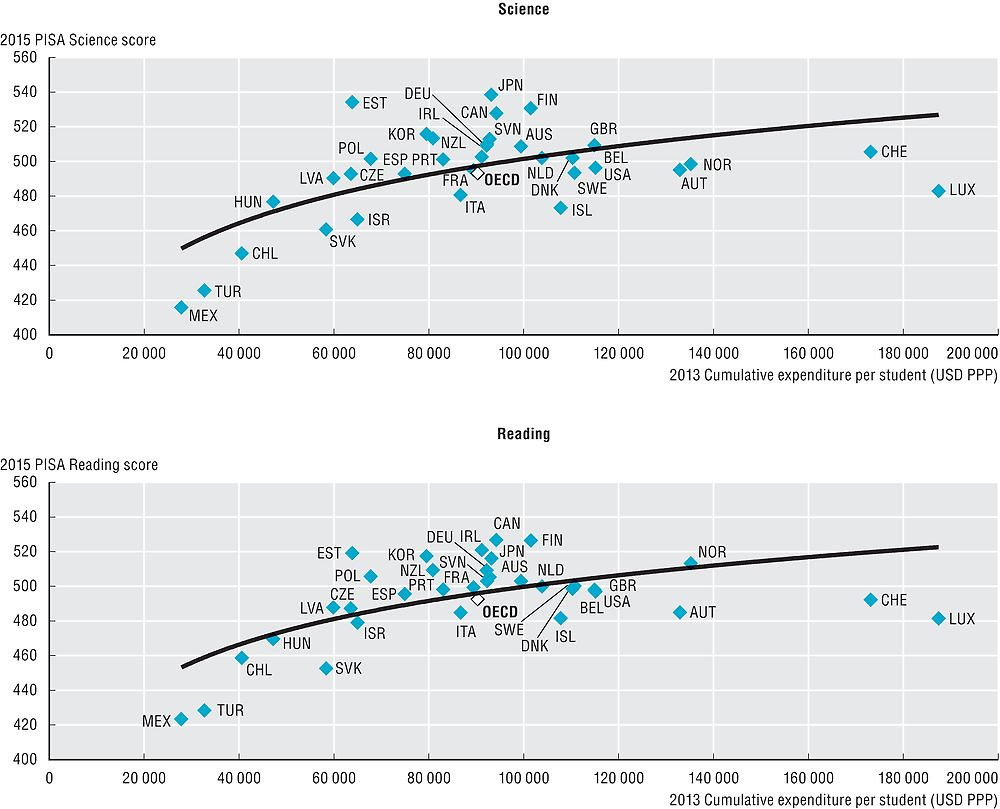
Every three years, the OECD Programme for International Student Assessment (PISA) measures the performance of 15-year-old students in three domains: mathematics, reading and science. The 2015 PISA assessment had a particular focus on science. The comparison between the learning outcomes of student based on PISA scores and the cumulative expenditure per student between 6 and 15 years of age on education provides a general measure of the cost-effectiveness of education systems. However, the variable of expenditures used excludes extra hours of classes paid by parents, which can account for a significant share of spending on education in a number of OECD countries.
There is a positive relationship between PISA scores in science and reading and cumulative expenditures per student. However, the correlation holds particularly true for low levels of cumulative expenditure per student since above a certain threshold (around 80 000 USD PPP), student performance seems to depend on other factors such as the quality of teachers, the socio-economic background of students and school management practices, among others. Countries such as Canada, Estonia, Finland, Japan, Korea and Poland spend close to or less than the OECD average per student, but achieve better performances. On the other hand, expenditures per student in Iceland and Luxembourg are higher than the OECD average but their scores in science and reading are below average.
Life expectancy measures how long on average people would live based on a given set of age-specific death rates. Total current expenditure on health measures the final consumption of health goods and services (i.e. current expenditure) and excludes capital investment in health care infrastructure. This includes spending by both public and private sources on medical services and goods, public health and prevention programmes, and administration.
“Data on expenditures per student” refers to the 2013 financial year. Spending per student equals the total expenditure by education institutions (both public and private) divided by the corresponding full-time equivalent enrolment and includes core and ancillary services. Due to differences across countries in the duration of courses, annual spending per student may not fully reflect the total spent on a student. The achievement scores were based on the 2015 PISA assessments of 15-year olds in science and reading.
Figure 13.12., showing the relationship between life expectancy at birth and current public expenditure on health per capita (2014), is available on line (see Annex F).
Further reading
OECD (2015), “Health at a Glance 2015: OECD Indicators”, OECD Publishing, Paris, https://doi.org/10.1787/health_glance-2015-en.
OECD (2016), “Education at a Glance 2016: OECD Indicators”, OECD Publishing, Paris, https://doi.org/10.187/eag-2016-en.
OECD (2016), “PISA 2015 Results (Volume I): Excellence and Equity in Education”, PISA, OECD Publishing, Paris, https://doi.org/10.1787/9789264266490-en.
Figure notes
13.11: Data on cumulative expenditure for Greece are not available.
Information on data for Israel: https://doi.org/10.1787/888932315602.
Source: OECD (2016), Health Statistics, OECD, Paris.
Source: OECD (2016), PISA Database, OECD, Paris.