Trust in government
Trust can be understood as a positive perception about the actions of an individual or an organisation. This positive perception can be grounded in actual experience, but is determined to a large extent by the subjective assessment of individuals. Trust in government is both a driver of government effectiveness and economic development, and an outcome measure for government action. Trust in government leads to greater compliance with regulations and the tax system, facilitates social and political consensus, enhances the acceptance of policies that call for short-term sacrifices by citizens, and mobilises citizen engagement to enable open and inclusive governance processes. Trust in government also supports economic growth by stimulating investment and consumption. Levels of trust in government are influenced by whether citizens consider government as reliable, responsive and fair as well as capable of protecting citizens from risks and delivering public services effectively.
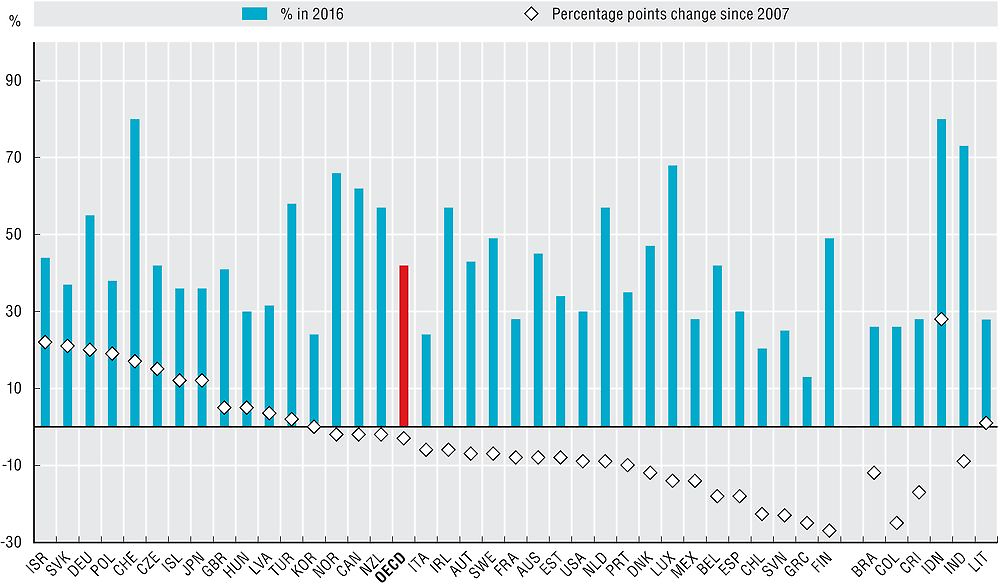
Levels of trust in the national government vary strongly between OECD countries and over time. Social, economic and cultural factors have a large influence on differences in levels of trust in government across countries. Consequently, changes in trust levels over time are the focus here rather than absolute trust levels. Most recent data is compared to values for 2007, the year before the onset of the financial and economic crisis. On average, less than half of OECD countries’ citizens (42%) have trust in their national government, which represents a decline of three percentage points since 2007. The greatest loss of trust in national government by more than 20 percentage points has occurred in Chile, Finland, Greece and Slovenia. At the other end, a similar level of positive changes in trust is observed in Israel, Germany and the Slovak Republic. However, changes in trust levels over time need to be interpreted with caution. They could be affected by many factors, including the economic situation, political changes (e.g. elections) or other major events, such as disasters or major scandals (e.g. corruption cases). Moreover, expectations by citizens could grow at a faster pace than government responses, challenging the confidence of citizens in the ability of governments to react to new demands.
Trust in government is strongly correlated with citizens’ approval of their country’s leadership and perceived spread of corruption in government in OECD countries. Where governments are perceived to have high moral integrity, more people trust government. Similarly, the actions of country leaders and the resulting public opinion about them may have an impact on the public perception of the government institutions they represent.
Measures of trust in government frequently rely on evidence from perception surveys. Data are derived from the Gallup World Poll (GWP) here, which is the most widely used survey instrument to measure trust in government. It is the only survey that collects data on levels of trust in government on an annual basis for OECD countries and other major economies. The GWP collects data based on proportional stratified probability sampling and uses a sample of around 1 000 citizens for most countries.
The GWP’s methodology has some limitations: it measures trust in government through a single question on whether or not people have confidence in their national government; it does not specify any particular parts of national government or differentiate between politicians and the government bureaucracy in its survey question. The GWP does not allow for the identification of government actions that might cause citizens to trust or distrust their government.
More information on the Gallup World Poll can be found at: www.gallup.com/services/170945/world-poll.aspx.
Further reading
OECD (2016), “Trust in government”, OECD, Paris, www.oecd.org/gov/trust-in-government.htm.
OECD (forthcoming), “Trust in government: Towards actionable policy insights.” Background paper, OECD, Paris.
Figure notes
Data on the confidence in national government for Canada, Iceland and the United States in 2016 are based on a sample of around 500 citizens.
Data refer to the percentage who answered “yes” to the question, ‘‘Do you have confidence in national government?’’. Data for Austria, Finland, Ireland, Norway, Portugal, the Slovak Republic, Slovenia and Switzerland are for 2006 rather than 2007. Data for Iceland and Luxembourg are for 2008 rather than 2007.
Information on data for Israel: https://doi.org/10.1787/888932315602.
Source: Gallup World Poll.