Applying behavioural insights to policy design and delivery
Behavioural insights (BI) aim to improve the welfare of citizens and consumers through policies and regulations that are formed based on studies, derived using experiments and observation. BI is about taking an evidence-based approach to policy making, empirically testing different approaches to solving issues and problems before considering their implementation. By using a mix of traditional economic strategies and insights from psychology, cognitive science and other social sciences, it identifies patterns of behaviour that replace and challenge established assumptions on what is thought to be rational behaviour.
BI are gaining popularity among governments as a useful tool to create new solutions that can be relatively simple and particularly effective. BI tackle directly the behavioural biases that often prevent governments’ interventions from achieving expected results. New frontiers for this method push policy-making beyond the individual and seek to impact organisational behaviour, allowing government to make an effective impact on, for example, regulated sectors and public and private organisations.
In a unique survey, the OECD (2017) mapped the application of BI around the world and across a number of sectors, including consumer protection, education, energy, environment, finance, health and safety, labour market, public service delivery, taxes and telecommunications. Results show that BI are no longer seen as a fashionable short-term trend, but have taken root in many countries. Moreover, the application of BI shows greater potential than is currently being practised. BI seem to be used only some of the time and primarily at the later design and implementation stages for new policies, rather than the initial ‘research/diagnostics’ stage. This means they are applied when a policy is already in place, to fine-tune and improve implementation and compliance. The next step is to take BI into consideration when evaluating and designing policies.
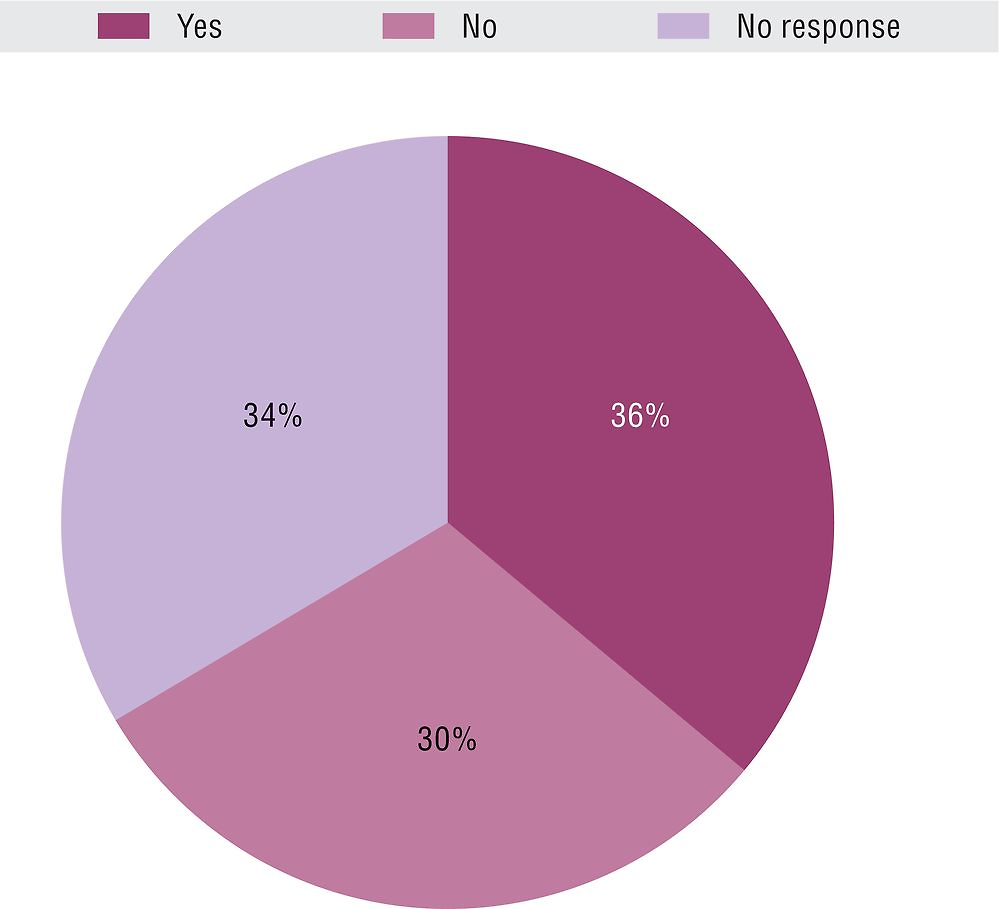
Evaluation of experiment results is another area of attention for future growth. Good scientific methods require results and impacts to be evaluated, particularly to make any assumptions on what can or cannot work. However, results show that only 36% of cases underwent evaluation, compared to 30% that did not. Even without counting some of the 34% of cases that did not provide a response (probably as the result of a lack of any evaluation), this seems to suggest that this is an area in need of further development as it risks weakening the effectiveness of applying BI.
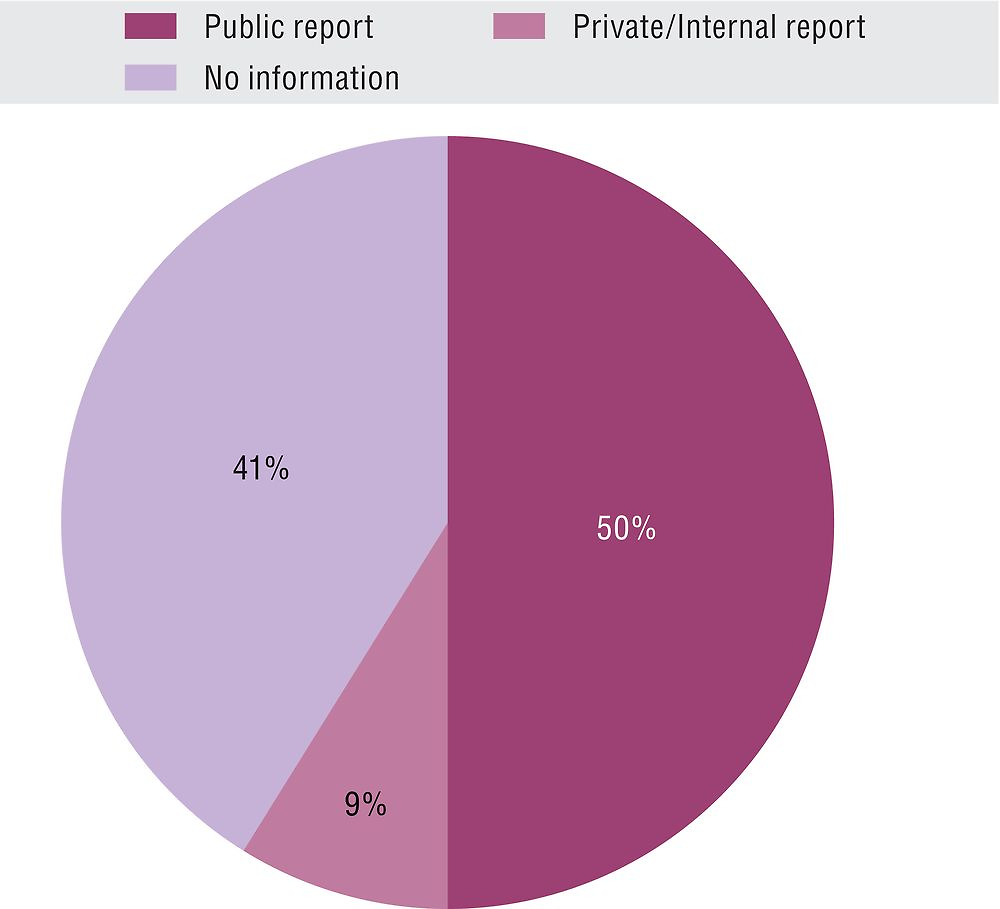
Regarding transparency, results of experiments provide a mixed picture. Some 50% of the reported case studies were published, mostly as a government or institutional report and the rest online – often by a consulting firm, international institution or non-governmental partner – or via academic journals and working papers. The remaining cases were either published via internal private documents (9%) or did not provide information (41%), which, for some, may be an indication that the results have yet to be published.
As governments continue to progress in the use of BI, it is increasingly important to share what works, and what does not. For example, the US Social and Behavioural Sciences Team (SBST) and the United Kingdom’s Behavioural Insights Team (BIT) both produce annual reports. Regular reporting of results can serve the dual benefit of addressing ethical issues raised about the appropriateness of public bodies applying BI, while also maintaining high standards in their application.
The data presented come from the OECD 2016 Behavioural Insights Case Study Survey, which was circulated to OECD delegates as well as academic and practitioner networks to capture both the diversity of BI applications and the state of play across countries and sectors. A total of 59 institutions (Annex online) representing 22 OECD and partner countries, the United Nations Development Programme (UNDP) and the World Bank responded to the survey. A total of 82% of respondents were central government departments and regulatory and tax authorities (split evenly). Subnational and local governments, central banks, international organisations, government programmes and bodies set up for a highly-specialised purpose compose the rest. Further information on the survey and work on BI can be found at www.oecd.org/gov/regulatory-policy/behavioural-insights.htm.
Further reading
OECD (2017), Behavioural Insights and Public Policy: Lessons from around the World, OECD Publishing, Paris, https://doi.org/10.1787/9789264270480-en.
OECD (2016), Protecting Consumers through Behavioural Insights: Regulating the Communications Market in Colombia, OECD Publishing, Paris. https://doi.org/10.1787/9789264255463-en.
Lunn, P. (2014), Regulatory Policy and Behavioural Economics, OECD Publishing, Paris. https://doi.org/10.1787/9789264207851-en.
Figure notes
8.8: Data represent responding institutions that answered “yes” to applying behavioural insights “at least some of the time”.
8.9 and 8.10: The 59 respondents provided 158 case studies. Data for Austria, Belgium, the Czech Republic, Estonia, Greece, Iceland, Japan, Korea, Latvia, Luxembourg, Mexico, Norway, Poland, the Slovak Republic, Slovenia, and Turkey are not available. Data for Singapore, UNDP and the World Bank were included on an ad hoc basis, as they have well-advanced behavioural insights units.
Information on data for Israel: https://doi.org/10.1787/888932315602.
Source: OECD (2016) Behavioural Insights Case Study Survey, OECD, Paris.
Source: OECD (2016) Behavioural Insights Case Study Survey, OECD, Paris.