Compensation of secretarial staff
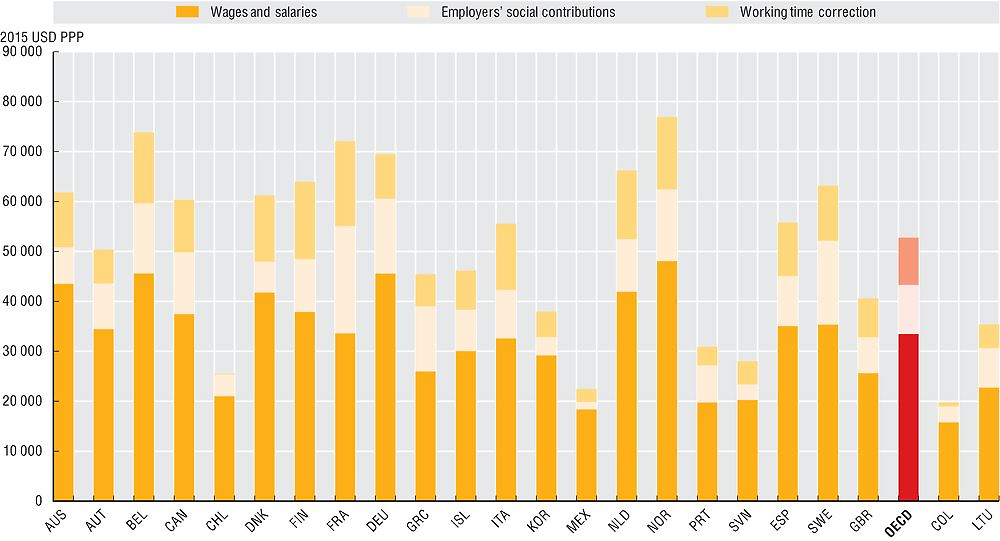
Secretarial staff represent the lowest level of hierarchy of the professions for which compensation data is collected by the OECD. They are generally positions that require lower skill levels, less education, and are more often occupied by women. On average, secretaries’ compensation amounts to USD 52 748 PPP, including USD 9 823 PPP employer’s contributions and USD 9 445 PPP for working time correction. Employer’s social contributions and the correction for working time each amount to around 18% of total compensation. Compensation may vary depending on working conditions and local environment, but also working hours. The data displayed here is corrected for those differences in working time and holidays. In Chile, the number of working hours is the highest.
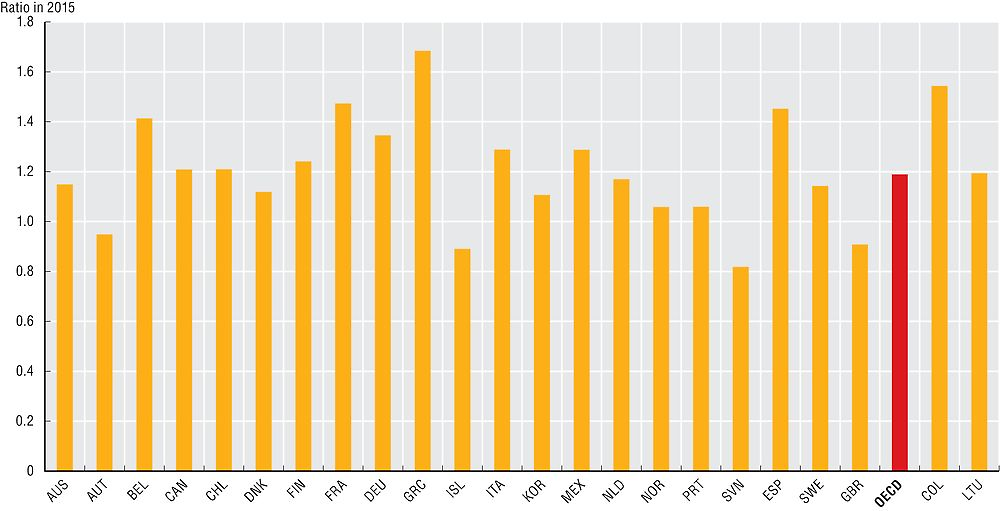
As for the other occupation categories reviewed here, the levels of employer’s social contributions are very diverse across OECD countries for secretarial positions. Differences can be explained by historical, cultural or political variables and national preferences on how much social security benefits to provide and how to fund the social security system. Social contributions can be perceived as deferred wage (pensions) and insurance schemes (health) supported by the collective organisation. To account for the total amount of contributions to social security systems, employee’s social contributions included in the gross wage need to be added. Furthermore, the amount of social contributions does not necessarily reflect the quality of the social security system. As for other occupations, the share of employer’s social contributions is very low in Mexico as well as Colombia and particularly high in Sweden and France. When corrected for GDP per capita, secretaries’ compensation in Greece as well as Colombia is highest, while it is lowest in Slovenia and Iceland.
Relative wages are a major component of workers’ happiness and motivation. They are key to perceived fairness and consequently impact motivation. The dispersion of compensation inside the workforce also has an influence on social inequality and trust in government. Secretaries earn on average four times less than senior managers (D1). This gap in compensation is most pronounced for Mexico, Chile and Australia as well as for Colombia where senior managers earn over eight times more than secretaries, and smallest in Greece, Norway, Finland, Iceland and the Netherlands, where senior managers earn less than three times and half what secretaries earn.
Data refer to 2015 and were collected through the 2016 OECD Survey on the Compensation of Employees in Central/Federal Governments. Officials from central ministries and agencies responded to the survey through the OECD Network on Public Employment and Management.
Data are for six central government ministries/departments (Interior, Finance, Justice, Education, Health and Environment or their equivalents). The classification and the definition of the occupations are an adaptation of the ISCO-08 codes developed by the International Labour Organization (ILO). Compensation levels are calculated by averaging the compensation of the staff in place.
Total compensation includes gross wages and salaries, and employers’ social contributions, both funded as well as unfunded. Social contributions are restricted to health and pensions systems, in order to have consistent data across countries.
Compensation was converted to USD using purchasing power parities (PPPs) for private consumption from the OECD National Accounts Statistics (database). Working time adjustment compensates for differences in time worked, taking into account both the average number of working hours and the average number of holidays.
Comparison to previous data collection results are limited due to small changes in methodology. See Annex D for further information on the methodology.
Further reading
OECD (2012), Public Sector Compensation in Times of Austerity, OECD, Paris.
Figure notes
Data are not available for the Czech Republic, Estonia, Hungary, Ireland, Israel, Japan, Latvia, Luxembourg, New Zealand, Poland, the Slovak Republic, Switzerland, Turkey and the United States.
Australia: Ministry of Interior is not included. Belgium: Ministries of Education and Environment are not included because they do not belong to the federal authority. France: data are for 2014 (using PPPs for 2014). Greece: secretaries may include other occupations fulfilled by professionals. Germany: data are based on estimations according to the pay scale and not on actual compensation. Iceland: Ministry of Justice belongs to the Ministry of Interior. Italy: number of employees includes part time employees and not only full time employees. Korea: data do not include fixed meal allowance and job grade allowance that are provided in all of these positions; compensation for unused annual leaves is also not included. The Netherlands: all employees of central government are included. Norway: employees not covered by the basic collective agreement for the civil service are not included. Sweden: there is no Ministry of Interior and therefore it is not included in the data.
Source: 2016 OECD Survey on Compensation of Employees in Central/Federal Governments; OECD STAN/National Accounts Statistics (database).
Source: 2016 OECD Survey on Compensation of Employees in Central/Federal Governments; OECD STAN/National Accounts Statistics (database).