Compensation of professionals in central government
Professionals, such as policy analysts, bring crucial skills to conduct evidence-based analysis required to develop effective policies and programmes that respond to citizens’ needs and expectations. The level of compensation for professional positions reflects how the public administration values and remunerates these skills. Some professionals have skill sets that are sought after by both the public and private sectors; therefore the level of compensation for these skills may be one indicator of a public administration’s ability to compete for talent. For the public administration, it is crucial to retain those employees in order to improve public policy making and service delivery. Differences in compensation levels among countries can result from various factors that are not controlled for here, such as differences in qualification requirements and gender representation in these professions, as well as differences in the location of workplaces.
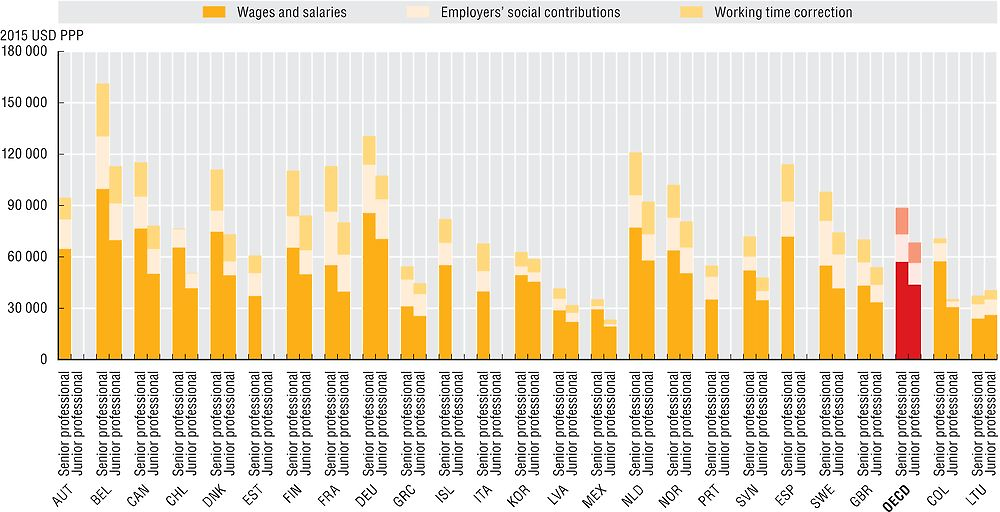
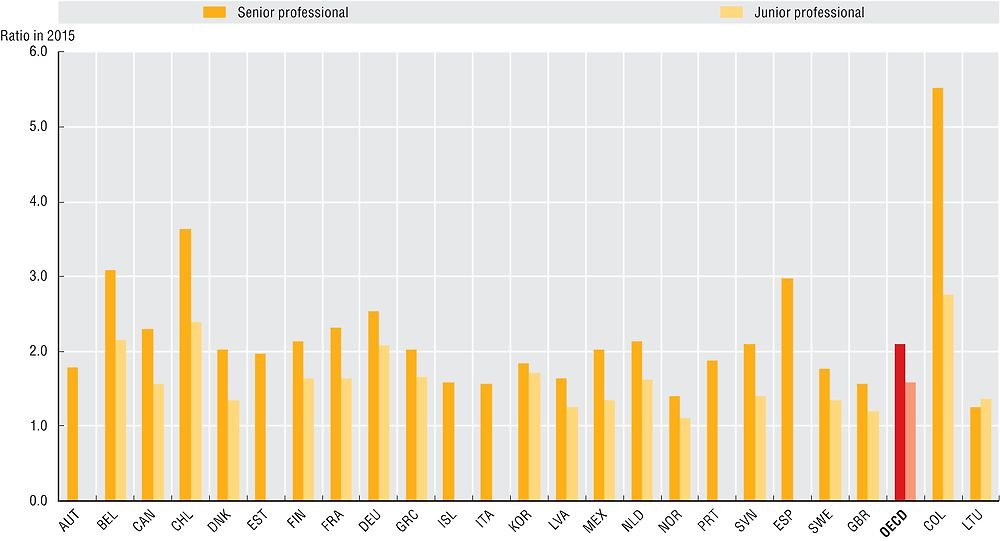
On average, senior professionals’ compensation amounts to USD 88 667 PPP across OECD countries, including USD 16 103 PPP employer’s contributions and USD 15 461 PPP for working time correction. Junior professionals’ compensation is USD 68 453 PPP. Hence, junior professionals earn on average 23% less than senior professionals. This difference accounts mainly for difference in seniority and experience. The compensation ratio between the two levels is highest in Chile, Denmark and Mexico, as well as in Colombia, and lowest in Korea.
D1 senior managers earn on average 2.6 times more than senior professionals. This suggests that the premium for managerial responsibilities is significantly higher than the premium on technical specialisation. The difference between D1 senior managers’ and senior professionals’ compensation is highest in Mexico, Italy and the United Kingdom and lowest in Slovenia, Iceland and the Netherlands. When corrected by GDP per capita, professionals in Chile and Colombia receive the highest compensation, while it is the lowest in Norway and Lithuania.
Data refer to 2015 and were collected through the 2016 OECD Survey on the Compensation of Employees in Central/Federal Governments. Officials from central ministries and agencies responded to the survey through the OECD Network on Public Employment and Management.
Data are for six central government Ministries/Departments (Interior, Finance, Justice, Education, Health and Environment or their equivalents). The classification and definition of the occupations are an adaptation of the ISCO-08 codes developed by the International Labour Organization (ILO). Compensation levels are calculated by averaging the compensation of the staff in place.
Total compensation includes gross wages and salaries, and employers’ social contributions, both funded as well as unfunded. Social contributions are restricted to health and pensions systems, in order to have consistent data across countries.
Compensation was converted to USD using purchasing power parities (PPPs) for private consumption from the OECD National Accounts Statistics (database). Working time adjustment compensates for differences in time worked, taking into account both the average number of working hours and the average number of holidays.
Comparison to previous data collection results are limited due to small changes in methodology. See Annex D for further information on the methodology.
Further reading
OECD (2012), Public Sector Compensation in Times of Austerity, OECD, Paris.
Figure notes
Data are not available for Australia, the Czech Republic, Hungary, Ireland, Israel, Japan, Luxembourg, New Zealand, Poland, the Slovak Republic, Switzerland, Turkey and the United States.
Senior and junior professionals are mixed for Austria, Estonia, Iceland, Italy, Portugal and Spain. Australia: Ministry of Interior is not included. Belgium: Ministries of Education and of Environment are not included because they do not belong to the federal authority. Estonia: data for the Ministry of Environment are not available. France: data are for 2014 (using PPPs for 2014). Germany: data are based on estimations according to the pay scale and not on actual compensation. Iceland: Ministry of Justice belongs to the Ministry of Interior. Italy: the number of employees includes part time employees and not only full time employees. Korea: data do not include fixed meal allowance and job grade allowance that are provided in all of these positions; compensation for unused annual leaves is also not included. The Netherlands: all employees of central government are included. Norway: employees not covered by the basic collective agreement for the civil service are not included. Sweden: there is no Ministry of Interior and therefore it is not included in the data.
Source: 2016 OECD Survey on Compensation of Employees in Central/Federal Governments; OECD STAN/National Accounts Statistics (database).
Source: 2016 OECD Survey on Compensation of Employees in Central/Federal Governments; OECD STAN/National Accounts Statistics (database).