Compensation of middle managers
Middle managers play a key role in the workforce hierarchy, translating the strategic vision of senior managers into actions implemented by the broader public workforce under their management. Hence, middle management has a direct impact on workplace climate, the effectiveness of public management systems and reforms, and ultimately, organisational capacity to deliver results to citizens.
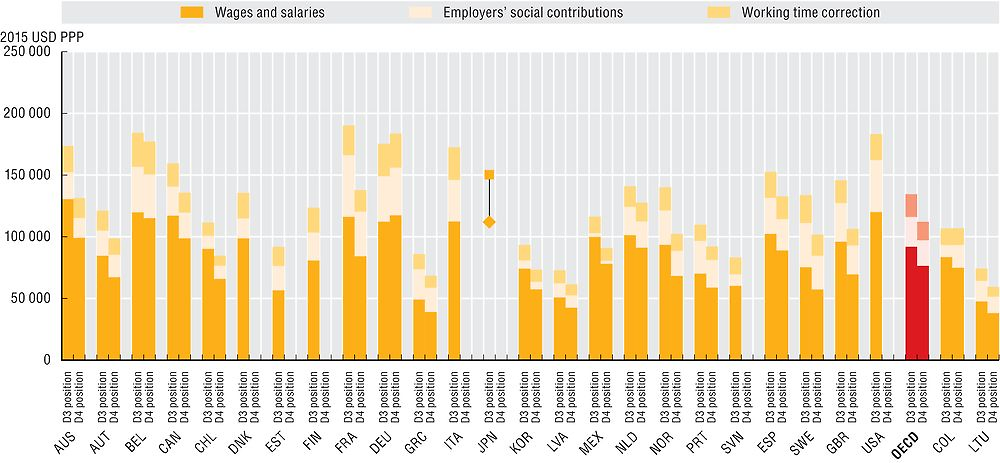
The amount and structure of middle managers’ compensation may be related to political and historical factors, as well as the process for determining base pay and increases. For example, some countries set base pay through government decree, based on calculations related to economic and labour market developments (e.g. inflation) while, in other countries, base pay for middle managers is negotiated through collective bargaining with unions. Countries also differ in their political consensus on how to fund the social security system and the types of benefits to provide. In some countries, the amount of social contributions paid may be larger, while in other countries the number of holidays is higher. Sweden, France and Greece have the highest share of employers’ social contributions in total compensation. The share is lowest in Korea, Chile and Mexico.
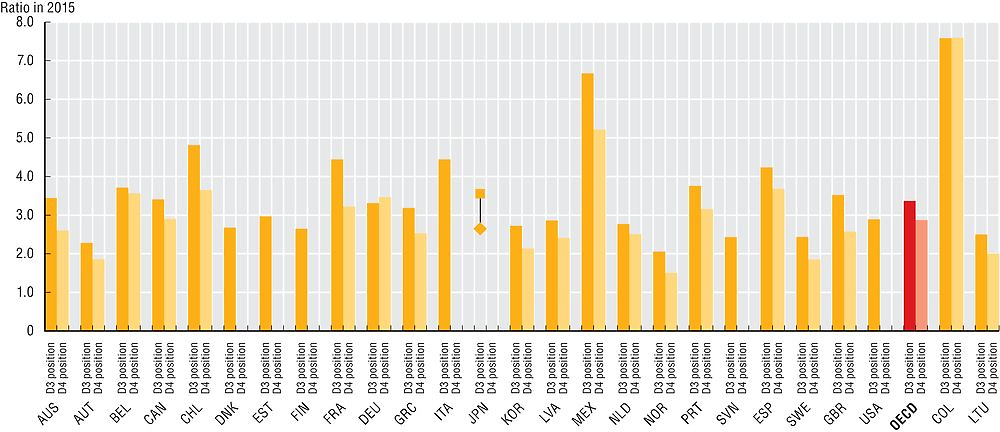
In OECD countries, D3 level middle managers’ compensation amounts on average to USD 134 522 PPP, including USD 24 209 PPP employer’s contributions and USD 18 416 PPP for working time correction. D4 middle managers’ total compensation reaches USD 112 114 PPP. Cross-country differences are smaller for middle managers’ compensation than for senior managers’ compensation. At the same time, D3 managers earn on average 20% more than D4 managers, hence the difference in compensation between middle managers is smaller than the difference between the two senior positions (D1 senior managers earn 27% more than D2 senior managers). There is a large gap between senior managers’ compensation and middle managers’ compensation. Senior managers in D1 positions earn 72% more than middle managers in D3 positions, and more than twice as much as managers in D4 positions. The difference between compensation levels for D1 and D4 positions is highest in Australia, Chile, Canada and the United Kingdom.
Correcting by GDP per capita makes is possible to take into account heterogeneous levels of development and average income across countries. Middle managers in Mexico as well as Colombia receive the highest compensation corrected for GDP per capita, while in Norway middle managers earn the least.
Data refer to 2015 and were collected through the 2016 OECD Survey on the Compensation of Employees in Central/Federal Governments. Officials from central ministries and agencies responded through the OECD Network on Public Employment and Management.
Data are for six central government ministries/departments (Interior, Finance, Justice, Education, Health and Environment or their equivalents). The classification and definition of the occupations are an adaptation of the ISCO-08 codes developed by the International Labour Organization (ILO). Compensation levels are calculated by averaging the compensation of the staff in place.
Total compensation includes gross wages and salaries, and employers’ social contributions, both funded as well as unfunded. Social contributions are restricted to health and pensions systems, in order to have consistent data across countries.
Compensation was converted to USD using purchasing power parities (PPPs) for private consumption from the OECD National Accounts Statistics (database). The data are not adjusted for hours worked per week, since managers are formally or informally expected to work longer hours but adjusted for the average number of holidays.
Comparison to previous data collection results are limited due to small changes in methodology. See Annex D for further information on the methodology.
Further reading
OECD (2016), Engaging Public Employees for a High-Performing Civil Service, OECD Public Governance Reviews, OECD, Paris.
OECD (2012), Public Sector Compensation in Times of Austerity, OECD, Paris. https://doi.org/10.1787/9789264177758-en
Figure notes
Data are not available for the Czech Republic, Hungary, Ireland, Iceland, Israel, Luxembourg, New Zealand, Poland, the Slovak Republic, Switzerland and Turkey.
Compensation data for D4 positions are mixed with D3 in Estonia, Finland, Italy and Slovenia. Australia: data for the Ministry of Interior are not included. Belgium: data for the Ministry of Education and Environment are not included because they do not belong to the federal authority. Estonia: data for the Ministry of Environment are not available. France: data are for 2014 (using PPPs for 2014). Germany: data are based on estimations according to the pay scale and not on actual compensation. Iceland: Ministry of Justice belongs to Ministry of Interior. Japan: data for D3 positions are provided in terms of entry and maximum level of total compensation, the arithmetic mean has been taken into account for the inclusion in the OECD average. Korea: data do not include fixed meal allowance and job grade allowance that are provided in all of these positions; compensation for unused annual leaves is also not included. The Netherlands: all employees of central government are included. Norway: employees not covered by the basic collective agreement for the civil service are not included. Sweden: there is no Ministry of Interior and therefore it is not included in the data.
Source: 2016 OECD Survey on Compensation of Employees in Central/Federal Governments; OECD STAN/National Accounts Statistics (database).
Source: 2016 OECD Survey on Compensation of Employees in Central/Federal Governments; OECD STAN/National Accounts Statistics (database).