Compensation of senior managers
Senior managers in central public administrations are expected to be politically responsive, have a deep understanding of the citizens they serve, and be effective managers capable of steering healthy and high-performing public sector organisations. Their compensation is an indicator of the degree of value placed on these positions, and impacts the attraction and retention of highly skilled individuals, along with intrinsic motivation related to the nature of the work.
Various factors may account for differences in compensation levels across countries for highly similar positions. For instance, compensation may differ depending on differences in the structure of national labour markets to compete for talent with the private sector. The internal labour market may also be a factor as compensation levels can motivate high-potential candidates to apply for jobs of increasing seniority. At the same time, governments try to balance the need to maintain internal wage equilibrium and sense of fairness. The composition of the workforce may also impact compensation levels, depending on, for example, the length of service of senior officials or the share of women (who generally earn less than their male counterparts) in senior management occupations.
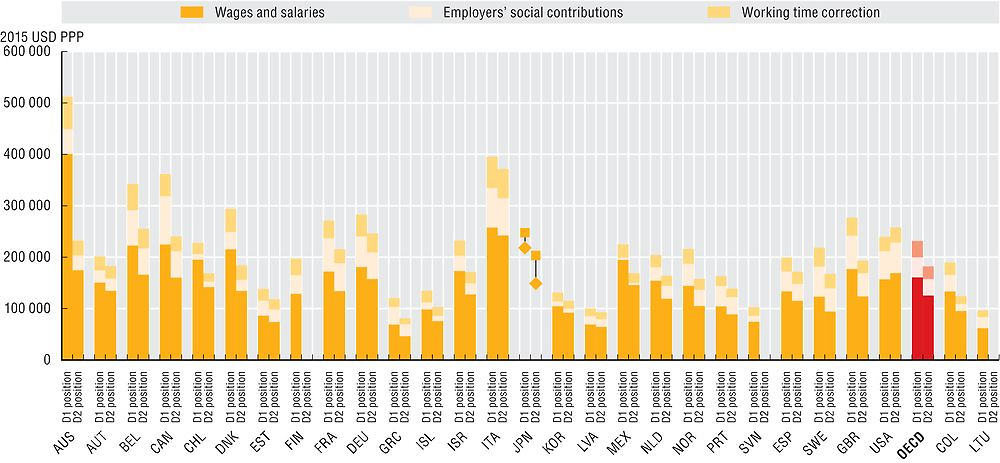
The 2016 OECD Survey on the Compensation of Employees in Central/Federal Governments defines precise occupational categories in order to compare similar occupations and considers compensation levels including gross wages and salaries but also contributions to social security plans. D1 managers are top public servants below the minister or secretary of state, and D2 are senior managers just below D1 positions. On average, D1 level senior managers’ compensation amounts to USD 231 546 PPP in OECD countries. In addition to wages and salaries, compensation consists of employer’s social contributions (17% of compensation; USD 39 281 PPP) and a working time correction (14% of compensation; USD 31 638 PPP). D2 level managers’ average total compensation is about USD 182 246 PPP across OECD countries. On average, D1 managers earn 27% more than D2 managers. However, in the United States, D1 senior managers earn less than D2 managers, most likely due to the fact that many D1 managers are politically appointed and thus may be younger or have less experience in the public administration than D2 managers.
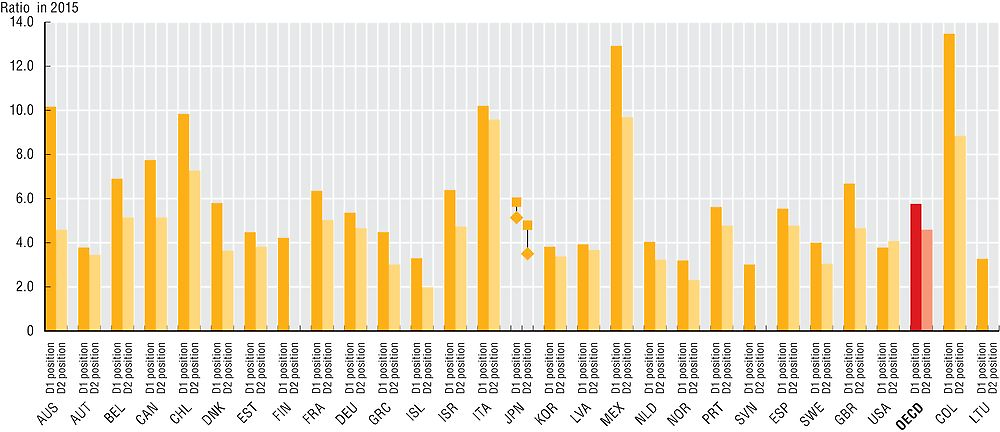
Senior managers earn most in Australia and Italy, and least in Latvia, Slovenia, Greece and Korea. When corrected by GDP per capita to account for differences in the economic development of countries, D1 senior managers in Mexico as well as Colombia receive the highest compensation, while in Iceland and Norway, senior managers earn the least.
Data refer to 2015 and were collected through the 2016 OECD Survey on the Compensation of Employees in Central/Federal Governments. Officials from central ministries and agencies responded through the OECD Network on Public Employment and Management.
Data are for six central government ministries/departments (Interior, Finance, Justice, Education, Health and Environment or their equivalents). The classification and definition of the occupations are an adaptation of the ISCO-08 codes developed by the International Labour Organization (ILO). Compensation levels are calculated by averaging the compensation of the staff in place.
Total compensation includes wages and salaries, and employers’ social contributions, both funded as well as unfunded. Social contributions are restricted to health and pensions systems in order to present consistent data across countries.
Compensation was converted to USD using purchasing power parities (PPPs) for private consumption from the OECD National Accounts Statistics (database). The data are not adjusted for hours worked per week, since managers are formally or informally expected to work longer hours, but adjusted for the average number of holidays.
Comparison to previous data collection results are limited due to small changes in methodology. See Annex D for further information on the methodology.
Further reading
OECD (2016), Engaging Public Employees for a High-Performing Civil Service, OECD Public Governance Reviews, OECD, Paris.
OECD (2012), Public Sector Compensation in Times of Austerity, OECD, Paris.
Figure notes
Data are not available for the Czech Republic, Hungary, Ireland, Luxembourg, New Zealand, Poland, the Slovak Republic, Switzerland and Turkey.
Compensation data for D2 positions are mixed with D1 positions in Finland and Slovenia and missing for Lithuania. Australia: Ministry of Interior is not included. Belgium: Ministries of Education and Environment are not included because they do not belong to the federal authority. Estonia: data for the Ministry of Environment are not available. France: data are for 2014 (using PPPs for 2014). Germany: data are based on estimations according to the pay scale and not on actual compensation. Iceland: Ministry of Justice belongs to the Ministry of Interior. Japan: data are provided in terms of entry and maximum level of total compensation, the arithmetic mean has been taken into account for the inclusion in the OECD average. Korea: data do not include fixed meal allowance and job grade allowance that are provided in all of these positions; compensation for unused annual leaves is also not included.The Netherlands: all employees of central government are included. Norway: employees not covered by the basic collective agreement for the civil service are not included. Sweden: there is no Ministry of Interior and therefore it is not included in the data.
Source: 2016 OECD Survey on Compensation of Employees in Central/Federal Governments; OECD STAN/National Accounts Statistics (database).
Source: 2016 OECD Survey on Compensation of Employees in Central/Federal Governments; OECD STAN/National Accounts Statistics (database).