Women in politics
Cabinets and parliaments are at the centre of public and political life. Achieving gender equality there is a crucial first step to ensure that public policies and budgets reflect perspectives and interests of both women and men. In adopting the UN Sustainable Development Goals (SDGs), countries have committed to achieve gender equality in political leadership. Yet, increases in women’s political representation have been small over the past 15 years, women are still under-represented among government ministers and hardly fill one-third of parliamentary seats in lower houses across OECD legislatures on average. Enhancing women’s full participation in political leadership requires a comprehensive and co-ordinated policy response beyond measures targeting women as underrepresented groups in politics. Increasing gender-responsiveness of legislatures and public administrations as workplaces as well as establishing sound accountability and monitoring mechanisms are essential steps to sustain progress in gender equality.
On average, 29% of the seats in lower/single house legislatures were filled by women in 2017, which is a minor increase of 1% compared to 2015. Women’s representation in legislatures ranged from over 47% in Iceland to less than 10% in Japan. None of the OECD countries has reached gender parity in legislatures and only 17 of them reached or exceeded 30% of women’s representation. Out of 18 OECD countries that had parliamentary elections since 2015, 13 countries saw increases in women’s representation (4% on average), with gains of around 6 p.p. in Estonia, Iceland and Ireland. In Spain and Greece, women’s representation in parliaments slightly shrunk since the last parliamentary elections by 2 p.p. and 5 p.p. respectively. A majority of OECD countries have put in place some form of political quota for women, although they vary in type and extent, e.g. legal candidate quotas or voluntary political party quotas. In 2017, 10 OECD countries operated with legislated quotas in their single/lower houses of parliament. Between 2015 and 2017, there was no change in the number of countries with legislated quotas, but Mexico increased the minimum requirement of 40%-60% representation of either sex in parliament to gender parity (OECD, 2017). Since the parity requirement came into force in 2014, women’s representation in the Mexican parliament has increased by 5% in comparison to the 2012 election.
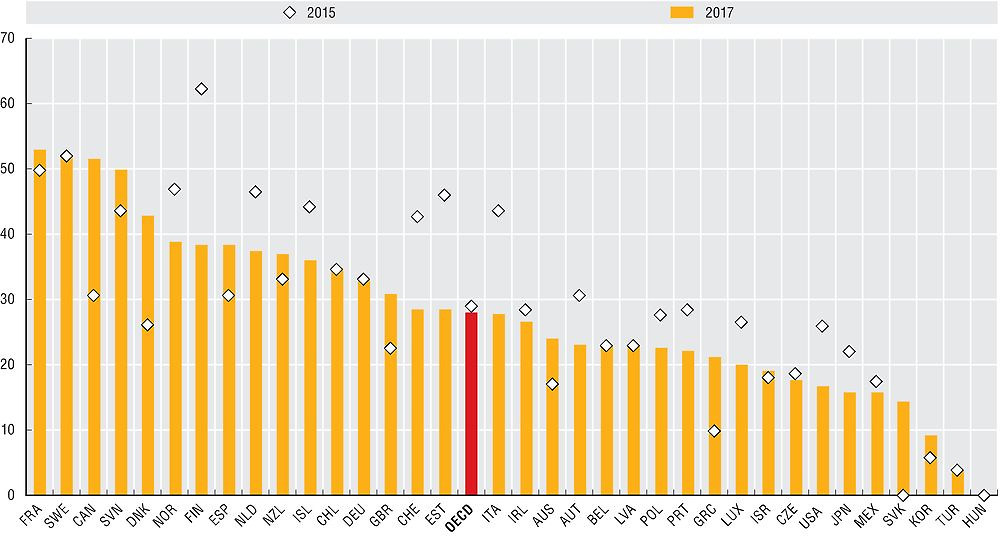
In 2017, in OECD countries on average 28% of central/federal governments ministerial positions were filled by women, a drop of 1.3% percentage points since 2015. There are significant variations across countries: while France, Sweden, Canada and Slovenia have reached gender parity in 2017 in cabinet posts, women were not part of cabinets in Hungary and occupy only 1 out of 26 seats in Turkey. On average, women account for one-third of cabinet posts in 14 countries across the OECD. Between 2015 and 2017, the share in women’s representation in cabinet posts fell by more than 15 p.p. in Estonia, Finland and Italy, while the number of women ministers at the federal level increased strongly in Canada and Denmark. To date, no OECD country has legislated quotas for executive appointments.
Data for women parliamentarians refer to lower/single houses of parliament and were obtained from the Inter-Parliamentary Union’s PARLINE database. Data refer to the share of women parliamentarians recorded as of 1 January 2017 and 1 December 2015. Countries in light green represent lower/single house parliaments with legislated candidate quotas as of January 2017. Legislative quotas are enshrined in the election law, political party law or other comparable law of a country. By definition, quotas based on election and political party laws are based on legal provisions, obliging all political entities participating in elections to apply them equally. Data on quotas were obtained from the Institute for Democracy and Electoral Assistance (IDEA) Global Database of Quotas for Women.
Data on women ministers in national government were obtained from the Inter-Parliamentary Union and UN Women’s “Women in Politics” database. Data represent the percentage of appointed women ministers as of 1 January 2017 and 1 January 2015. Data show women as a share of total ministers, including deputy prime ministers and ministers. Prime ministers/heads of government were also included when they held ministerial portfolios. Vice-presidents and heads of governmental or public agencies have not been included in the total.
Further reading
OECD (2014), Women, Government and Policy Making in OECD Countries: Fostering Diversity for Inclusive Growth, OECD, Paris, https://doi.org/10.1787/9789264210745-en.
OECD (2016), 2015 OECD Recommendation of the Council on Gender Equality in Public Life, OECD, Paris. https://doi.org/10.1787/9789264252820-en.
OECD (2017), Building an Inclusive Mexico: Policies and Good Governance for Gender Equality, OECD, Paris. https://doi.org/10.1787/9789264265493-en
Figure notes
3.12: Bars in light green represent countries with lower or single house parliaments with legislated candidate quotas as of as of March 2017.
3.13: Data for Iceland for 2017 is provided by the Government of Iceland.
Information on data for Israel: https://doi.org/10.1787/888932315602.
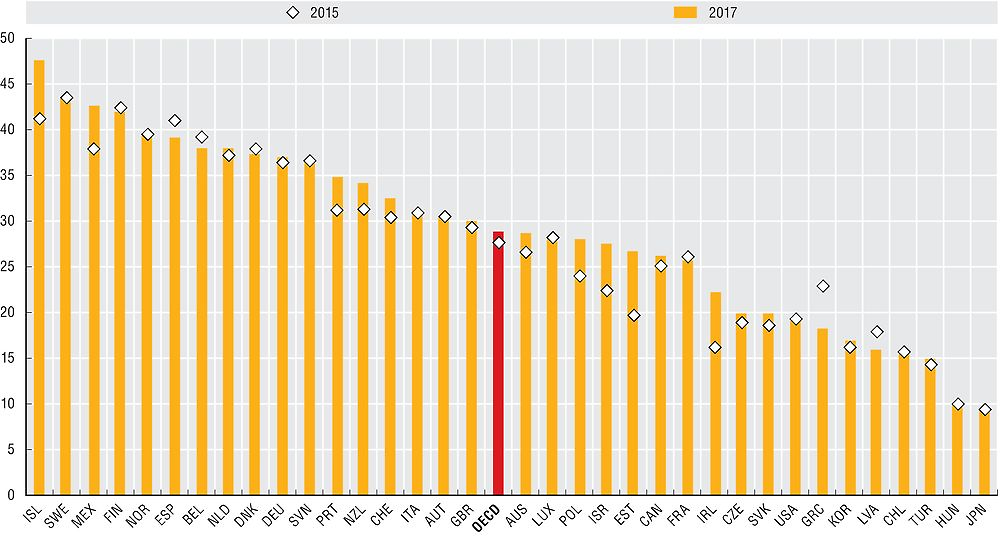
Source: Inter-Parliamentary Union (IPU) PARLINE (database), and IDEA Global Database of Quotas for Women.
Source: Inter-Parliamentary Union (IPU) and UN Women “Women in Politics”, 2015 and 2017.