Employment in general government
Governments across the OECD perform a wide range of functions, all of which depend on a dedicated and skilled public sector workforce. The large differences in the relative sizes of public sector employment across the OECD reflect the equally large variety of activities undertaken by governments and the ways they deliver public services. Services can be delivered in large part by government employees or through a range of partnerships with the private or not-for-profit sectors. In some countries, the large majority of health care providers, teachers and emergency workers, for example, are directly employed by the government. In other countries, alternative delivery mechanisms mean that many of these professionals are employed by organisations that are not state-owned, or by private contractors. The use of outsourcing, the relative size and structure of the voluntary, charitable and/or not-for-profit sectors and the availability of private sector providers all determine their use of public sector employment.
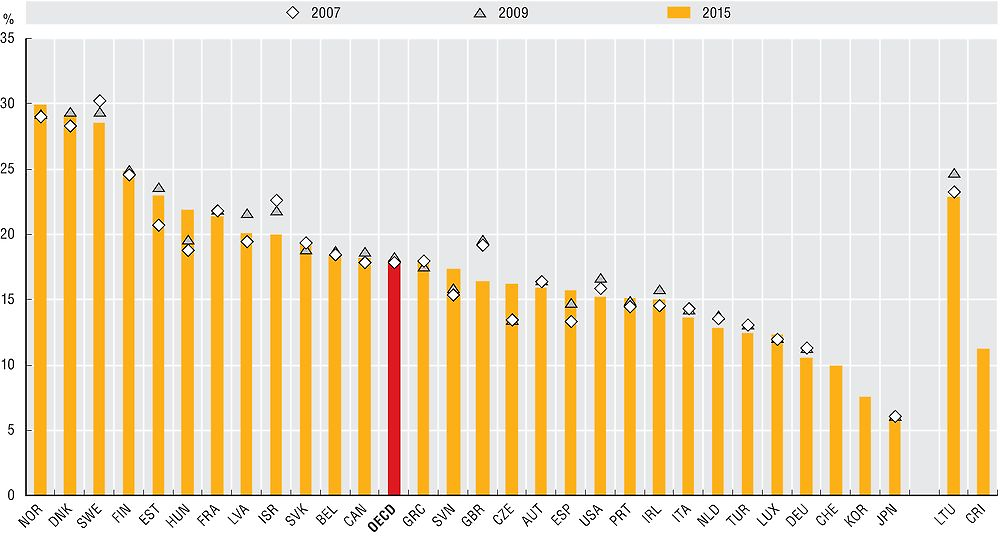
The size of general government employment varies significantly among OECD countries. Nordic countries as Denmark, Norway and Sweden report the highest general government employment levels, reaching near 30% of total employment. On the other hand, OECD countries from the Asian region rely less on public sector employees. Only around 6% of Japan’s total employment is made up of general government employment, while Korea counts 7.6%.
Although many OECD countries report sizeable reductions in central government employment as a result of austerity measures implemented in the wake of the 2008 financial crisis, general government employment as a percentage of total employment across OECD countries has remained relatively stable, rising slightly between 2007 and 2015, from 17.9% to 18.1%. This average hides some variation among OECD countries. In Israel and the United Kingdom, general government employment as a share of total employment decreased the most between 2007 and 2015 (over 2.5 p.p.). In contrast, the Czech Republic, Estonia, Hungary, Slovenia and Spain experienced increases equal to and over 2 p. p. during the same period (for Spain such increment in the ratio was largely due to the decrease of total employment).
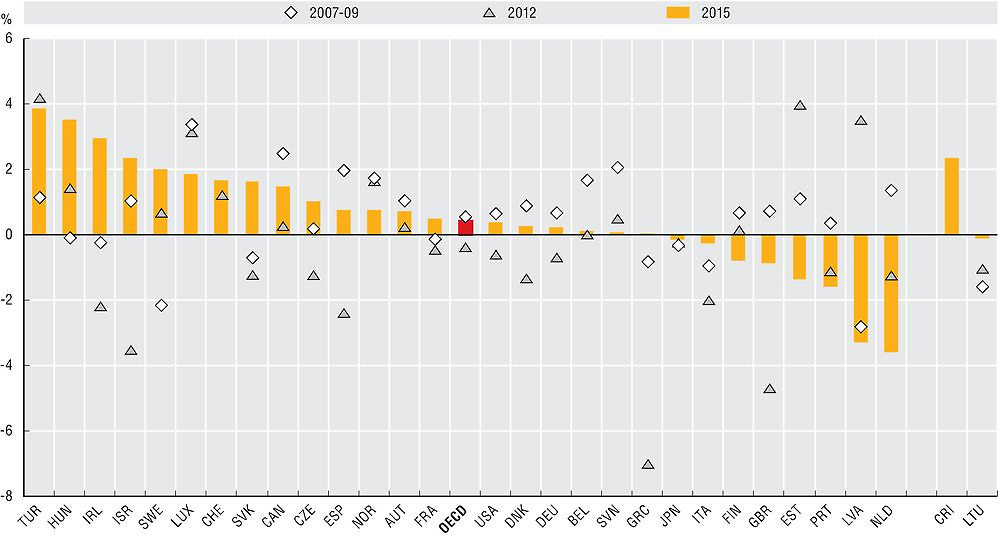
Looking at the annual growth rate of general government employment, the OECD average also remains relatively stable, showing 0.6% growth from 2007-09, a 0.4% decrease in 2011-12 and returning to slight growth between 2014-15. In fact, on average the effect of the reduction of government employment in response to the crisis could be observed in 2012, thus having been delayed compared to its financial impact. Many countries follow a similar pattern with general government employment growth stifled during the 2011-12 period due to austerity measures, and some recovery by 2014-15. However, a look at individual countries paints a more dynamic picture. For example, Turkey displays the highest growth from 2014-15 at 3.9%, while the Netherlands displays the highest reductions of above 3.6% over the same period. The reason this is not noticed in the first chart is likely because general government employment has changed, in these countries, at rates similar to total employment. The most extreme rates are displayed in the 2011-12 period, when some countries were at the height of austerity reductions, such as Greece, which saw reductions in general government employment by 7% and the United Kingdom which reduced by 4.7%.
Data are derived from the OECD National Accounts Statistics (database), which are based on the System of National Accounts (SNA), a set of internationally agreed concepts, definitions, classifications and rules for national accounting. General government employment covers employment in all levels of government (central, state, local and social security funds) and includes core ministries, agencies, departments and non-profit institutions that are controlled by public authorities. Data represents the total number of persons employed directly by those institutions.
Total employment covers all persons engaged in productive activity that falls within the production boundary of the national accounts. The employed comprise all individuals who, during a specified brief period, were in the following categories: paid employment or self-employment.
Compared to the previous edition of Government at a Glance, data for this indicator are now drawn from the SNA framework and refer to general government employment whereas before data were collected by the International Labour Organisation (ILO) and refer to the public sector employment (i.e. general government plus public corporations).
Further reading
OECD (2016), Engaging Public Employees for a High-Performing Civil Service, OECD Public Governance Reviews, OECD Publishing, Paris.
Figure notes
Total employment refers to the domestic employment. Data for Australia, Chile, Iceland, Mexico, New Zealand and Poland are not available. Data for Korea and Switzerland are not included in the OECD average due to missing time - series. Data for Luxembourg before 2010 are based on estimates. Data for Canada for 2015 are based on estimates. Data for Portugal, Switzerland and Costa Rica are for 2014 rather than 2015. Data for the United States are for 2008 rather than 2007.
3.2: Data for 2007-09 refer to the annual average growth rate.
Source: OECD National Accounts Statistics (database). Data for Japan, Switzerland, Turkey and the United States are from the International Labour Organization (ILO), ILOSTAT (database), Public employment by sectors and sub-sectors of national accounts. Data for Korea provided by national authorities.
Source: OECD National Accounts Statistics (database). Data for Japan, Switzerland, Turkey and the United States are from the International Labour Organization (ILO), ILOSTAT (database), Public employment by sectors and sub-sectors of national accounts.