Government investment spending
Public expenditures have different time horizons, which makes distinguishing consumption from investment spending relevant, given that additions to the stock of physical capital, through expenditures in transportation infrastructure for instance, are key to long-term economic growth and productivity. This has been reflected in recent calls for increases in public investment spending as a way to improve slacking productivity.
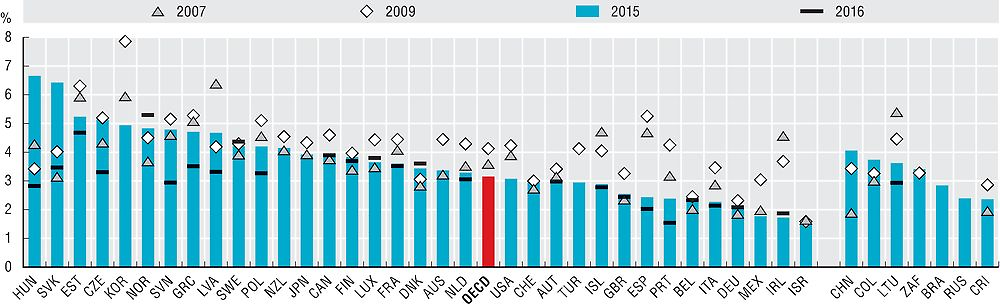
In 2015, average government investment spending across OECD countries amounted to 3.2% of GDP, decreasing from 4.1% in 2009 and lower than its level of 3.6% in 2007. The country with the largest government investment spending in 2015 was Hungary with 6.7%, followed by the Slovak Republic (6.4%) Estonia (5.2%) and the Czech Republic (5.1%); all Eastern European countries that receive significant EU structural funds to finance investment. The lowest investment spending levels in 2015 were registered in Israel (1.5%), Ireland (1.7%) and Mexico (1.8%).
Between 2007 and 2015, the largest increases in government investment as a share of GDP were in the Slovak Republic with +3.3 p.p. and Hungary with +2.4 p.p., even though public investment for both the Slovak Republic and Hungary decreased in 2016. Meanwhile, the largest decreases in government investment during the same period were in Ireland (-2.8 p.p.) and Spain (-2.3 p.p.). Over this period, other major economies such as China increased public investment from 1.9% to 4.1%.
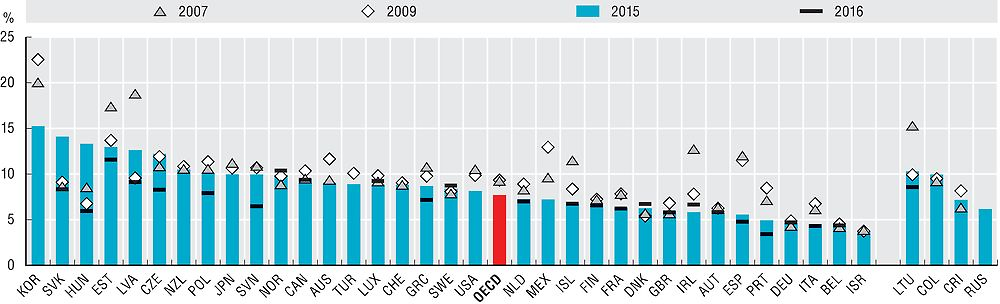
In terms of total expenditures, government investment represented on average 7.7% of all spending across OECD countries in 2015, decreasing from 9.3% registered both in 2007 and 2009. Throughout this period, the share of investment spending has been the largest in Korea, reaching 15.2% in 2015, albeit decreasing from 22.5% in 2009 (and 20% in 2007), 54.5% of which is allocated in economic affairs and defence. The lowest share of investment spending in 2015 was in Israel (3.8%) and Belgium (4.4%).
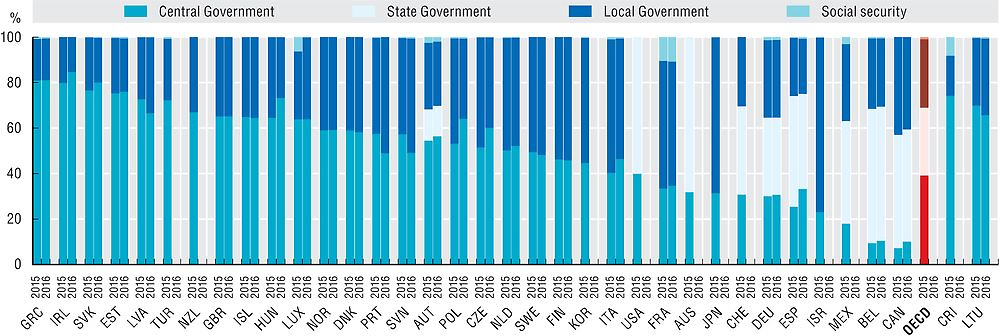
The distribution of investment spending across levels of government follows, to a great extent, the political and administrative structure. Across all OECD countries, around 40% of investment spending is carried out by central governments, while about 60% was carried out by sub-central governments – as many public goods have a local rather than a central reach. Investment by the central government ranges from 81% of total public investment in Greece to 7.2% in Canada. However, the federal countries of Canada and Belgium allocated around 90% of their public investment spending to sub-central governments.
Public investment in 2015 was allocated mostly in the function of economic affairs, such as transportation and energy, with a share of 34.6% on average across OECD countries, followed by defence (15.2%), education (14.7%), general public services (9.3%), health care (8.4%), and in a smaller degree to housing (5.1%), environmental protection (4.5%), public order and safety (3.5%) and social protection (1.6%).
Data are derived from the OECD National Accounts Statistics (database), which are based on the System of National Accounts (SNA), a set of internationally agreed concepts, definitions, classifications and rules for national accounting. The updated 2008 SNA framework has been now implemented by all OECD countries (see Annex A for details on reporting systems and sources). General government investment includes gross capital formation and acquisitions, less disposals of non-produced nonfinancial assets. Gross fixed capital formation (also named as fixed investment) is the main component of investment consisting for government, mainly of transport infrastructure but also including infrastructure such as office buildings, housing, schools, hospitals, etc. Moreover, with the SNA 2008 framework expenditures in research and development have been also included in fixed investment. Government investments together with capital transfers constitute the category of government capital expenditures. Government consists of central, state and local governments and social security funds. State government is only applicable to the nine OECD countries that are federal states: Australia, Austria, Belgium, Canada, Germany, Mexico, Spain (considered a quasi-federal country), Switzerland and the United States. Figures 2.51, Government investment as a share of total investment, 2007, 2009 and 2015 and 2.52, Structure of general government investment by function, are available online in Annex F.
Further readings
OECD (2014), Recommendation of the Council on Effective Public Investment across levels of government, OECD, Paris www.oecd.org/regional/regional-policy/Principles-Public-Investment.pdf.
OECD (2015), National Accounts at a Glance 2015, OECD, Paris,https://doi.org/10.1787/na_glance-2015-en
Figure notes
Data for Chile are not available. Data for Turkey and are not included in the OECD average because of missing time series.
Data for Costa Rica are for 2014 rather than 2015.
2.48: Data for Brazil, China, Russia and South Africa are for 2014 rather than 2015.
2.49: Data for Russia are for 2014 rather than 2015.
2.50: Local government is included in state government for Australia and the United States. Australia does not operate government social insurance schemes. Social security funds are included in central government in Ireland, New Zealand, Norway, the United Kingdom and the United States.
Information on data for Israel: https://doi.org/10.1787/888932315602.
Source: OECD National Accounts Statistics (database).
Source: OECD National Accounts Statistics (database).
Source: OECD National Accounts Statistics (database).