General government revenues
Government revenues finance the goods and services provided by government and allow the state to carry out its redistributive role, as the two main sources of revenues are taxes and social contributions. Based on historical and current policy choices, as well as fluctuations from business cycles, there are major differences between countries in how and to what extent their governments fulfil these two fundamental functions and, as a result, the amount of government revenues they raise is also very different.
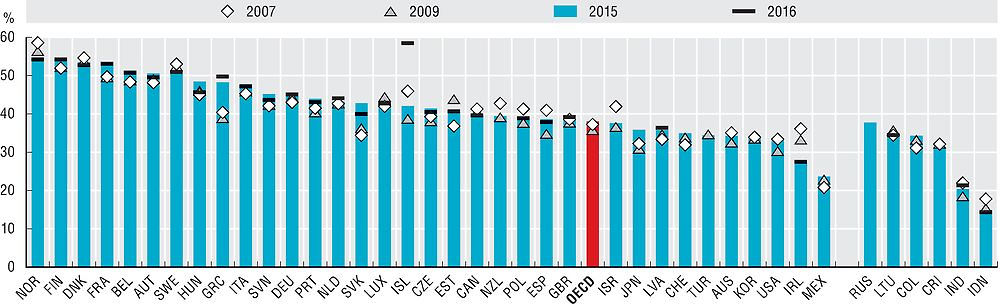
Across OECD countries, with a few exceptions, general government revenues as a share of GDP have recovered to levels experienced before the financial crisis: on average, revenues were 37.3% of GDP in 2007, decreased to 35.8% in 2009, and rose to 38.1% in 2015. Government revenues represent at least half of GDP for seven of the thirty-four OECD countries in 2015: Norway (54.8%), Finland (54.2%), Denmark (53.5%), France (53.4%), Belgium (51.4%), Austria (51.6%) and Sweden (50.5%), while only two countries have fiscal revenues lower than one-third of total yearly national income: Ireland (27.6%) and Mexico (23.7%). Greece’s revenues have increased beyond pre-crisis levels, going from 40.4% in 2007 to 48.3% in 2015; however, the revenue level also involves the large decrease in GDP that followed from the crisis, as nominal GDP in Greece in 2015 was 76% of the country’s own 2007 GDP. For the same period, among OECD accession countries Colombia had increased fiscal revenues the most over the period 2007-15, from 31.1% of GDP to 34.1%, as oil revenues, tax enforcement and consecutive reforms yielded higher revenues.
Between 2015 and 2016, among countries for which data are available, the largest increases in revenues occurred in Iceland where government revenues as share of GDP increased from 42.2% to 58.4%, due to extraordinary revenues from the stability contribution from estates of fallen banks, whereas revenues as a share of GDP decreased the most in the Slovak Republic (-2.9 p.p.) and Hungary (-2.9 p.p.), as both countries have been slow in spending EU funds due to the start of a new programming period.
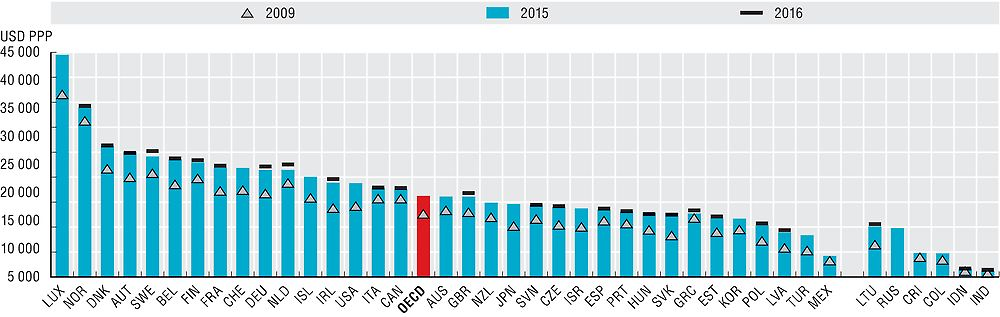
Government revenues per capita have fared similarly to general revenues, increasing evenly across OECD countries as the crisis waned. On average, revenues per capita increased from 2009 to USD 16 094 PPP in 2015. The countries with the largest revenues per capita retain their position since 2009: Luxembourg (USD 44 485 PPP), Norway (USD 33 977 PPP) and Denmark (USD 26 203 PPP). In the case of Luxembourg this could be explained by the tax contribution of cross-borders workers who are not counted as residents, whereas in the case of Norway this is due to the impact of oil revenues. On the other end, in Latvia, Mexico and Turkey revenues per capita are lower than USD 10 000 PPP.
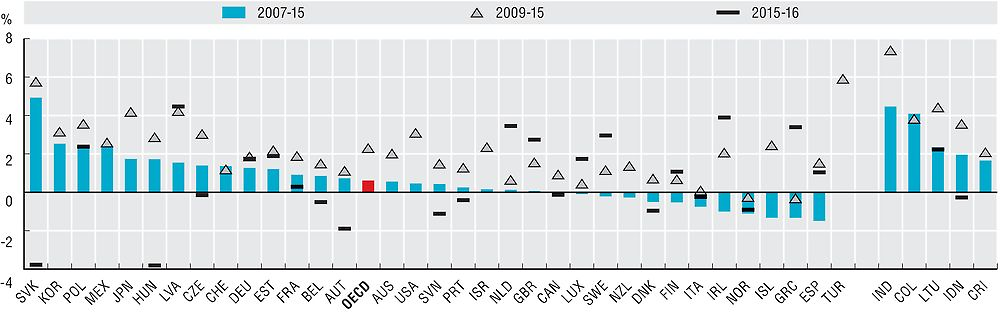
Between 2007 and 2015, the annual average growth rate of real government revenues per capita was 0.6% on average across the OECD countries, but 2.3% over the period 2009-15. The countries where real per capita revenues increased the most during this period were Turkey (+5.9%), the Slovakia Republic (+5.8%), Japan and Latvia (both +4.2%). In contrast, the average rate of growth of real per capita revenues was negative for the period 2009-15 for Greece (-0.3%) and Norway (-0.2%).
Revenues data are derived from the OECD National Accounts Statistics (database), which are based on the System of National Accounts (SNA), a set of internationally agreed concepts, definitions, classifications and rules for national accounting. The updated 2008 SNA framework has been now implemented by all OECD countries (see Annex A for details on reporting systems and sources). Using SNA terminology, general government consists of central government, state government, local government and social security funds. Revenues encompass taxes, net social contributions, and grants and other revenues. Gross domestic product (GDP) is the standard measure of the value of goods and services produced by a country during a period. Government revenues per capita were calculated by converting total revenues to USD using the OECD/Eurostat purchasing power parities (PPP) for GDP and dividing them by population. For the countries whose data source is the IMF Economic Outlook an implied PPP conversion rate was used. PPP is the number of units of country B’s currency needed to purchase the same quantity of goods and services in country A.
Further readings
OECD (2015), National Accounts at a Glance 2015, OECD, Paris, https://doi.org/10.1787/na_glance-2015-en
OECD (2016), OECD Factbook 2015-2016: Economic, Environmental and Social Statistics, OECD, Paris, https://doi.org/10.1787/factbook-2015-en
Statistics, Iceland (2017), “General government finances 2016”, Statistics Iceland, Reykjavik, http://www.statice.is/publications/publication-detail?id=57984
Figure notes
Data for Chile are not available.
Data for Turkey are not included in the OECD average because of missing time series.
Data for Costa Rica and Russia are for 2014 rather than 2015.
Information on data for Israel: https://doi.org/10.1787/888932315602.
Source: OECD National Accounts Statistics (database). Data for the other major economies of India and Indonesia are from the IMF Economic Outlook (April 2017).
Source: OECD National Accounts Statistics (database). Data for the other major economies of India and Indonesia are from the IMF Economic Outlook (April 2017).
Source: OECD National Accounts Statistics (database). Data for the other major economies of India and Indonesia are from the IMF Economic Outlook (April 2017).