Fiscal balance and debt by level of government
Most countries have multiple jurisdictions that jointly determine the overall fiscal balance. Depending on the degree of fiscal decentralisation of both government expenditures and revenues, the fiscal balance of different levels of government need not be the same, even though they all add up to the overall fiscal balance. This can introduce volatility to government liabilities; for instance, if expenditures exceed revenues at the local level for many municipalities, which in turn finance the deficit by issuing additional debt, overall debt levels can rise quickly as more municipalities respond in the same way. For this reason, sub-central governments operate often with more binding debt constraints than central governments.
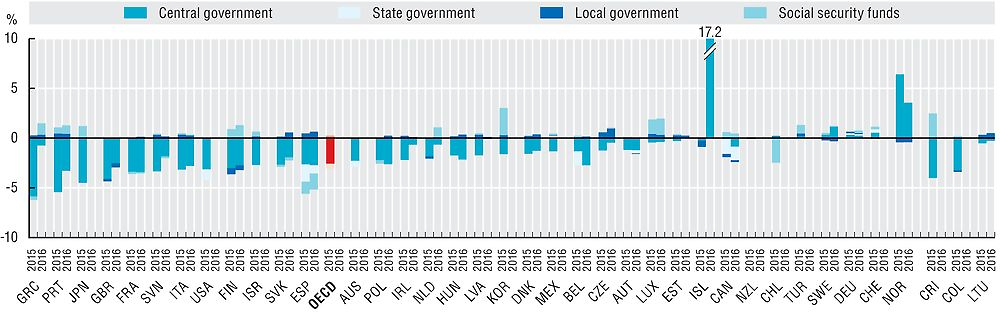
A decomposition of the fiscal balance by levels of government shows how national fiscal decentralisation relates to the overall fiscal balance. Across OECD countries, central governments had an average fiscal deficit of 2.6% of GDP in 2015, while sub-central governments recorded a deficit of 0.5% in the same year. Central governments balances ranged from a Greece’s deficit of 5.9% to a Norway’s surplus of 6.4%. Among OECD federal countries, Austria, Germany, Mexico and Switzerland ran surpluses of state governments of 0.07%, 0.15%, 0.23% and 0.34% respectively as a share of GDP in 2015. The largest deficit among state governments in 2015 was in Spain, reaching 1.7% of GDP, followed by Canada with 1.6% and Belgium with 1.4%. At the local level, all surpluses and deficits remained between 0.5% surplus and -0.6% deficit across OECD countries, as restrictions for accumulating debt at the local level are often binding.
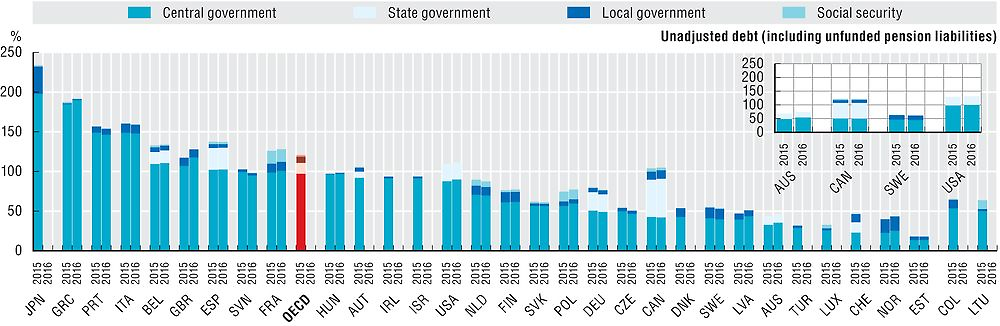
On average in 2015, central governments in OECD countries held 97.1% gross debt as a share of GDP, while sub-central governments recorded a gross debt of 21.5% of GDP. The countries with the largest central government gross debt levels are also the countries with the largest overall general government debt levels: Japan (197.8%) and Greece (184%). At the sub-central level, the largest state government debts in 2015 were in Canada (47%) and in Spain (27%), while the largest local government gross debt levels were in Japan (34%).
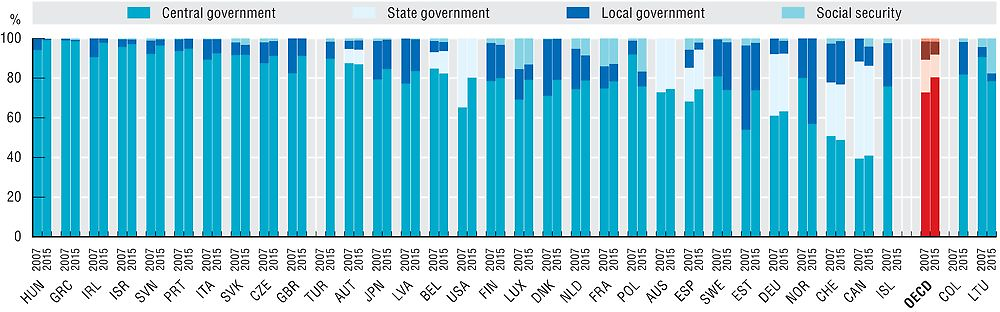
With respect to the composition of debt levels, in 2015 central governments held the largest share of government gross debt, averaging 80.5% in 2015, while state governments represented 11.4%, local governments 6.4% and social security 1.7%. Countries like Hungary and Greece have over 98% of their debt in central governments, while others like Canada and Norway, have 45% of their debt in state governments and 43.1% in local governments, respectively. This composition has shifted towards higher debt in the central government since 2007, before the crisis, when average gross debt held by the central government among OECD countries was 73%, given that debt grew significantly across OECD countries through this period in response to the financial crisis.
Data are derived from the OECD National Accounts Statistics (database) and Eurostat Government finance statistics (database), which are based on the System of National Accounts (SNA), a set of internationally agreed concepts, definitions, classifications and rules for national accounting. The updated 2008 SNA framework has been now implemented by all OECD countries (see Annex A for details on reporting systems and sources). Using SNA terminology, general government consists of central, state and local governments, and social security funds. State government is only applicable to the nine OECD countries that are federal states: Australia, Austria, Belgium, Canada, Germany, Mexico, Spain (considered a quasi-federal country), Switzerland and the United States. Fiscal balance also referred to as net leading (+) or net borrowing (-) of general government, is calculated as total government revenues minus total government expenditures. For additional information on debt, see the section of the government gross debt indicator.
Further reading
OECD (2015), National Accounts at a Glance 2015, OECD, Paris, https://doi.org/10.1787/na_glance-2015-en
Figure notes
Data for Chile and Turkey are not included in the OECD average due to missing time-series. Local government is included in state government for Australia and the United States. Australia does not operate government social insurance schemes. For Japan data for sub-sectors of general government refer to fiscal year. Social security funds are included in central government in Norway, the United Kingdom and the United States.
2.15: Data for Costa Rica are for 2014 rather than 2015. See also StatLinks for additional notes.
2.16: Data for Iceland are not available. Data for 2015 for Switzerland for local and state government are based on OECD estimations.
2.16 and 2.17: Data for Korea, Mexico and New Zealand are not available. Data for Australia, Canada, Sweden and the United States are reported on an adjusted basis (i.e. excluding unfunded pension liabilities). Data for Switzerland and the United States are reported on a non-consolidated basis.
2.17: Data are consolidated within the subsectors of general government. However, at the level of general government, flows between levels of government are included. Data for 2015 for Switzerland for local and state government are based on OECD estimations.
Information on data for Israel: https://doi.org/10.1787/888932315602.
Source: OECD National Accounts Statistics (database).
Sources: OECD National Accounts Statistics (database); Eurostat Government finance statistics (database).
Sources: OECDNational Accounts Statistics (database); Eurostat Government finance statistics (database).