Italy
SMEs in the national economy
SMEs represent 99.9% of enterprises in Italy and account for 80% of the industrial and service labour force (Eurostat, 2011). The share of micro-enterprises is higher than the EU across all sectors.
SME lending
In the aftermath of the global financial crisis and, more noticeably, during the sovereign debt strains, credit supply was significantly affected by the difficulties experienced by banks in wholesale funding and by the need to enhance capital ratios. Nevertheless, in last years domestic financial institutions gradually strengthened their highest-quality capital through substantial equity increases and, to a lesser extent, retained earnings. Access to funding clearly improved, also for the adoption of unconventional monetary policy measures by the ECB: the cost of funding is now at historically low levels.
Total business loans1, however, kept declining in 2013, due to a large extent to the perceived riskiness of borrowers: protracted weak economic activity caused a sharp deterioration in firms’ profitability and weighted on their financial buffers. The downward trend was confirmed in 2014, albeit at a slower pace, increasingly driven by firms’ slack demand.
Indeed, the prolonged economic downturn experienced by the Italian economy had a harsh impact on firms, hit by the contraction of industrial production and by the protracted fall in investment. The magnitude of the shock has been particularly large for SMEs, more reliant on domestic demand which recorded a significant drop over the period.
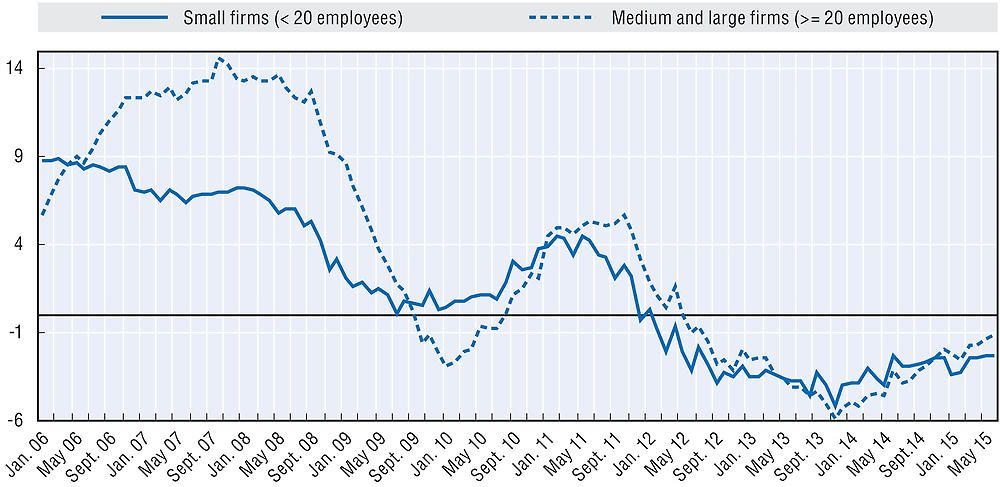
Source: Bank of Italy.
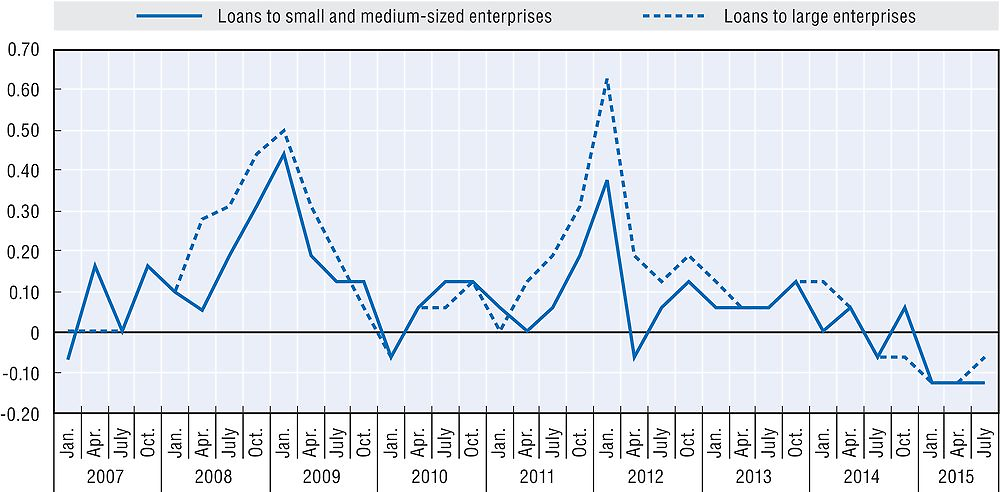
Since 2012, trends in lending were broadly similar for SMEs and large firms. Credit to small firms started decelerating earlier, but large firms experienced higher rates of decrease: as a result of this trend, the share of SME loans in total business loans increased slightly in recent years. However, large firms were able to partly overcome the still tight credit supply conditions by tapping alternative sources of finance, notably the bond market. SME short-term loans showed a marked slowdown as the financial crisis intensified, lending conditions tightened and credit demand from firms shrank. The share of short-term SME loans in total short and long-term SME loans declined from 31.9% in 2008 to 25.1% in 2014.
Credit conditions
The Eurosystem quarterly Bank Lending Survey (BLS) gathers supply-side information about the changes in Italian banks’ credit standards for approving loans or credit lines to both SMEs and large firms2. In last years the effects of the recession on credit quality were reflected in tight credit standards; however, according to the survey, lending criteria began to ease gradually during 2014, a trend confirmed in the first quarter of 2015.
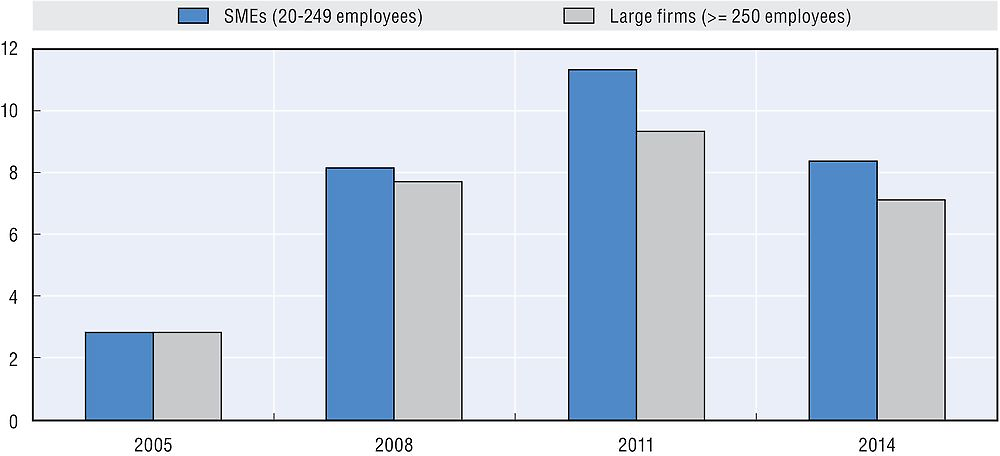
The rejection rate, measured as the share of firms reporting that they had not obtained the requested amount in full, increased sharply during the first phase of the crisis (8.2% in 2008) and, following the renewed economic turmoil, peaked at 12% in 2012. Since then, the indicator started declining: in 2014 it stood at 8.4%, but was still twice as high as in the five years before the crisis.
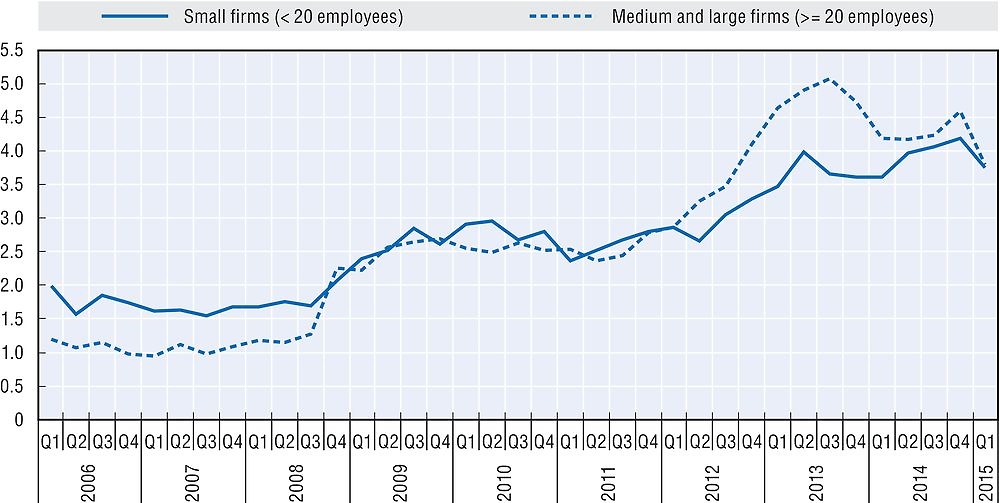
During the sovereign debt crisis, the cost of credit recorded an upsurge, more pronounced for SMEs than for large enterprises: in 2012 it reached 5.6% for small businesses. After a slight decrease in 2013, the average interest rates charged to SMEs subsided sharply at 4.4% in 2014, reflecting the expansionary measures taken by the Eurosystem, while interest rates applied to large firms dropped to a lesser extent; as a result, the interest rate spread level, that in 2013 was at its highest level since the beginning of the crisis, narrowed to 1.8%.
Note: SMEs have annual net turnover up to EUR 50 million. The dates reported in the table coincide with the month following the quarter covered by the survey.
Source: Euro area Bank Lending Survey.
Collateral requirements fell slightly between 2008 and 2009 following the lowering of the Central Credit Register reporting threshold and the inclusion of small, less secured loans. Since then, the request for guarantees increased steadily: in 2014, 56.7% of bank loans were collateralised, up from 51.9% recorded in 2009.
Source: Bank of Italy.
At the end of 2014, the ratio of new bad debts to outstanding loans, annualised and seasonally adjusted, peaked at 4.2% for SMEs; however, it showed signs of decline in the first quarter of 2015. Since 2012 the ratio has been steadily higher for large firms than for smaller ones: as in previous recessions, the rise in bad debts mainly involved medium and large borrowers. The significant share of bad debts to outstanding SME loans, which reached 16.7% in 2014, can be partly explained by the lengthy credit recovery procedures that extend the period during which NPLs remain at the banks’ balance sheet.
Source: Bank of Italy.
Equity financing
In Italy, early stage and expansion capital resources devoted to SMEs experienced a sharp drop between 2008 and 2009 as a result of the financial crisis, recovering in 2011-12. After a slight decrease in the subsequent year, in 2014 they plummeted by 48%, nearly halving the 2013 level, while total growth and venture capital rose by 23%, led by the upsurge in expansion capital resources directed to large firms. Over the 2007-13 period, on average, more than 50% of all expansion capital investments took place in SMEs, a percentage that dropped to 20% in 2014.
Provisions introduced by the Government included the establishment of a private equity fund with an endowment of EUR 1.2 billion to boost capitalisation and consolidation among firms with a turnover of between EUR 10 million and EUR 250 million. Promoted by the Italian Ministry of Finance in cooperation with the main financial and industrial institutions, the fund became operational at the end of 2010. Through April 2015, it had approved direct investments – addressed to the acquisition of minority stakes - amounting to EUR 400 million and indirect investments in third party managed funds totalling EUR 425 million.
Other indicators
At the outbreak of the crisis, the slump in sales and faster payment claims by suppliers were partly reflected in the increase in payment delays. For micro-enterprises, they peaked in 2012, when the second recession resulted in a widespread increase of the indicator. Since then, payment delays started declining: greater caution of suppliers in granting commercial credit and the exit from the market of the most fragile businesses, often marked by irregular payments, contributed to the positive trend. According to Cerved data, in 2014 delays decreased at 18.1 and 21.7 days for micro-businesses and large companies, respectively, and nearly stabilised for SMEs.
The long downturn deeply affected the productive system, with less profitable firms closing down during the crisis. Since 2007 the number of bankruptcies continued to grow relentlessly, despite a weak economic recovery in 2010. In 2014, 15 714 Italian companies went bankrupt, more than double the number of 7 511 recorded in 2008 and well more than the 14 129 witnessed in 2013. As a result, the incidence of insolvency continued to increase, reaching a total of 28 per 10 000 enterprises.
Government policy response
Against the backdrop of persistently weak economic conditions, several initiatives have been undertaken in recent years targeted at easing SME access to credit and supporting their liquidity needs and, in a longer term perspective, at diversifying the funding sources and promoting more resilient financial structures. The uncertainty on the pace of economic recovery has suggested to step up existing support measures, along with the introduction of new ones.
Public credit guarantee schemes, which reduce the impact of firm riskiness on banks’ balance sheet, play an especially important role in facilitating access to credit. The Central Guarantee Fund (CGF) continued to be the main instrument to support SME financing in 2014. Operational for more than a decade, reliance on the CGF increased strongly: from 2009 to 2014, the volume of loans activated reached EUR 54 billion. The progressive increase in its endowment, the extension of eligibility to additional categories of potential beneficiaries and the provision of a government backstop guarantee, which relieves banks from capital charges for loans covered by the Fund, contributed to the expansion of its activity.
Over the last years several agreements have been signed to allow firms with no bad debts, restructured loans or ongoing foreclosures to suspend for a year the repayment of the loan principal on some forms of debts, including provisions aimed at facilitating their debt service. Since 2009 SME debt moratoria have left EUR 24 billion at the disposal of firms, two third of which in the first two years of operation. According to the survey conducted by the Bank of Italy’s regional branches, from 2009 to 2014 regular repayment resumed on about half of the loans with instalments in arrears at the start of the moratorium.
Over the last few years, CDP has broadened its scope of operations to include measures in support of the economy, mainly indirectly by supplying earmarked funds to the banking system at convenient rates to support SMEs. The participating banks retain full responsibility for selecting eligible borrowers and deciding lending terms. Until December 2014, about EUR 15 billion had been allocated to SMEs through this channel. CDP has gradually diversified the purpose of the funding and the beneficiary firms. The financing programme has been strengthened by the introduction of the ‘Enterprise Platform’, endowed with EUR 5 billion, aimed at the streamlining of the products offered to firms: in addition to the reallocation of resources originally earmarked for the settlement of general government trade payables to the ‘SME fund’, it included the ‘MID fund’ for the financing of investments and working capital needs of firms with 250 to 2 999 employees; the ‘SME Networks Fund’, for supporting the growth of SMEs participating in a network agreement; the ‘Export Fund’, dedicated to Italian exporting firms of all sizes. In March 2014, a new fund was set up to finance the purchase of brand-new machinery, equipment and digital technologies; until the end of that year, over EUR 1 billion had been disbursed for this purpose. Furthermore, applicant firms could benefit from a subsidy by the Ministry of Economic Development to partially cover the interest on these loans.
To foster a more diversified corporate capital structure, thus reducing the vulnerabilities to adverse bank loan supply shocks, in 2012 the Government regulated the issuance of short- and medium- term debt instruments by unlisted firms other than banks and micro-enterprises. Initially, the measure has been deployed by larger companies; however, in 2014, the average size of these issuances dropped to about EUR 30 million, down from around EUR 270 million recorded in previous years, signalling an increasing participation of medium-sized firms to the bond market.
The impact of some of the above mentioned initiatives, mainly targeted at SMEs, was often not negligible: between 2009 and 2014, the financial resources made available through debt moratoria and the interventions of the Central Guarantee Fund and the Deposits and Loans Fund amounted to over EUR 90 billion, just under 10% of disbursement of bank loans below EUR 1 million.
Country definition
In accordance with Eurostat standards, the Italian National Institute of Statistics defines small and medium enterprises as firms with fewer than 250 employees. In detail, micro-enterprises and small firms have, respectively, less than 10 and 10-49 employees, while medium-sized enterprises are defined as those with 50-249 employees.
The SME definition used by financial institutions
The Bank of Italy classifies data on business lending by firm size: small firms are defined as limited partnerships, general partnerships, informal partnerships, de facto companies and sole proprietorships with fewer than 20 workers. This data disaggregation has been used for most indicators on the debt side.
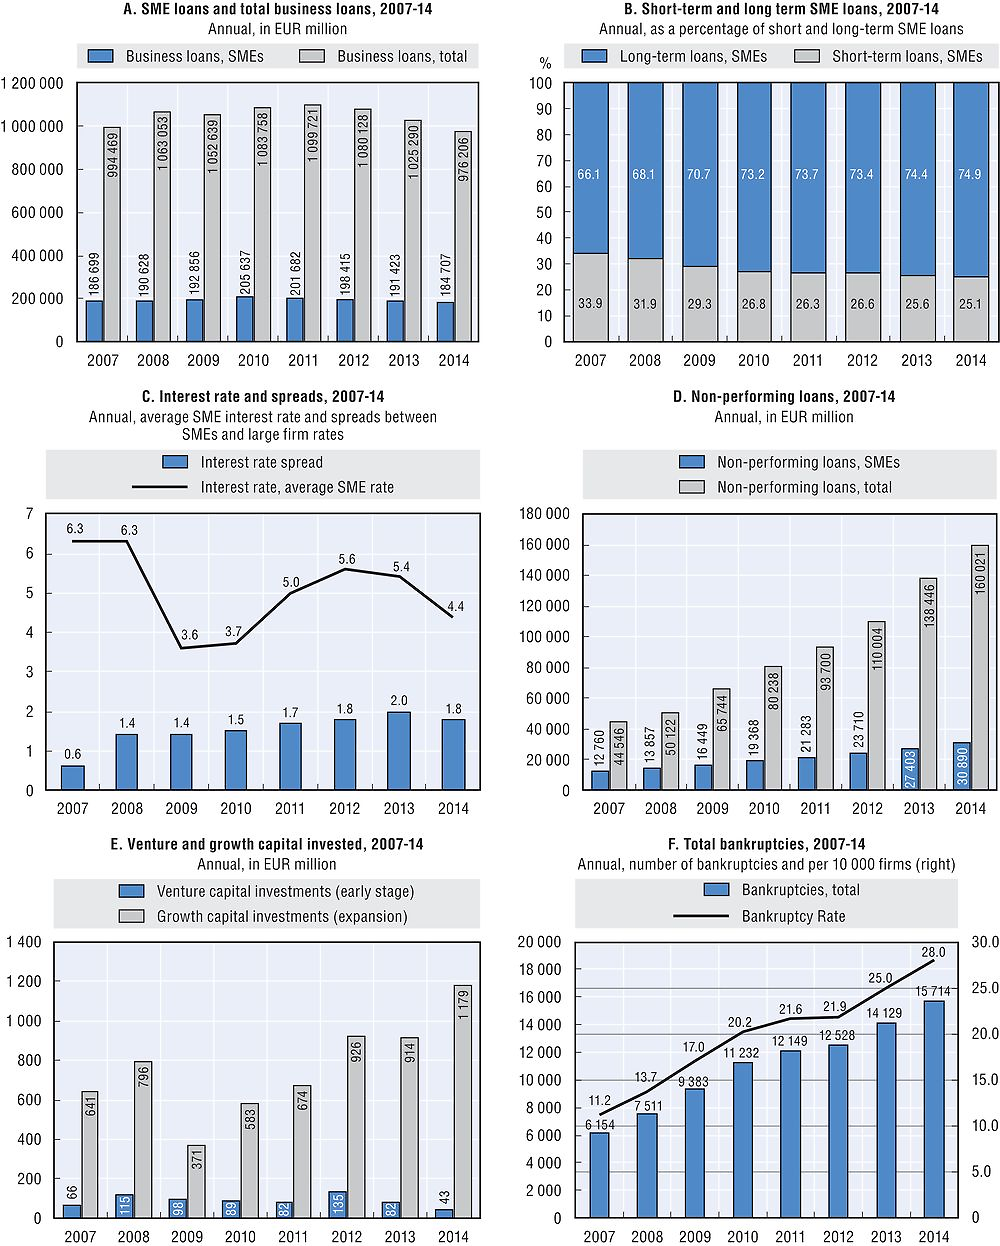
Sources: Charts A, B, C and D: Bank of Italy. Chart E: AIFI – Italian Private Equity and Venture Capital Association. Chart F: Cerved.
References
Bank of Italy (2015a), Annual Report for 2014, Ordinary Meeting of Shareholders, Rome, https://www.bancaditalia.it/pubblicazioni/relazione-annuale/2014/index.html?com.dotmarketing.htmlpage.language=1.
Bank of Italy (2015b), Financial Stability Report, April 2015, Rome, https://www.bancaditalia.it/pubblicazioni/rapporto-stabilita/2015-1/index.html?com.dotmarketing.htmlpage.language=1.
Bank of Italy (2014a), Annual Report for 2013, Ordinary Meeting of Shareholders, Rome, https://www.bancaditalia.it/pubblicazioni/relazione-annuale/2013/index.html?com.dotmarketing.htmlpage.language=1.
Bank of Italy (2014b), Financial Stability Report, November 2014, Rome, https://www.bancaditalia.it/pubblicazioni/rapporto-stabilita/2014-2/index.html?com.dotmarketing.htmlpage.language=1.
Bank of Italy (2013), Annual Report for 2012, Ordinary Meeting of Shareholders, Rome, https://www.bancaditalia.it/pubblicazioni/relazione-annuale/2012/index.html?com.dotmarketing.htmlpage.language=1.
Bank of Italy (2010), Annual Report for 2009, Ordinary Meeting of Shareholders, Rome, https://www.bancaditalia.it/pubblicazioni/relazione-annuale/2009/index.html?com.dotmarketing.htmlpage.language=1.
Bank of Italy (2009), Annual Report for 2008, Ordinary Meeting of Shareholders, Rome, https://www.bancaditalia.it/pubblicazioni/relazione-annuale/2008/index.html?com.dotmarketing.htmlpage.language=1.
Bank of Italy, Economic Bulletin, various issues, Rome.
Bank of Italy (2015), Bank Lending Survey, Rome, http://www.bancaditalia.it/statistiche/tematiche/moneta-intermediari-finanza/intermediari-finanziari/indagine-credito-bancario/index.html?com.dotmarketing.htmlpage.language=1.
Bank of Italy (2015), Survey of Industrial and Service Firms, Rome, https://www.bancaditalia.it/pubblicazioni/indagine-imprese/index.html?com.dotmarketing.htmlpage.language=1.
Bartiloro, L., L. Carpinelli, P. Finaldi Russo and S. Pastorelli (2012), Access to credit in times of crisis: measures to support firms and households, Bank of Italy, Occasional Papers, No. 111, January, https://www.bancaditalia.it/pubblicazioni/qef/2012-0111/index.html?com.dotmarketing.htmlpage.language=1.
Eurostat (2011), Key figures on European business with a special feature on SMEs, European Union, http://ec.europa.eu/eurostat/web/products-pocketbooks/-/KS-ET-11-001.