copy the linklink copied!Research and development in the pharmaceutical sector
Pharmaceutical research and development (R&D) is funded from a complex mix of private and public sources. Governments mainly support basic and early-stage research through direct budget allocations, research grants, publicly owned research institutions and higher education institutions. The pharmaceutical industry is active across all phases of R&D but makes the largest contribution to translating and applying knowledge to develop products. Clinical trials required to gain market approval are largely funded by industry. However, industry also receives direct R&D subsidies or tax credits in many countries.
In 2016, governments of 31 OECD countries from which data are available collectively budgeted about USD 53 billion for health-related R&D (a broader category than pharmaceuticals). This figure understates total government support because it excludes most tax incentives and funding for higher education and publicly-owned corporations. Meanwhile, the pharmaceutical industry spent approximately USD 101 billion on R&D across OECD countries.
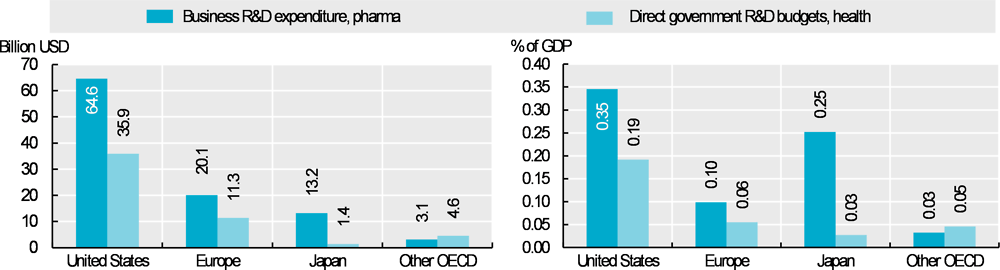
Most pharmaceutical industry R&D expenditure comes from OECD countries but the share from non-OECD countries is increasing (EFPIA, 2018[1]). Growth has been particularly rapid in China, where the industry spent USD 14 billion on R&D in 2016 (0.07% of GDP) – a more than 2.5-fold increase since 2010 (in real terms) (OECD, 2019[2]). Nearly two-thirds of the spending in OECD countries (Figure 10.12) occurs in the United States, where the industry spent about USD 65 billion (0.35% of GDP), and government budgets on health-related R&D were USD 36 billion (0.19% of GDP). The industry spent USD 20 billion (0.1% of GDP) and governments budgeted USD 11 billion (0.06% of GDP) in Europe; the figures were USD 13 billion (0.25% of GDP) and USD 1.4 billion (0.03% of GDP) respectively in Japan. As a share of GDP, industry spending is highest in Switzerland (0.85%), Denmark (0.46%) and Slovenia (0.45%), smaller countries with relatively large pharmaceutical sectors.
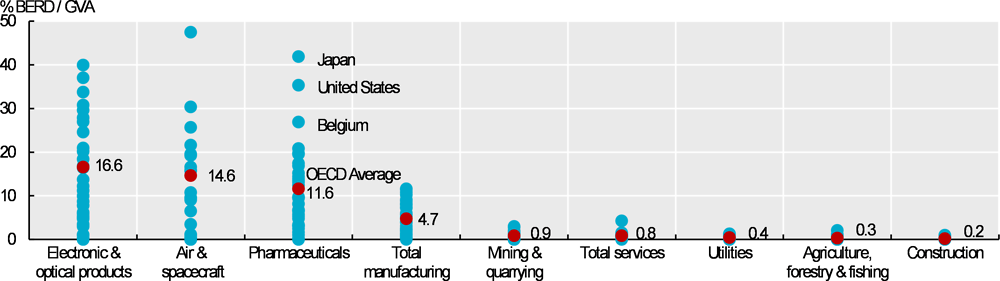
The pharmaceutical industry is highly R&D intensive. On average across OECD countries, the industry spent nearly 12% of its gross value added on R&D. This is almost as high as in the electronics and optical and air and spacecraft industries, and considerably higher than across manufacturing as a whole (Figure 10.13).
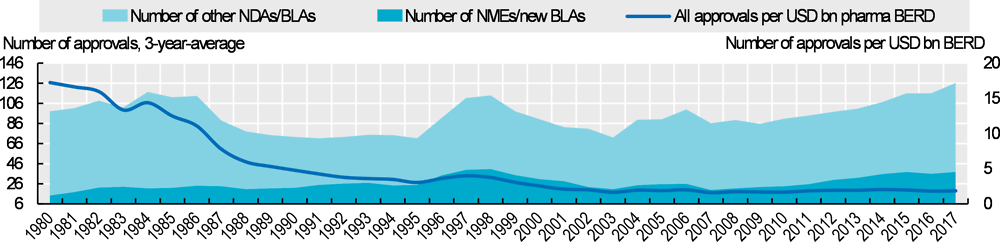
Expenditure on R&D in the pharmaceutical industry in OECD countries grew by 14% in real terms between 2010 and 2016. The number of new drug approvals has also increased since 2010, following a decline after the 1980s. In the United States, for example, the annual number of approvals is now back to a similar level to that seen in the 1980s (Figure 10.14). However, given the increase in R&D expenditure, the number of approvals per inflation-adjusted R&D spending has declined steadily.
This pattern of decreasing productivity despite advances in technology is driven by a complex combination of factors. These include growing requirements to obtain market approval, which have increased clinical trial costs, and an ever-increasing base of effective drugs that has shifted efforts to drugs for more complex conditions. Rising R&D costs can be both a cause and a result of higher drug prices, as the acceptance of higher prices by payers can make increasingly expensive R&D and acquisitions of R&D projects financially viable. Increasing R&D and acquisition costs can, in turn, drive up prices.
Business enterprise expenditure on R&D (BERD) covers R&D carried out by corporations, regardless of the origin of the funding, which can include government subsidies. BERD is recorded in the country where the R&D activity took place, not the country providing funding. National statistical agencies collect data primarily through surveys and according to the Frascati Manual but there is some variation in national practices. Pharmaceutical R&D refers to BERD by businesses classified in the pharmaceutical industry. Europe includes 21 EU member states that are also OECD countries, Iceland, Norway and Switzerland (with no data available for Lithuania and Luxembourg).
Government budgets for R&D (GBARD) capture R&D performed directly by government and amounts paid to other institutions for R&D. Health-related R&D refers to GBARD aimed at protecting, promoting and restoring human health, including all aspects of medical and social care. It does not cover spending by public corporations or general university funding that is subsequently allocated to health.
The gross value added (GVA) of a sector equals gross output less intermediate consumption. It includes the cost of wages, consumption of fixed capital and taxes on production. Because GVA does not include intermediate consumption, it is less sensitive than gross output to sector-specific reliance on raw materials. The OECD average in Figure 10.13 is an unweighted mean of R&D intensity across 18 countries with data available for air and spacecraft; and 29-33 countries for all other industries.
Data in Figure 10.14 include approvals of new molecular entities (NMEs) and other new drug applications (NDAs) and new biologic license application (BLAs) and other BLAs.
References
[1] EFPIA (2018), The Pharmaceutical Industry in Figures, https://www.efpia.eu/media/361960/efpia-pharmafigures2018_v07-hq.pdf.
[2] OECD (2019), Analytical Business Enterprise Research and Development (ANBERD) Database, http://oe.cd/anberd.
Source: OECD Main Science and Technology Indicators and Research and Development Statistics databases.
Source: OECD Analytical Business Enterprise R&D, Structural Analysis and System of National Accounts databases.
Source: United States Food and Drug Administration; Pharmaceutical Research and Manufacturers of America.
Metadata, Legal and Rights
https://doi.org/10.1787/4dd50c09-en
© OECD 2019
The use of this work, whether digital or print, is governed by the Terms and Conditions to be found at http://www.oecd.org/termsandconditions.