Employment by region
Inequalities in economic performance across regions partly reflect the extent to which each region is able to utilise its available labour resources, and especially to increase job opportunities for under-represented groups.
Definition
Employed persons are all persons who during the reference week of the survey worked at least one hour for pay or profit, or were temporarily absent from such work. The employment rate is the number of employed persons as a percentage of the working age (15-64) population.
Comparability
As for other regional statistics, comparability is affected by differences in the meaning of the word “region”. This results in significant differences in terms of geographic area and population both within and among countries. To address this issue, the OECD has classified regions within each country based on two levels: territorial level 2 (TL2, large regions) and territorial level 3 (TL3, small regions). Labour market data for Canada refers to a different regional grouping, labelled non-official grids (NOG) comparable to TL3. For Brazil, China, Russia and South Africa only large regions have been defined.
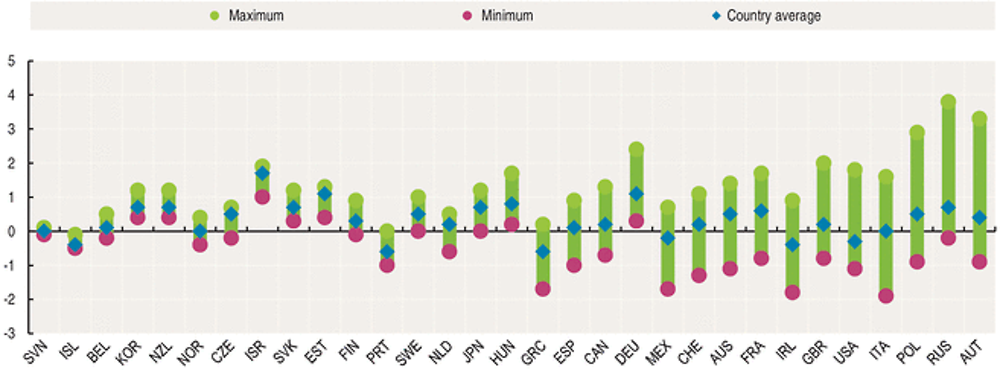
Data on employment growth refer to period 2000-14 for all countries, except for Germany and Slovenia, the first available year is 2001, and 2004 for Turkey. Data on employment increase contributed by the top 10% regions include only countries with average positive growth of employment over 2000-14. Greece and Japan are excluded. Denmark is excluded due to lack of data on comparable years.
Data on regional employment growth refer to small regions (TL3), except for Iceland, Israel, Mexico, Poland, Portugal, Slovenia and Russia where it is large regions (TL2).
Data on female employment refer to large regions (TL2).
Differences in employment opportunities within countries are often larger than across countries. In almost half of the countries, differences in regional employment growth rates across regions were above 2 percentage points over the period 2000-14. Regional differences in employment in OECD countries were the largest in Austria, Poland, Italy, and the United States, and among the emerging economies, Russia.
A small number of regions drive employment creation at the national level. On average, almost half of overall employment creation in OECD countries between 2000 and 2014 was accounted for by just 10% of regions. The regional contribution to national employment creation was particularly concentrated in certain countries. In Greece, Japan, Australia and the United States, more than two-third of employment growth was spurred by 10% of regions.
Comparing the periods before and after the peak of the recent economic crisis, respectively 2000-07 and 2009-14, the regional concentration of employment creation has increased in 20 of the 30 countries, resulting in higher differences in employment among regions.
In one fourth of OECD regions, the difference between employment rates for men and women is higher than 20 percentage points. In 2014, OECD countries with the highest regional disparities of difference in gender employment rates were Mexico, Turkey, Chile, the United States and Israel.
Sources
-
OECD (2013), OECD Regions at a Glance, OECD Publishing.
Further information
Analytical publications
-
OECD (2014), OECD Regional Outlook, OECD Publishing.
-
OECD (2012), Promoting Growth in All Regions, OECD Publishing.
-
OECD (2009), Regions Matter: Economic Recovery, Innovation and Sustainable Growth, OECD Publishing.
Online databases
Websites
-
Regional Development, www.oecd.org/regional/regional-policy.
-
Regions at a Glance Interactive, http://rag.oecd.org.