copy the linklink copied!Introduction: The indicators and their framework
copy the linklink copied!The organising framework
Education at a Glance 2019: OECD Indicators offers a rich, comparable and up-to-date array of indicators that reflect a consensus among professionals on how to measure the current state of education internationally. The indicators provide information on the human and financial resources invested in education, how education and learning systems operate and evolve, and the returns to investments in education. They are organised thematically, each accompanied by information on the policy context and interpretation of the data.
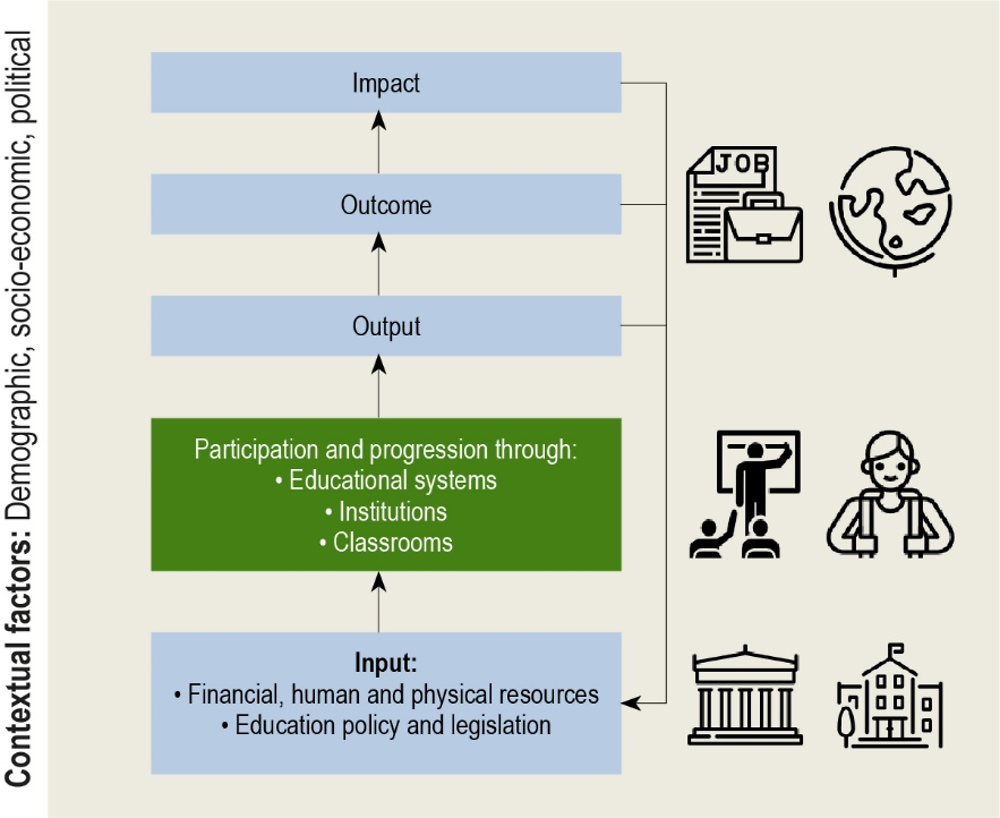
The indicators are organised within a framework that distinguishes between the actors in education systems, groups them according to the types of issues they address, and examines contextual factors that influence policy (Figure A). In addition to these dimensions, the time perspective makes it possible to visualise dynamic aspects of the development of education systems.
Actors in education systems
The OECD Indicators of Education Systems (INES) programme seeks to gauge the performance of national education systems as a whole, rather than to compare individual institutional or other subnational entities. However, there is increasing recognition that many important features of the development, functioning and impact of education systems can only be assessed through an understanding of learning outcomes and their relationships to inputs and processes at the level of individuals and institutions.
To account for this, the first dimension of the organising framework distinguishes the three levels of actors in education systems:
-
education systems as a whole
-
providers of educational services (institutions, schools), as well as the instructional setting within those institutions (classrooms, teachers)
-
individual participants in education and learning, the students. These can be either children or young adults undergoing initial schooling and training or adults pursuing lifelong learning programmes.
Indicator groups
The second dimension of the organising framework further groups the indicators into three categories:
-
Indicators on the output, outcomes and impact of education systems: Output indicators analyse the characteristics of those exiting the system, such as their educational attainment. Outcome indicators examine the direct effect of the output of education systems, such as the employment and earning benefits of pursuing higher education. Impact indicators analyse the long-term indirect effect of the outcomes, such as knowledge and skills acquired, contributions to economic growth and societal well-being, and social cohesion and equity.
-
Indicators on the participation and progression within education entities: These indicators assess the likelihood of students accessing, enrolling in and completing different levels of education, as well as the various pathways followed between types of programmes and across education levels.
-
Indicators on the input into education systems or the learning environment: These indicators provide information on the policy levers that shape the participation, progression, outputs and outcomes at each level. Such policy levers relate to the resources invested in education, including financial, human (such as teachers and other school staff), or physical resources (such as buildings and infrastructure). They also relate to policy choices regarding the instructional setting of classrooms, pedagogical content and delivery of the curriculum. Finally, they analyse the organisation of schools and education systems, including governance, autonomy and specific policies to regulate participation of students in certain programmes.
Contextual factors that influence policy
Policy levers typically have antecedents, external factors that define or constrain policy but are not directly connected to the policy topic at hand. Demographic, socio-economic and political factors are all important national characteristics to take into account when interpreting indicators. The recent financial crisis, for example, had a significant impact on public funds available to education.
The characteristics of the students themselves, such as their gender, age, socio-economic status or cultural background, are also important contextual factors that influence the outcomes of education policy.
copy the linklink copied!Indicator analysis using the framework
This versatile framework can be used to understand the operation and functioning of any educational entity, from an education system as a whole to a specific level of education or programme, or even a smaller entity, such as a classroom.
This versatility is important because many features of education systems have varying impacts at different levels of the system. For example, at the level of students within a classroom, the relationship between student achievement and class size may be negative, if students in small classes benefit from improved interactions with teachers. At the class or school level, however, weaker or disadvantaged students are often intentionally grouped and placed in smaller classes so that they receive more individual attention. At the school level, therefore, the observed relationship between class size and student achievement is often positive, suggesting that students in larger classes perform better than students in smaller classes. At higher levels of aggregation, the relationship between student achievement and class size is further confounded by the socio-economic intake of individual schools or by factors relating to the learning culture in different countries. Therefore, to interpret the indicators, it is important to fully understand the relationships between them.
Analysis of each element of the framework and the interplay between them contribute to understanding a variety of policy perspectives:
-
quality of education outcomes and education opportunities
-
equality of education outcomes and equity in education opportunities
-
adequacy, effectiveness and efficiency of resources invested in education
-
relevance of education policy measures to improve education outcomes.
copy the linklink copied!The structure of chapters and indicators in Education at a Glance
The indicators published in Education at a Glance 2019 have been developed within this framework. The chapters are structured through the lens of the education system as a whole, although the indicators themselves are disaggregated and analysed across different levels of education and education settings, and may therefore speak to more than one element of the framework.
Chapter A, The output of educational institutions and the impact of learning, contains indicators on the output, outcomes and impact of education in the form of the overall attainment of the population, as well as the learning, economic and social outcomes (Figure A). Through this analysis, the indicators in this chapter provide context to shape policies on lifelong learning. They also provide insights into the policy levers needed to address areas where outcomes and impact may not be aligned with national strategic objectives.
Chapter B, Access to education, participation and progression, considers the full education system from early childhood to tertiary education and provides indicators on the enrolment, progression and completion of students at each level and programme (Figure A). These indicators can be considered a mixture of output and outcome, to the extent that the output of each education level serves as input to the next and that progression is the result of policies and practices at classroom, institution and system levels. But they can also provide context to identify areas where policy intervention is necessary to address issues of inequity, for example, or to encourage international mobility.
Chapters C and D relate to the input into educational systems (Figure A):
-
Chapter C, Financial resources invested in education, provides indicators on investment in education and educational institutions and how that investment is shared between public and private sources. These indicators are mainly policy levers, but they also help to explain specific learning outcomes. For example, expenditure on educational institutions per student is a key policy measure that most directly affects individual learners, but it also acts as a constraint on the learning environment in schools and learning conditions in the classroom.
-
Chapter D, Teachers, the learning environment and organisation of schools, provides indicators on instruction time, teachers’ working time, and teachers’ and school heads’ salaries. These indicators not only represent policy levers that can be manipulated, but also provide contexts for the quality of instruction and for the outcomes of individual learners. This chapter also presents data on the profile of teachers, and on admission systems to tertiary education.
In addition to the regular indicators and core statistics published, Education at a Glance also contains analytical work in textboxes. This work usually provides research elements that contribute to the understanding of the indicator, or additional analysis of a smaller number of countries that complement the findings presented.
copy the linklink copied!The Sustainable Development Goal 4
In September 2015, world leaders gathered to set ambitious goals for the future of the global community. Goal 4 of the Sustainable Development Goals (SDGs) seeks to ensure “inclusive and equitable quality education and promote lifelong learning opportunities for all”. Each target of the SDG 4 framework has at least one global indicator and a number of related thematic indicators designed to complement the analysis and the measurement of the target.
UNESCO oversees the education SDG agenda in the context of the United Nations-led SDG framework. As the custodian agency for most of the SDG 4 indicators, the UNESCO Institute of Statistics (UIS) is co-ordinating global efforts to develop the indicator framework to monitor progress towards SDG 4 targets. In addition to collecting data, UIS works with partners to develop new indicators, statistical approaches and monitoring tools to better assess progress across the education-related SDG targets.
In this context, the OECD’s education programmes have a key role to play in the achievement of – and measuring progress towards – SDG 4 and its targets. There is a high level of complementarity between the SDG 4 agenda and the OECD’s education policy tools, instruments, evidence and dialogue platforms. The OECD is working with UIS, the SDG 4 Steering Committee and the technical working groups that have been put in place to help build a comprehensive data system for global reporting, agree on the data sources and formulae used for reporting on the SDG 4 global indicators and on selected thematic indicators for OECD member countries and partner countries.
As part of this global effort to advance the dialogue and progress of the SDG monitoring, Education at a Glance continues to devote a chapter to this universal education agenda. The chapter aims to provide an assessment of where OECD and partner countries stand on their way to meeting the SDG targets. Depending on the focus of each edition, the selected global and thematic SDG indicators presented may differ from year to year. Thus, the SDG presentation draws on the general framework of Education at a Glance.
copy the linklink copied!Tertiary education in Education at a Glance 2019
As the selected theme for this year’s publication, tertiary education is at the forefront of Education at a Glance 2019. Tertiary education has seen unprecedented growth in the past decade and is presented as one of the paths through which young people can succeed in life. There is increasing policy interest in providing comparative analysis of the progression of students, the outcomes of graduates and the resources invested. Therefore, a large number of indicators in this year’s edition analyse students’ participation and progression through tertiary education, as well as the economic, labour market and social outcomes of tertiary-educated adults. The analysis also includes indicators on the resources invested in tertiary education, both financial and human. This year, three new indicators complement the set of indicators, offering additional analysis on tertiary completion rates, doctoral graduates and their labour-market outcomes, and tertiary admission systems.
In line with this general focus of the publication, the SDG chapter in this year’s edition focuses on youth learning pathways and helps inform the debate on youth prospects and youth employment in OECD and partner countries, in the light of the Sustainable Development Agenda. Building not only on SDG 4 (quality education) but also on SDG 8 (decent work and economic growth), the chapter describes the pathways that youth can take throughout their journey: the transition from secondary to higher levels of education, and their progression through higher levels of education, and from education into the labour market.
Table A below summarises the indicators and chapters that contribute to the analysis of tertiary education in this year’s edition.
Metadata, Legal and Rights
https://doi.org/10.1787/f8d7880d-en
© OECD 2019
The use of this work, whether digital or print, is governed by the Terms and Conditions to be found at http://www.oecd.org/termsandconditions.