
copy the linklink copied!Indicator C5. How much do tertiary students pay and what public support do they receive?
Tuition fees charged by institutions vary significantly across countries. In about one-third of countries, public institutions do not charge any tuition fees for national students enrolled in bachelor’s or equivalent programmes. In another third of countries, tuition fees are low or moderate (below USD 2 600 per year). In the remaining countries, they are high and range from USD 3 000 to over USD 9 000 per year.
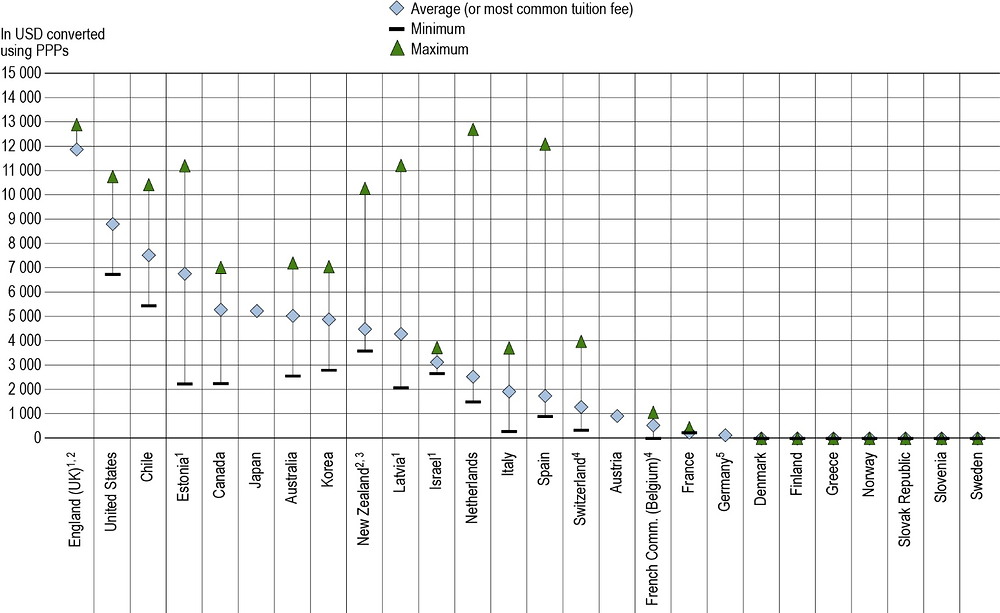
Annual tuition fees vary not only across countries, but also within countries for a given level of education. At bachelor’s or equivalent level, the countries with the highest average tuition fees also tend to have wide ranges of tuition fees. In contrast, in countries with the lowest average tuition fees, the range of tuition fees tends be very narrow – with the difference between the minimum and maximum annual fees not exceeding USD 200.
Financial mechanisms to support students enrolled in tertiary education such as grants, scholarships and loans tend to be more developed in countries that charge either relatively high tuition fees or no tuition fees at all.
Context
OECD and partner countries have different approaches to providing financial support to students and to sharing the costs of tertiary education among governments, students and their families, and other private entities.
Tuition fees bridge the gap between the costs incurred by tertiary educational institutions and the revenues they receive from sources other than students and their families. Many factors may influence the level of costs, including: salaries of teachers and researchers; development of digital learning and non-teaching services; changes in demand for tertiary education; investments to support internationalisation; and amount and type of research activities undertaken by faculty and staff. Tertiary institutions partly cover their costs through internal resources (endowments) or revenue from private sources other than students and their families (see Indicator C3). The remainder is covered by student tuition fees and public sources.
Public support to students and their families can be a way to encourage participation in education, while also indirectly funding tertiary institutions. Channelling funding to institutions through students may also help to increase competition among institutions and encourage them to better respond to student needs. Student support comes in many forms, including means-based subsidies, family allowances for students, tax allowances for students or their parents, or other household transfers. Governments strive to strike the right balance among these different subsidies, especially in periods of financial crisis. Based on a given amount of subsidies, public support such as tax reductions may provide less support for low-income students than means-tested subsidies, as tax reductions are not targeted specifically at low-income students. However, such measures may still help to reduce the financial disparities between households with and without children in education.
Other findings
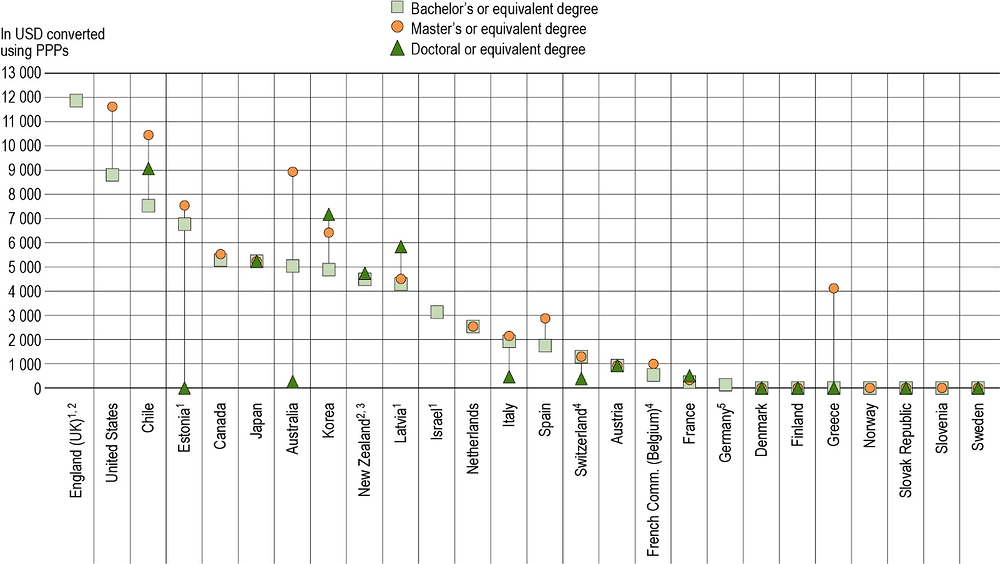
The level of tuition fees charged by institutions rarely reflects labour-market opportunities. In most countries, the earnings advantage for completing a master’s programme or a doctorate is greater than for attaining tertiary education at bachelor’s level. Nonetheless, in more than half of OECD countries, public institutions charge similar tuition fees regardless of the level of education.
At the bachelors’ level, public institutions charge higher tuition fees for foreign students than for national students in around one-third of countries with available data. Australia, Canada and Sweden show the largest differences. In these three countries, public institutions charge foreign students on average over USD 13 900 more per year than national students.
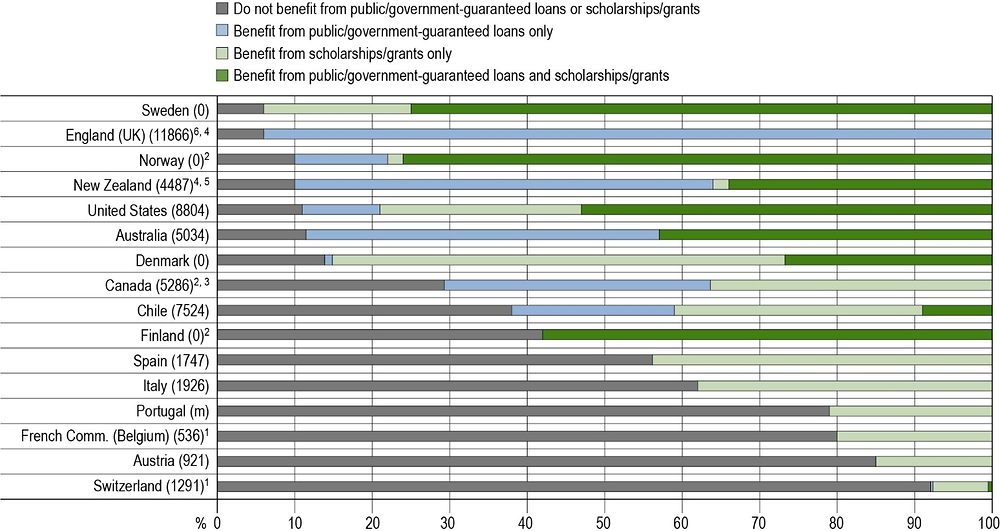
OECD governments support students’ living or educational costs through various combinations of loans, grants or scholarships. In most countries with no tuition fees at the bachelor’s level, students tend to receive financial support in the form of both loans and scholarships or grants. In countries with low or moderate tuition fees (below USD 2 600 per year), less than half of students receive financial support, and those who do mainly receive it in the form of grants or scholarships only. There is more variation among countries with high tuition fees, but one common pattern is that students tend to rely to some extent on income-contingent loans.
1. Data is presented for government-dependent institutions instead of public institutions.
2. Short-cycle tertiary programmes are included in bachelor's or equivalent programmes.
3. Estimates include universities only and exclude ISCED 6, such as postgraduate certificates and diplomas.
4. Government-dependent private institutions are included in public institutions.
5. Tuition fees are presented for total tertiary education instead of bachelor's or equivalent level. Tuition fees correspond to national and foreign students. Only academic programmes are included.
Countries and economies are ranked in descending order of annual average (or most common) tuition fees at the bachelor's or equivalent level.
Source: OECD (2019), Table C5.1. See Source section for more information and Annex 3 for notes (https://doi.org/10.1787/f8d7880d-en).
Analysis
Differentiation of tuition fees between tertiary degrees
Entry into tertiary education often implies costs for students and their families, in terms of both tuition fees and living expenses, although they may also receive financial support to be able to afford tertiary education. Tuition fees vary significantly across countries. This is true for instance at the bachelor’s level, which accounts for most national entrants into tertiary programmes in OECD countries (see Indicator B4). Students in public institutions paid no tuition fees in about one-third of the countries – including the Nordic countries (Denmark, Finland, Norway and Sweden), and other countries such as Greece, the Slovak Republic and Slovenia. In another third of countries (mostly European countries), tuition fees are low or moderate, with an average cost for students of below USD 2 600 per year. In the remaining countries with available data (Australia, Canada, Chile, England (United Kingdom), Israel, Japan, Latvia, Korea, New Zealand and the United States), tuition fees range from USD 3 000 to over USD 9 000 per year. For instance, tuition fees exceed USD 10 000 in England (United Kingdom), where the majority of students enrol in government-dependent private institutions. Finally, a particular case is found in Estonia, where public institutions charge no tuition fees for bachelor’s degrees, but government-dependent private institutions (which account for 65% of students enrolled at that level) charge fees of USD 6 700 (Figure C5.1).
Attaining a higher tertiary qualification than a bachelor’s degree leads to better employment opportunities and earnings prospects (see Indicator A4). If tuition fees reflected labour-market opportunities, they would therefore tend to increase with the level of education. However, in the majority of OECD countries, public institutions charge similar tuition fees for full-time national students in master’s and doctoral programmes than for students in bachelor’s programmes (Figure C5.1). The additional costs that master’s and doctoral students face are thus limited to the forgone earnings from the additional years of education and their delayed entry into the labour market. For instance, in all countries with no tuition fees at bachelor’s level (except Greece for a number of master’s programmes), tuition is also free of charge at master’s and doctoral levels. Similarly, several countries with low, moderate or high tuition fees (such as Austria, Canada, France, Japan, the Netherlands and New Zealand) also charge similar fees across all tertiary educational levels.
In contrast, in some countries, average tuition fees reflect labour-market opportunities more closely, as they increase between the bachelor’s and master’s level. This is the case for instance in Chile, Korea and the United States, where average tuition fees for master’s programmes in public institutions are about 30% higher than for bachelor’s programmes. In Australia, the French Community of Belgium and Spain, they are over 50% higher (Figure C5.1).
In a few countries, tuition fees are lower for doctoral programmes than for bachelor’s and master’s programmes. This is the case in Australia, Italy and Switzerland (public institutions) and in Estonia (government-dependent private institutions). In Australia, for example, the annual average tuition fees in public institutions for doctoral programmes are about 20 times lower than for bachelor’s programmes (about USD 260 compared to USD 5 000). In contrast, public institutions in Chile and Korea charge higher tuition fees for doctoral programmes than for bachelor’s and master’s programmes. This is also true in Latvia for government-dependent private institutions (Figure C5.1).
Variations within countries in tuition fees for bachelor’s programmes
Tuition fees vary not only across countries and educational levels, but also within countries for a given level of education. At bachelor’s or equivalent level, the countries with the highest average tuition fees tend to have wider ranges of tuition fees. For instance, in Canada, where annual average tuition fees in public institutions are around USD 5 300, tuition fees range from USD 2 250 to USD 7 000. Similarly, in Chile, where average tuition fees are around USD 7 500, they range from USD 5 450 to USD 10 400. In the United States (average fees of USD 8 800), tuition fees range from USD 6 700 to USD 10 750 (Figure C5.2).
The range of tuition fees is also wide in a few countries with more moderate fees, such as the Netherlands (annual average fees of USD 2 500) and Spain (annual average fees of USD 1 750). In the Netherlands, tuition fees range from USD 1 500 to USD 12 700, and in Spain they range from USD 900 to USD 12 100. In these two countries, the high tuition fees only apply for a small number of students.
In contrast, in the countries with the lowest average tuition fees (such as Denmark, Finland, France, Greece, Norway, the Slovak Republic, Slovenia and Sweden), the range of tuition fees tends be very narrow – with the difference between the minimum and maximum annual fees not exceeding USD 200.
Note: The year of reference may differ across countries and economies. Please see Annex 3 for details.
1. Data are presented for government-dependent institutions instead of public institutions.
2. Short-cycle tertiary programmes are included in bachelor's or equivalent programmes.
3. Estimates include universities only and exclude ISCED 6, such as postgraduate certificates and diplomas.
4. Government-dependent private institutions are included in public institutions.
5. Tuition fees are presented for total tertiary education instead of bachelor's or equivalent level. Tuition fees correspond to national and foreign students. Only academic programmes are included.
Countries and economies are ranked in descending order of annual average (or most common) tuition fees.
Source: OECD (2019), Table C5.2. See Source section for more information and Annex 3 for notes (https://doi.org/10.1787/f8d7880d-en).
Differentiation of tuition fees by type of institution for bachelor’s programmes
The need for financial resources and the goal of guaranteeing an affordable education for all lead to different levels of tuition fees for different types institutions. Independent private institutions are often less affected by government regulation and less reliant on public funds than public institutions. In some cases, they are also more pressed by competition to provide the best possible services to students. As a result, they may charge higher annual tuition fees than public institutions for bachelor's or equivalent programmes in all OECD countries with available data.
In over one-third of countries with available data, tuition fees are at least twice as high in independent private institutions as in public institutions (Table C5.1). In the United States, the average annual tuition fee charged by independent private institutions for national students at the bachelor’s or equivalent level is USD 29 500, more than three times the average annual tuition fee in public institutions (USD 8 800). In Japan and Korea, the average annual tuition fee at this level is between USD 8 700 and USD 8 800 in independent private institutions, while it is closer to USD 5 000 in public institutions. Tuition fees are about four times higher in independent private institutions than in public institutions in Spain, about three times higher in Italy, and about twice as high in Israel. In the Slovak Republic, tuition fees for bachelor’s or equivalent programmes are around USD 2 150, while public institutions do not charge tuition fees. Similarly, in Norway, tuition fees for bachelor’s and master’s degrees (combined) are around USD 5 700 in independent private institutions, while there are no tuition fees in public institutions.
In contrast, the difference between public institutions and government-dependent private institutions in average annual tuition fees at the bachelor’s or equivalent level is minimal in most countries with available data. Neither type of institution charges fees in Finland, Slovenia and Sweden, and private and public institutions charge very similar average tuition fees in Austria and Israel (Table C5.1).
Differentiation of tuition fees between national and foreign students
National policies on tuition fees generally cover all students studying in the country’s educational institutions, including foreign students (see Definitions section). However, tuition fees may be higher for foreign students, and differences between national and foreign students in fees can have an impact on the international flows of students, as can other factors, such as public support from their home countries (OECD, 2017[1]). These differences can attract students to study in some countries and discourage them from studying in others (see Indicator B6), especially in a context where an increasing number of OECD countries are charging higher tuition fees for foreign students than for national ones. However, tertiary education in countries with higher fees for foreign students can still be attractive because of the quality and prestige of their educational institutions or the expected labour-market opportunities in the country after graduation.
National and foreign students generally pay similar tuition fees in Chile, France, Greece, Israel, Italy, Japan, Korea, Norway, the Slovak Republic and Spain (Table C5.1). In European Union (EU) and European Economic Area (EEA), countries charge the same tuition fees to nationals and students from other EU and EEA countries.
In some countries, however, the difference in tuition fees for national and foreign students can be significant. For instance, at the bachelor’s level, in Australia, Canada and the United States, public institutions charge on average over USD 13 900 more per year for foreign students than for national students (Table C5.1). In the United States, international students and national students who study outside their state pay higher tuition fees than in-state students. In Austria, the average tuition fees charged by public institutions to students who are not citizens of EU or EEA countries are twice as high as those for national students (for bachelor's, master's and doctoral or equivalent programmes). These fees, however, remain moderate (around USD 1 850 per year for foreign students). In Sweden, tuition is free for national students and those from the European Union, while non-EU students pay over USD 14 500 per year at the bachelor’s level. In Finland, as of academic year 2017/18, tuition fees were introduced for students who are not citizens of EU or EEA countries and who are enrolled in bachelor's or master's programmes taught in English.
Higher tuition fees do not necessarily discourage foreign students, however. For instance, in Australia, Austria and Canada, international or foreign students make up over 11% of students enrolled at the bachelor’s level, compared to only 4% on average across OECD countries (see Indicator B6).
Country approaches to funding tertiary education
OECD countries have different approaches to providing financial support to students enrolled in tertiary education. Despite policy changes over time within individual countries (Box C5.1), and differences across countries, national financing systems for higher education can be grouped together according to a number of common characteristics. Countries and economies can be roughly divided into four groups, depending on their level of tuition fees and the financial support available through the country’s student financial support system for tertiary education (OECD, 2015[2]):
Group 1: No tuition fees and generous student-support systems
This group includes all Nordic countries with available data: Denmark, Finland, Norway and Sweden. Students do not pay tuition fees for bachelor’s degrees in public institutions, and they have access to generous public subsidies for tertiary education, which help them cover their living costs. In these countries, more than 55% of students benefit from public/government-guaranteed loans, scholarships/grants or a combination of the two (Figure C5.3). These countries have more progressive tax structures and individuals face high income tax rates (Indicator A5 and (OECD, 2015[2])).
Group 2: High tuition fees and well-developed student-support systems
This group is composed of Australia, Canada, England (United Kingdom), New Zealand and the United States. In these countries and economies, the financial cost of entering tertiary education is relatively high (with annual tuition fees over USD 4 400 for bachelor’s degrees in public institutions), but students benefit from extensive financial support. In Canada, over 70% of students receive financial support for bachelor’s and master’s long first degrees, and this proportion exceeds 85% in Australia, England (United Kingdom), New Zealand and the United States (Figure C5.3).
England (United Kingdom) has moved into this group of countries since 1995, as both tuition fees and financial support to students increased significantly. The Netherlands is gradually moving towards this group from Group 1, as tuition fees have increased while its student-support system has developed (see Figure B5.1 in (OECD, 2014[3])). Israel lies between Group 1 and Group 2, as participation in tertiary education is based on relatively high levels of student support (two-thirds of students benefit from grants, scholarships or loans), with annual tuition fees reaching around USD 3 000 in public institutions at bachelor’s level (Table C5.1). In 2018, New Zealand began to move towards Group 1 by eliminating first-year fees for national students entering tertiary education for the first time. By 2024, three years of tertiary education will be free to all national first-time students.
Group 3: High tuition fees and less-developed student-support systems
In Chile (Figure C5.3), Japan and Korea (OECD, 2015[2]), students pay high tuition fees (over USD 4 800 per year) for bachelor’s programmes in public institutions, but student-support systems are somewhat less developed than in countries from Groups 1 and 2. However, Chile recently implemented important reforms to its tertiary education system. Access to tertiary education has become completely free of charge for low-income students. In addition, the maximum amount charged to students who do not benefit from free tuition fees is now regulated and the amount of resources allocated to tertiary education scholarships has increased. As for Japan, it recently adopted reforms to improve the financial support system to students, including a grant-type scholarship programme, increased interest-free student loans and an income-based repayment system (a flexible monthly repayment system after graduation). Similarly, financial support has been expanding in Korea, notably with the creation of income-contingent loans in 2010, and of a national grants/scholarships programme in 2012.
Group 4: Low or moderate tuition fees and less-developed student-support systems
This group includes most other European countries and economies for which data are available: Austria, the French Community of Belgium, France, Italy, Spain and Switzerland (Figure C5.3 and (OECD, 2015[2]). In these countries, average annual tuition fees for bachelor’s degrees in public institutions are low or moderate (below USD 2 600), and financial support is somewhat limited (targeting less than 45% of students).
Reforms related to the level of tuition fees and the availability of scholarships, grants and loans are highly debated in national education policy. They are often discussed in combination, as countries seek to improve or adjust how the public and private sectors (including students and their families) share the costs of tertiary education. Between the years 2007/08 and 2017/18, 15 out of 28 countries and economies with available information have undertaken tuition fee reforms. In 12 of them, these reforms in tuition fees were accompanied by changes in the level of public subsidies available to students (Table C5.4).
In about half of the countries with available data, tuition fees for bachelor’s degrees in public institutions increased by over 20% over the past decade. This is the case in some countries with high average annual tuition fees (fees over USD 4 400 in 2017/18) such as in Canada, England (United Kingdom), New Zealand and the United States, but also in countries with more moderate fees (fees below USD 2 600 in 2017/18) such as in the Netherlands, Spain and Switzerland.
In contrast, in countries that charged no tuition fees in 2007/08 (Denmark, Finland, Greece, Norway, the Slovak Republic and Slovenia), there was no change in tuition fees over the past decade. Similarly, in Austria and France, annual average tuition fees have remained fairly constant (at around USD 950 and USD 200 respectively). Finally, Chile is the only country with available data where there was a sharp reduction in tuition fees (from USD 8 050 to USD 7 500 per year).
Although there is little trend data available, it is also interesting to look at the change in the proportion of students benefiting from loans, scholarships/grants, or a combination of both. Among the countries that experienced a significant increase in tuition fees, in New Zealand, the share of students receiving financial support remained rather constant (at around 85%) over the past decade (Table C5.4). At the same time, the average annual amount of loans borrowed increased (from USD 6 400 to USD 7 600) while the average amount of grants/scholarships slightly decreased (from USD 5 700 to USD 5 100) (see Annex 3 for details).
In the two countries with data available that did not charge tuition fees in either 2007/08 or 2017/18, there was an increase in the share of students receiving financial support: from 69% to 83% in Denmark and from 55% to 58% in Finland (Table C5.4). In Denmark, both the average annual amount of loans borrowed and the amount of grants/scholarships increased, while in Finland there was an increase in the average annual amount of loans and a decrease in the amount of grants/scholarships (see Annex 3 for details).
Finally, in Chile, where tuition fees decreased significantly over the past decade, there was also a sharp increase in the percentage of students receiving public/government-guaranteed loans and/or grants/scholarships. This share went from 17% in 2007/08 to 58% in 2017/18, which is the biggest increase among countries with available data.
The level of tuition fees and financial support to students can have a significant impact on equity and access to tertiary education. Evidence suggests that charging high tuition fees while simultaneously giving students opportunities to benefit from comprehensive financial support systems can be a way for countries to increase access to tertiary education, make efficient use of limited public funds, and acknowledge the significant private returns that students receive from tertiary education (OECD, 2018[4]). For instance, Australia and New Zealand, which have particularly well-developed financial support systems (including income-contingent loans), also have above-average tertiary entry rates in spite of high tuition fees (see Indicator B4).
As for the high entry rates among some countries that charge no tuition fees, they may be due as much to their highly developed student financial support systems to cover living expenses, as to the absence of tuition fees (see Indicator B4). For instance, in Denmark and Norway – two countries with above-average tertiary entry rates – there are no tuition fees and more than 80% of students benefit from loans, scholarships/grants or a combination of both.
Note: Annual average (or most common) tuition fees charged by public institutions for national students at the bachelor's level are indicated in parenthesis (USD converted using PPPs). The year of reference may differ across countries and economies. Please see Annex 3 for details.
1. Tuition fees correspond to public institutions and government-dependent institutions combined.
2. Data on financial support corresponds to total tertiary instead of bachelor's and master's long first degree or equivalent.
3. The data on "public or government-guaranteed loans only" and "public scholarships/grants only" include anyone who received a loan or scholarship/grant in the reference year (although they may have received other forms of financial support as well).
4. Tuition fees include short-cycle tertiary programmes and bachelor's or equivalent programmes.
5. Estimates include universities only and exclude ISCED 6, such as postgraduate certificates and diplomas.
6. Tuition fees are presented for government-dependent institutions instead of public institutions.
Countries and economies are ranked in descending order of the share of students who do not benefit from public/government-guaranteed loans or scholarships/grants.
Source: OECD (2019), Table C5.2. See Source section for more information and Annex 3 for notes (https://doi.org/10.1787/f8d7880d-en).
Financial support to students, in the form of loans, grants and scholarships
A key question that many educational systems face is whether financial support for students in tertiary education should be provided primarily in the form of loans or in the form of grants or scholarships. On the one hand, advocates of student loans argue that they allow the number of students who can benefit from the available resources to be scaled up (OECD, 2014[3]). If the funding spent on scholarships and grants was used instead to guarantee and subsidise loans, the same public resources could target a larger number of students, and overall access to higher education would increase. Loans also shift some of the cost of education to those who benefit most from higher education, individual students, reflecting the high private returns of completing tertiary education (see Indicator A5).
On the other hand, student loans are less effective than grants in encouraging low-income students to access tertiary education. Opponents of loans argue that high levels of student debt at graduation may have adverse effects for both students and governments if large numbers of students are unable to repay their loans (OECD, 2014[3]). A large share of graduates with debt could be a problem if employment prospects are not sufficient to guarantee student loan repayments.
OECD governments support students’ living or education costs through different combinations of these two types of support – and these combinations vary even among countries with similar levels of tuition fees. The cross-country variation is significant, for instance, among countries and economies with high annual average tuition fees for bachelor’s degrees in public institutions (around USD 4 500 and over). In England (United Kingdom), more than 90% of students only receive loans (and not scholarships/grants) to cover the cost of their studies (in bachelor’s and master’s long first degrees). In the United States, 53% of students benefit from both loans and scholarships or grants, 26% from scholarships/grants alone and 10% from loans alone. In Australia and New Zealand, most students receive either loans alone or both loans and scholarships or grants; and in Canada, they receive loans, scholarships/grants, or a combination of both. (Figure C5.3).
In countries with available data where public institutions charge no tuition fees at the bachelor’s level, most students receive financial support in the form of both loans and scholarships or grants, in order to cover their living costs. This is true for 58% of students in Finland and around 75% in Norway and Sweden. In contrast, in Denmark, most students receive financial support in the form of scholarships/grants alone (58%), and only 27% receive both loans and scholarships or grants.
Finally, in countries and economies such as Austria, the French Community of Belgium, Italy, Portugal, Spain and Switzerland, where annual average tuition fees for bachelor’s degrees are below USD 2 000, less than 45% of students receive any form of financial support – and those who do tend to receive it in the form of grants or scholarships only.
Type of loans systems, amounts borrowed and debt at graduation
There are two main types of student loans: mortgage-style loans and income-contingent loans. In a mortgage-style loan system, students are obliged to repay the loan within a fixed period, regardless of their financial situation after their studies. This may impose a heavy financial burden on graduates (or those who did not graduate) with low incomes. In contrast, in income-contingent loan systems, repayment is conditional on the borrower’s income reaching a threshold, and includes debt forgiveness after a certain period of time. This type of repayment arrangement is considered to be more equitable, as it takes into account graduates’ ability to repay their loan.
Both systems imply some costs for the government that guarantees the loan repayment. However, the potential financial burden for the government is more uncertain with income-contingent loans, as these are contingent on graduates’ ability to find work and earn income above the minimum threshold for reimbursement.
Several countries have introduced income-contingent loans in recent years. For example, the United Kingdom replaced its mortgage-loan system with an income-contingent loan system in 1999 – and nowadays as much as 45% of student loans are not repaid. With the increase in student debt, some income-contingent loan systems were also introduced in the United States: the income-based repayment programme in 2009 and the Pay-As-You-Earn (PAYE) plan in 2012 (Table C5.3 and (OECD, 2015[2]). Among countries with available data, Australia, Chile and New Zealand have also adopted an income-contingent loan system. Japan, Korea and the Netherlands exhibit a hybrid system, which includes both income-contingent and mortgage-style loans (Table C5.3).
Previous sections have highlighted cross-country variations in the proportion of students benefiting from a loan; but there is also variation in the average annual amount borrowed by each student. Among countries and economies where most students receive loans (70% of students or more), this ranges from around USD 5 600 per year in Australia to around USD 7 000 in New Zealand and Sweden, USD 10 400 in Norway, and up to USD 17 000 in England (United Kingdom). Similarly, in countries where about 25% to 35% of students receive loans (Canada, Chile, Denmark and Japan), the average annual amount borrowed ranges from around USD 3 900 in Denmark to around USD 7 700 in Japan (Table C5.3).
The debt burden that students accumulate is one factor that may affect individuals’ decisions to invest in tertiary education. The extent to which debt can be an issue for graduates mostly depends on the amount borrowed and the underlying loan conditions compared to graduates’ labour-market prospects, in terms of earnings and uncertainty of employment.
Among the countries and economies with high tuition fees, in Australia, England (United Kingdom) and New Zealand, at least 70% of students are in debt at graduation as a result of taking loans. However, the average amount of debt at graduation varies significantly, from USD 10 500 in Australia to USD 24 100 in New Zealand and over USD 49 800 in England (United Kingdom). In countries where tertiary studies entail no or low tuition fees, debt at graduation would typically be lower than in countries with high tuition fees, since student loans are mainly needed to cover students’ living expenses. However, in Nordic countries, where there are low or no tuition fees, the level of student debt at graduation may still be high because living expenses are high. This is the case for instance in Norway, where students’ average debt amounts to over USD 28 700 (Table C5.3).
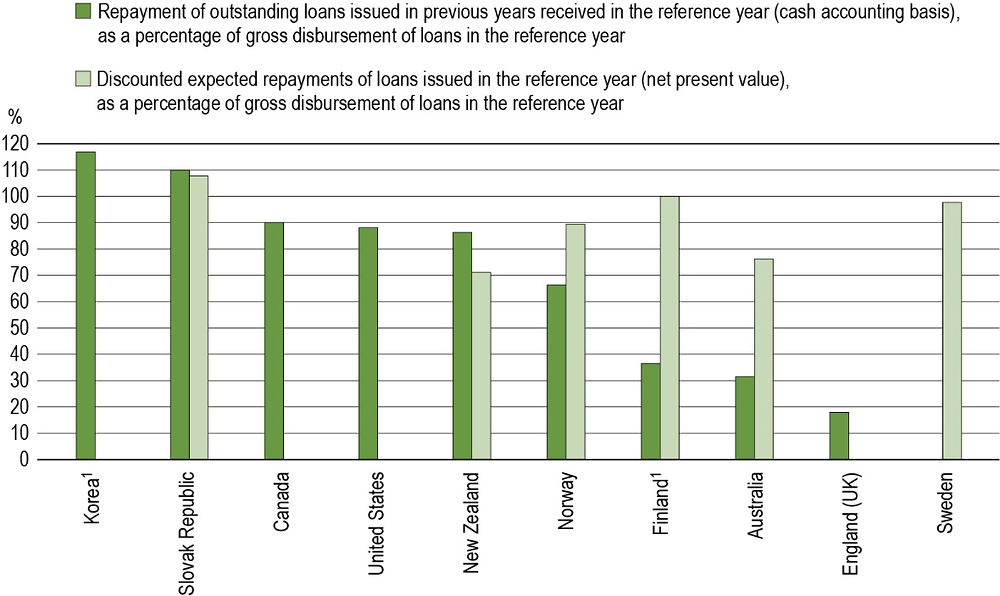
For some countries and economies, student public loans have become an important element of student support. The variety of loan systems and repayment schemes across the world can present some challenges in assessing the actual financial contribution of the public sector. To improve the comparability, an approach is to estimate the repayment of loans. Two methods may be considered for this analysis:
Cash accounting basis: This method considers the repayment in the reference year of loans issued in previous years. This figure is shown as a percentage of gross disbursement of loans in the reference year in Figure C5.a.
Net present value: This method tries to capture the current choices made by governments by measuring the expected repayment levels of loans issued in the reference year. The measure presented in Figure C5.a is the discounted expected repayment of loans issued in the reference year, as a percentage of the gross disbursement of loans in the reference year.
These two methods may yield very different results for a given country, because they are based on different time periods and student cohorts. The cash accounting basis compares earlier loans (repayment of loans issued in previous years) with current loans (disbursement of loans in the reference year). In other words, this approach compares loans for several cohorts: 1) students who borrow loans in the reference year; and 2) people who are repaying loans in the same year. In countries with well-established loans systems, the number of students who are repaying loans in the reference year can be significantly higher than the number of students who borrow money.
On the other hand, the net present value approach focuses on current loans (disbursement of loans in the reference year and their expected repayment). In other words, it takes into account the amounts of loans borrowed by students in the reference year and an estimation of the future repayment by the same cohort.
Figure C5.a shows significant cross-country variation in the repayment of student loans, particularly when using the cash accounting basis. In Australia, England (United Kingdom) and Finland, the repayment of outstanding loans received in the reference year represents less than 40% of the gross disbursement of loans issued that year. This value rises to around 65% in Norway and around 90% in Canada and the United States. In Korea and the Slovak Republic, it even exceeds 100% (with values of 117% in Korea and 110% in the Slovak Republic).
The results observed may reflect the maturity of student loans programmes: older programmes may have a large number of people repaying student loans compared to those currently receiving loans, while newer programmes may have relatively few people in the repayment phase of loans. High values may also reflect a decrease in financial support to students in the reference year compared to previous years (e.g. lower average amounts of loans, lower number of students benefiting from a loan etc.), or a high repayment of loans issued in previous years. In Korea, for instance, the high value (117%) reflects 1) the high number of people repaying loans in the reference year compared to students borrowing loans in the same year; 2) the increased reliance on scholarships rather than students loans; and 3) the increased amount of loan repayments
It is important to note that loan repayments are not necessarily re-allocated to education. In fact, Korea is the only country with available data where it is clearly stated that 100% of loan repayments are re-allocated to student loans.
Considering the net present value of loans, in Australia and New Zealand, between 70% and 75% of student loans issued in the reference year are expected to be repaid. In contrast, this proportion reaches around 90% in Norway and around 100% in Finland and Sweden. In the Slovak Republic, it even exceeds 100% due to interest rates.
Note: The numbers in this figure should be interpreted with caution as they are based on estimations. The year of reference may differ across countries. Please see Annex 3 for details.
1. Government-guaranteed private loans instead of public loans.
Countries and economies are ranked in descending order of the percentage of student loans repaid based on the cash accounting basis methodology.
Source: OECD (2019). See Source section for more information and Annex 3 for notes (https://doi.org/10.1787/f8d7880d-en).
Definitions
In this chapter, national students are defined as the citizens of a country who are studying within that country. Foreign students are those who are not citizens of the country in which the data are collected. While pragmatic and operational, this classification is inappropriate for capturing student mobility because of differing national policies regarding the naturalisation of immigrants. For countries that are members of the European Union (EU), citizens from other EU countries usually have to pay the same fees as national students. In these cases, foreign students refer to students that are citizens from countries outside the European Union. Further details on these definitions are available in Indicator B6.
Methodology
Amounts of tuition fees and amounts of loans in national currency are converted into equivalent USD by dividing the national currency by the purchasing power parity (PPP) index for GDP. The amounts of tuition fees and associated proportions of students should be interpreted with caution, as they represent the weighted averages of the main tertiary programmes and may not cover all educational institutions.
Student loans include the full range of student loans extended or guaranteed by governments, in order to provide information on the level of support received by students. The gross amount of loans provides an appropriate measure of the financial aid to current participants in education. Interest payments and repayments of principal by borrowers should be taken into account when assessing the net cost of student loans to public and private lenders. In most countries, loan repayments do not flow to education authorities, and the money is not available to them to cover other expenditure on education.
OECD indicators take the full amount of scholarships/grants and loans (gross) into account when discussing financial aid to current students. Some OECD countries have difficulty quantifying the amount of loans to students. Therefore, data on student loans should also be treated with caution.
For more information please see the OECD Handbook for Internationally Comparative Education Statistics 2018 (OECD, 2018[5]) and Annex 3 for country-specific notes (https://doi.org/10.1787/f8d7880d-en).
Source
Data refer to the school year 2017/18 and are based on a special survey administered by the OECD in 2019 (for details see Annex 3 at https://doi.org/10.1787/f8d7880d-en).
Note regarding data from Israel
The statistical data for Israel are supplied by and are under the responsibility of the relevant Israeli authorities. The use of such data by the OECD is without prejudice to the status of the Golan Heights, East Jerusalem and Israeli settlements in the West Bank under the terms of international law.
References
[4] OECD (2018), Education at a Glance 2018: OECD Indicators, OECD Publishing, Paris, https://dx.doi.org/10.1787/eag-2018-en.
[5] OECD (2018), OECD Handbook for Internationally Comparative Education Statistics: Concepts, Standards, Definitions and Classifications, OECD Publishing, Paris, https://dx.doi.org/10.1787/9789264304444-en.
[1] OECD (2017), “Tuition fee reforms and international mobility”, Education Indicators in Focus, No. 51, OECD Publishing, Paris, https://doi.org/10.1787/2dbe470a-en.
[2] OECD (2015), Education at a Glance 2015: OECD Indicators, OECD Publishing, Paris, https://dx.doi.org/10.1787/eag-2015-en.
[3] OECD (2014), Education at a Glance 2014: OECD Indicators, OECD Publishing, Paris, https://dx.doi.org/10.1787/eag-2014-en.
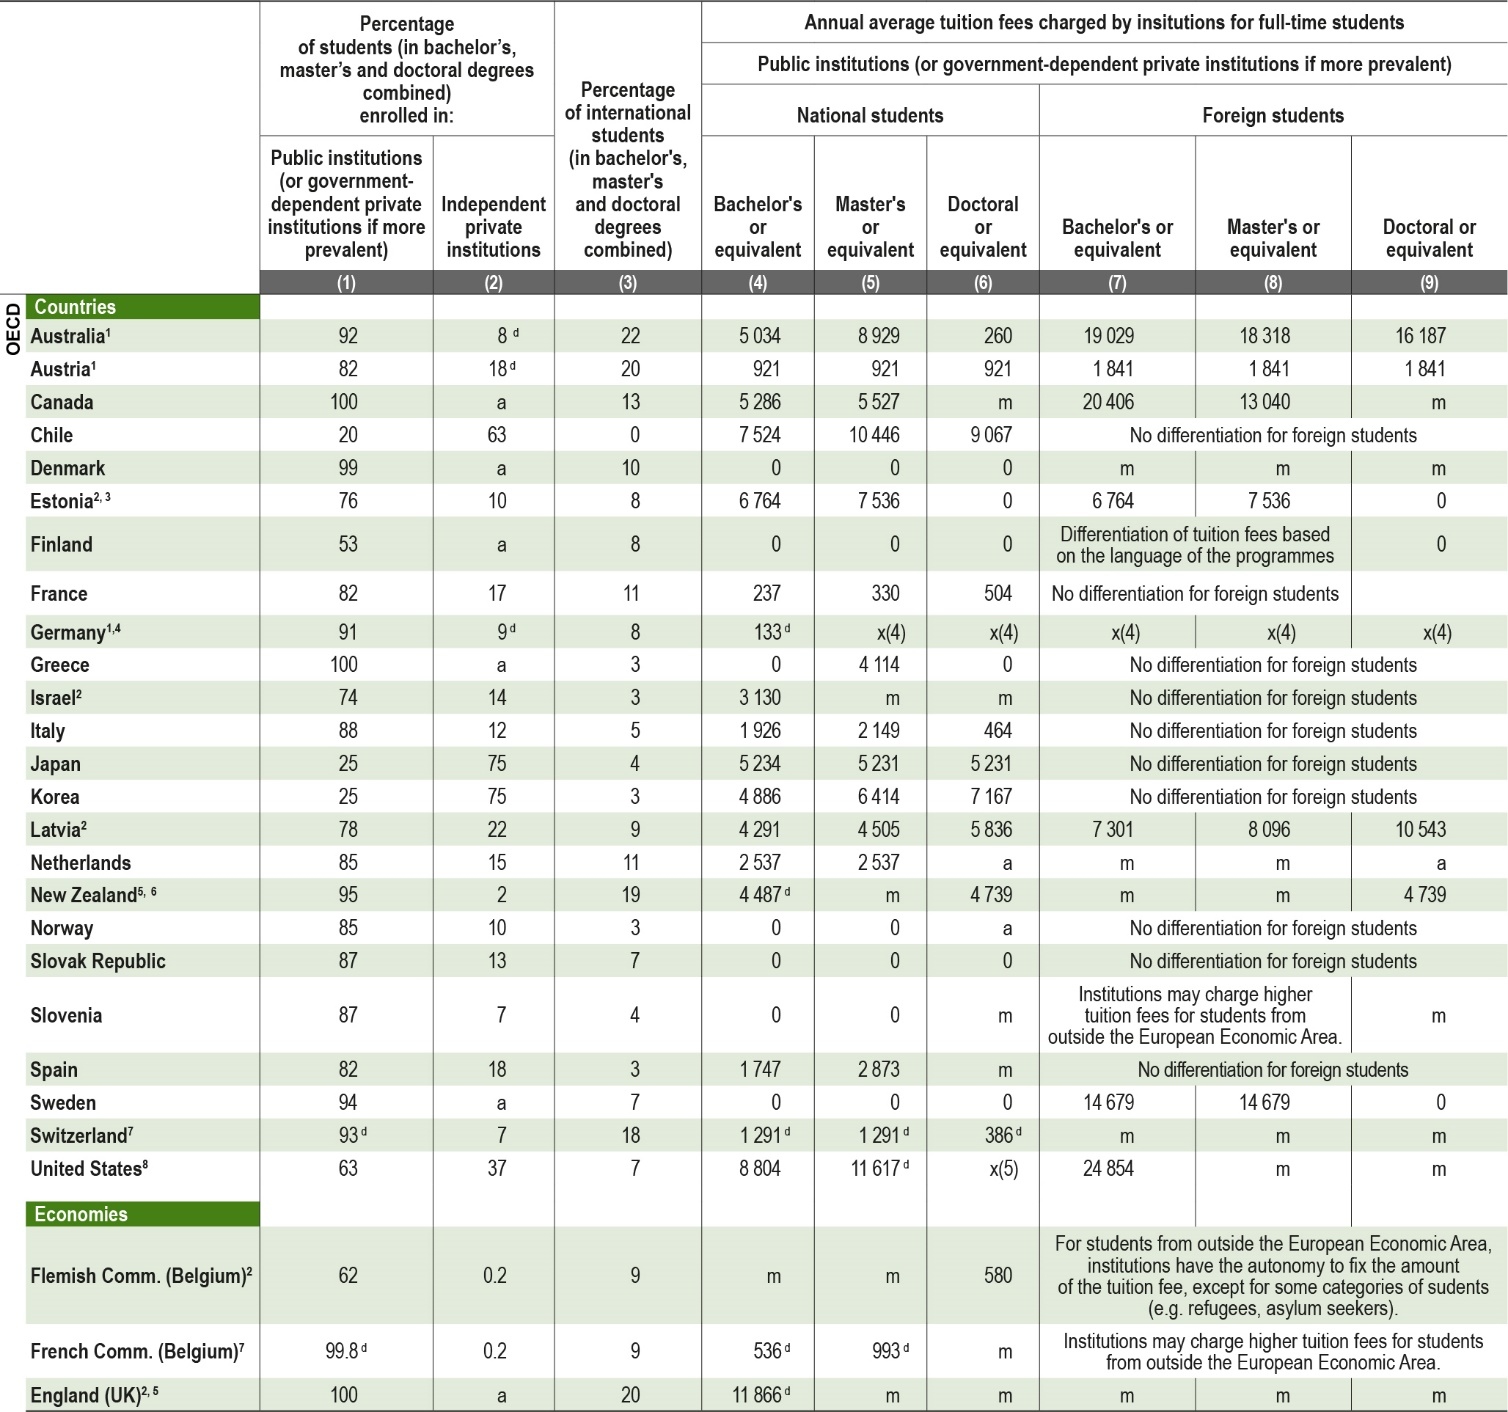
Table C5.1 Annual average (or most common) tuition fees charged by tertiary institutions to national and foreign students (2017/18)
Table C5.2 Tuition fees charged by institutions for full-time students, in USD converted using PPPs, and percentage of national students receiving financial support (2017/18)
Table C5.3 Public loans to students, repayment and remission in tertiary education (2017/18)
Table C5.4 Changes in tuition fee policies and public support to students (2007/08 to 2017/18)
Cut-off date for the data: 19 July 2019. Any updates on data can be found on line at https://doi.org/10.1787/eag-data-en. More breakdowns can also be found at http://stats.oecd.org/, Education at a Glance Database.
StatLink: https://doi.org/10.1787/888933981134
Table C5.1. Annual average (or most common) tuition fees charged by tertiary institutions to national and foreign students (2017/18) |
|---|
In equivalent USD converted using PPPs, by type of institutions and level of education |
 |
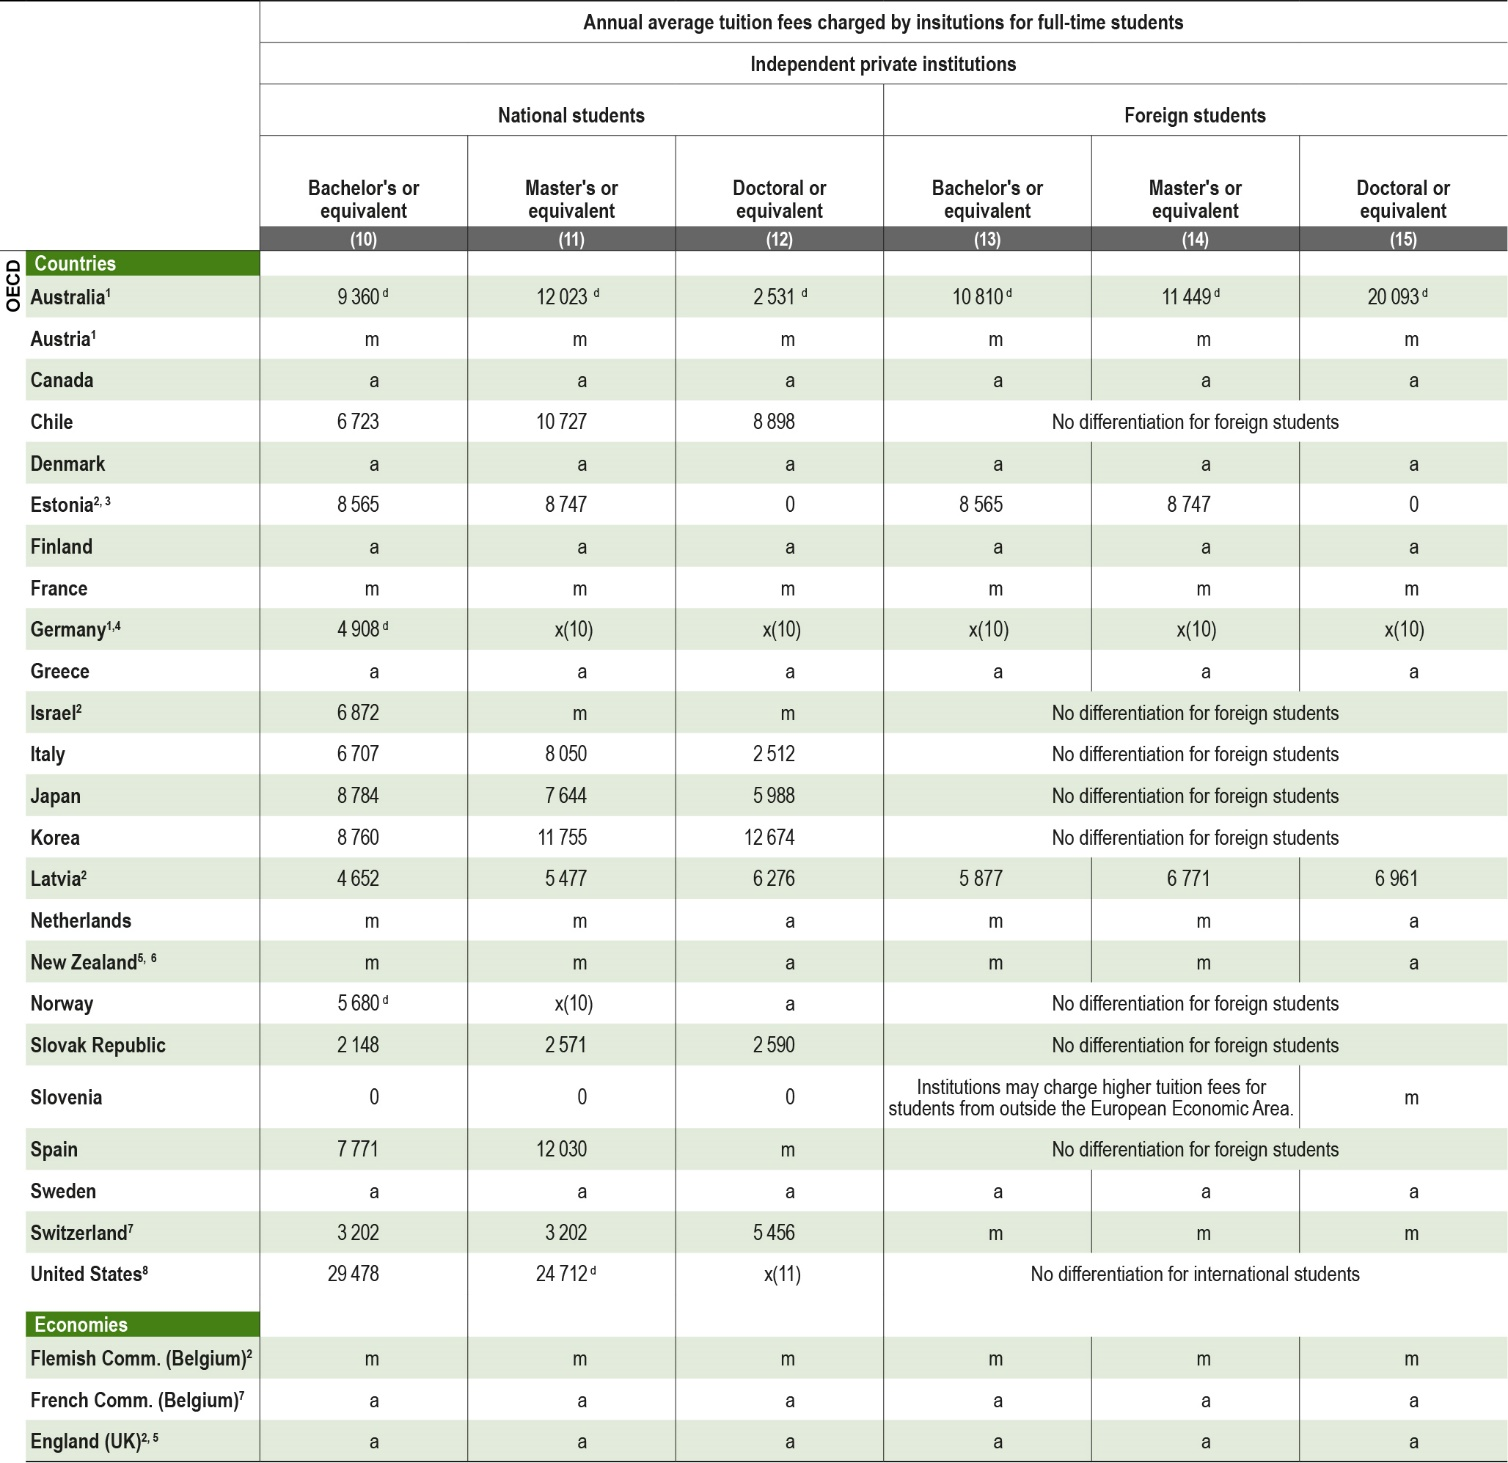 |
Note: Enrolment data is presented for the year 2016/17. The year of reference may differ across countries. Please see Annex 3 for details. For European countries, tuition fees for foreign students refer to students from outside the European Economic Area. For institutions charging no tuition fees, the fees are shown as 0. |
The detailed disaggregation by type of institution is available on line (see StatLink below). |
1. Government-dependent institutions are included in independent private institutions. For Austria and Germany, government-dependent institutions are included in independent private institutions for enrolment data only. |
2. Government-dependent institutions instead of public institutions. |
3. Institutions have the autonomy to fix the amount of the tuition fee for degree programmes with study language other than Estonian, in public and government-dependent private institutions. |
4. Tuition fees are presented for total tertiary education instead of bachelor's or equivalent level. Only academic programmes are included. |
5. Short-cycle tertiary programmes are included in bachelor's or equivalent programmes. |
6. Estimates include universities only and exclude ISCED 6, such as postgraduate certificates and diplomas. |
7. Government-dependent private institutions are included in public institutions. |
8. Tuition fees for foreign students typically refer to tuition fees for out-of-state national students. However, in a minority of institutions, tuition fees can be lower for out-of-state national students. |
Source: OECD (2019). See Source section for more information and Annex 3 for notes (https://doi.org/10.1787/f8d7880d-en). |
Please refer to the Reader's Guide for information concerning symbols for missing data and abbreviations. |
Table C5.2. Tuition fees charged by institutions for full-time students, in USD converted using PPPs, and percentage of national students receiving financial support (2017/18) |
|---|
Bachelor's only for tuition fees, and bachelor's and master's long first degrees or equivalent programmes for financial support |
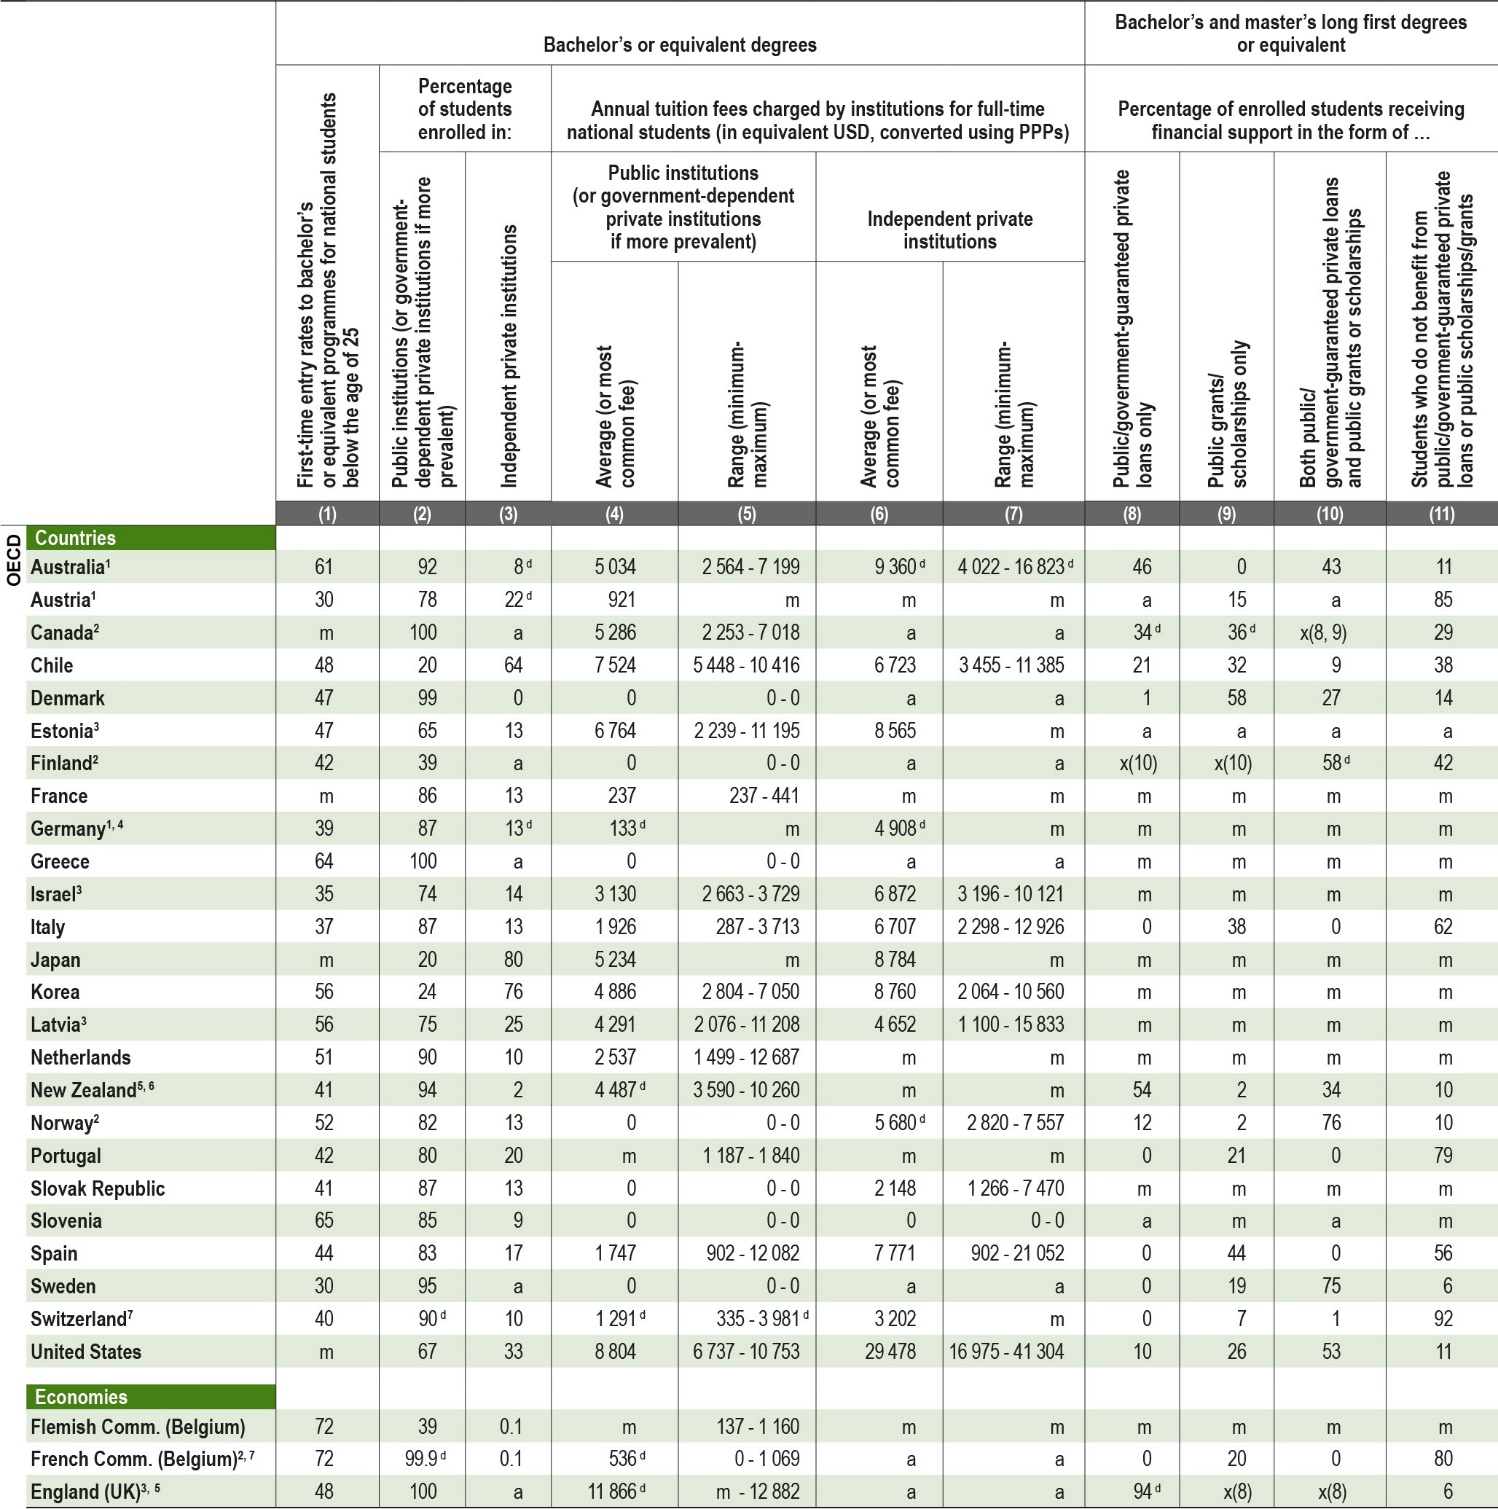 |
Note: Enrolment data is presented for the year 2016/17. The year of reference may differ across countries. Please see Annex 3 for details. For institutions charging no tuition fees, the fees are shown as 0. |
The detailed disaggregation by type of institution is available on line (see StatLink below). |
1. Government-dependent private institutions are included in independent private institutions. For Austria and Germany, government-dependent institutions are included in independent private institutions for enrolment data only. |
2. Data on financial support corresponds to total tertiary instead of bachelor's and long-cycle master's degrees or equivalent. |
3. Data is presented for government-dependent institutions instead of public institutions. |
4. Tuition fees are presented for total tertiary education instead of bachelor's or equivalent level. Tuition fees correspond to national and foreign students. Only academic programmes are included. |
5. Short-cycle tertiary programmes are included in bachelor's or equivalent programmes. |
6. Estimates include universities only and exclude ISCED 6, such as postgraduate certificates and diplomas. |
7. Government-dependent private institutions are included in public institutions. |
Source: OECD (2019). See Source section for more information and Annex 3 for notes (https://doi.org/10.1787/f8d7880d-en). |
Please refer to the Reader's Guide for information concerning symbols for missing data and abbreviations. |
Table C5.3. Public loans to students, repayment and remission in tertiary education (2017/18) |
|---|
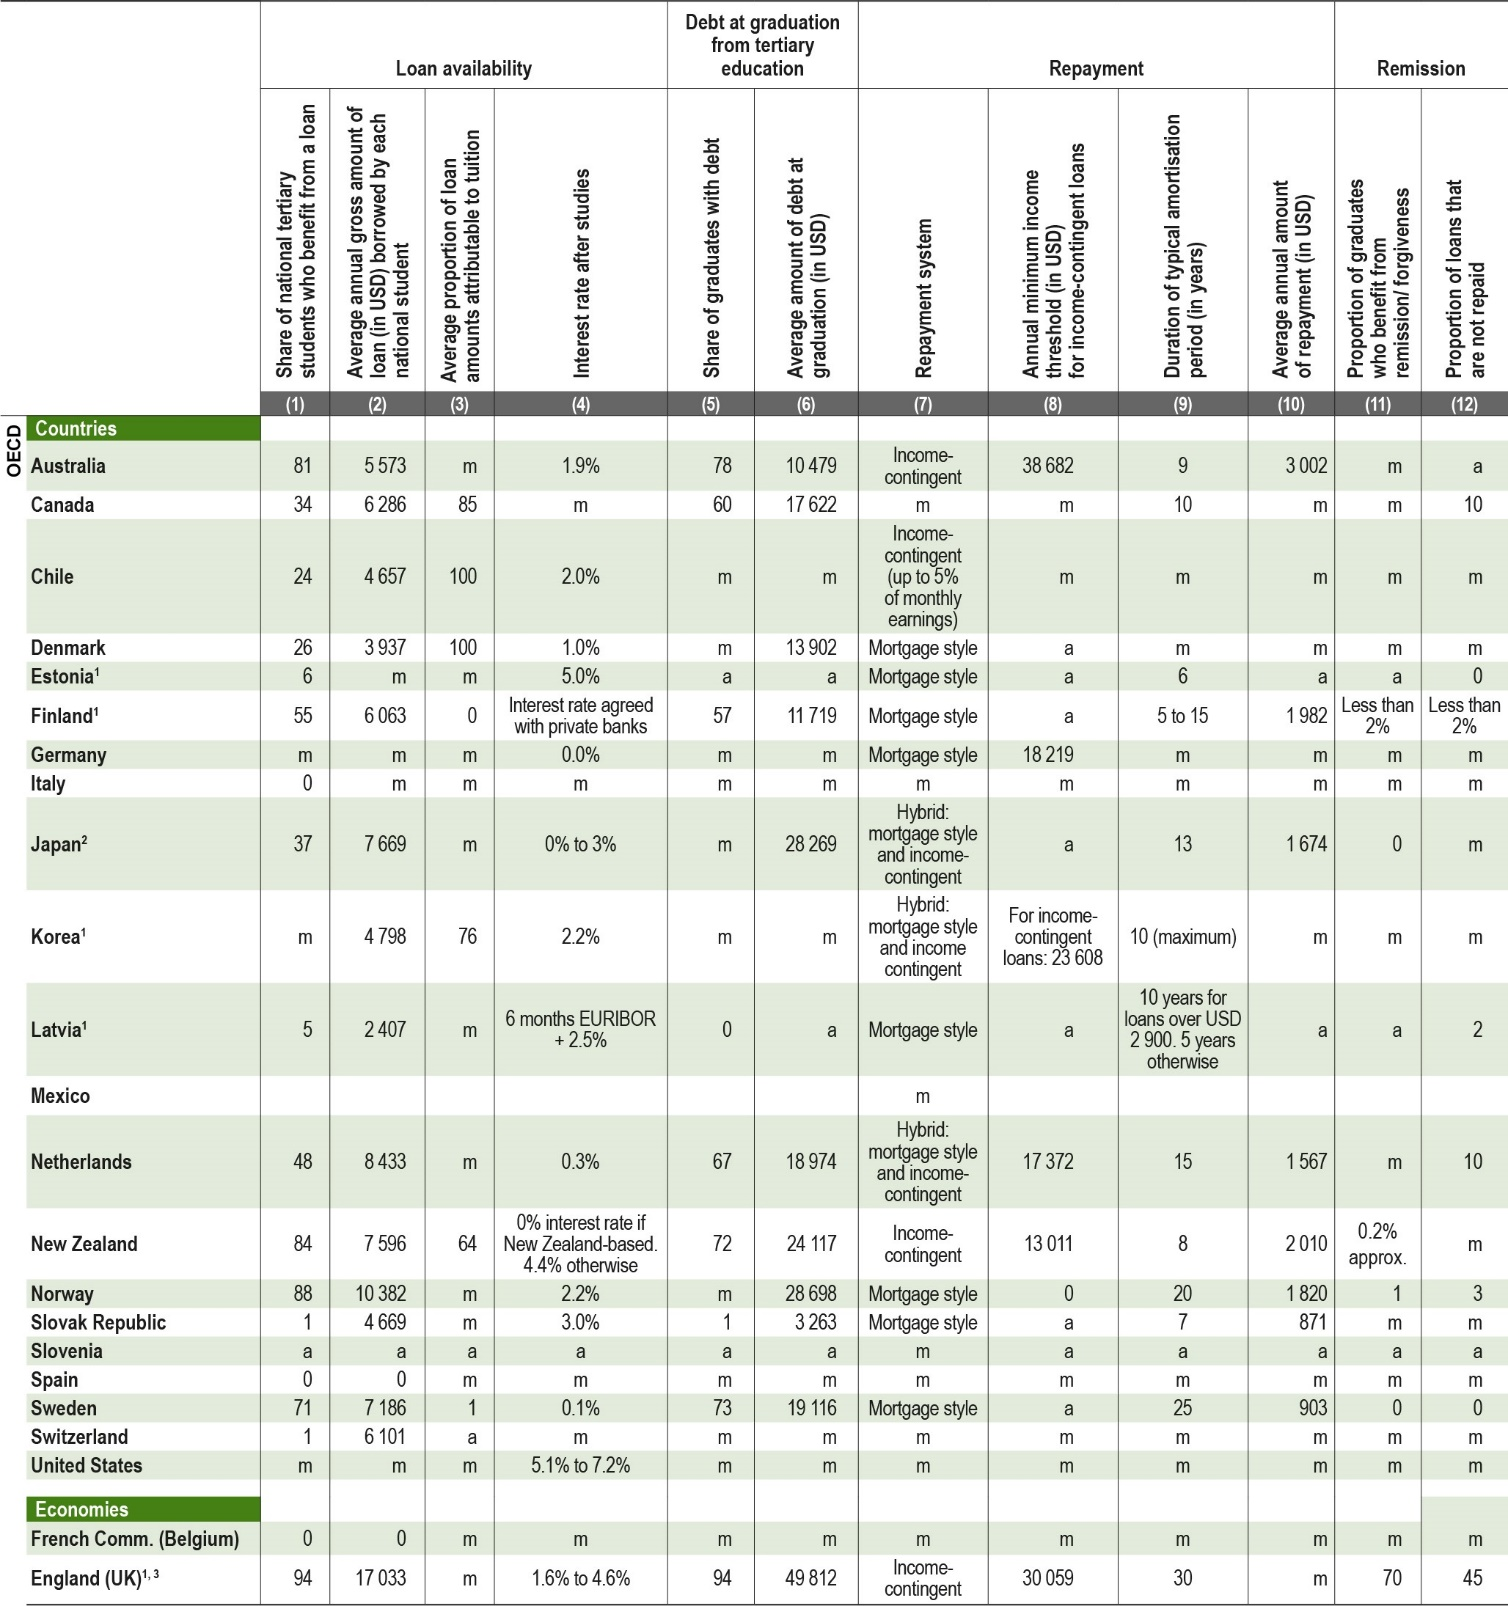 |
Note: The year of reference may differ across countries. Please see Annex 3 for details. |
1. Information on debt, repayment and remission refer to government-guaranteed private loans instead of public loans. |
2. The two types of repayment are: fixed payment (depending on the total amount of loan and numbers of repayment times) and income-contingent payment (depending on students' incomes in the previous year). |
3. The share of students who benefit from a loan and the average annual amount of loan are presented for short-cycle tertiary, bachelor's and long-cycle master's degrees. |
Source: OECD (2019). See Source section for more information and Annex 3 for notes (https://doi.org/10.1787/f8d7880d-en). |
Please refer to the Reader's Guide for information concerning symbols for missing data and abbreviations. |
Table C5.4. Changes in tuition fee policies and public support to students (2007/08 to 2017/18) |
|---|
Tuition fees in equivalent USD converted using PPPs (2017 constant prices), full-time national students |
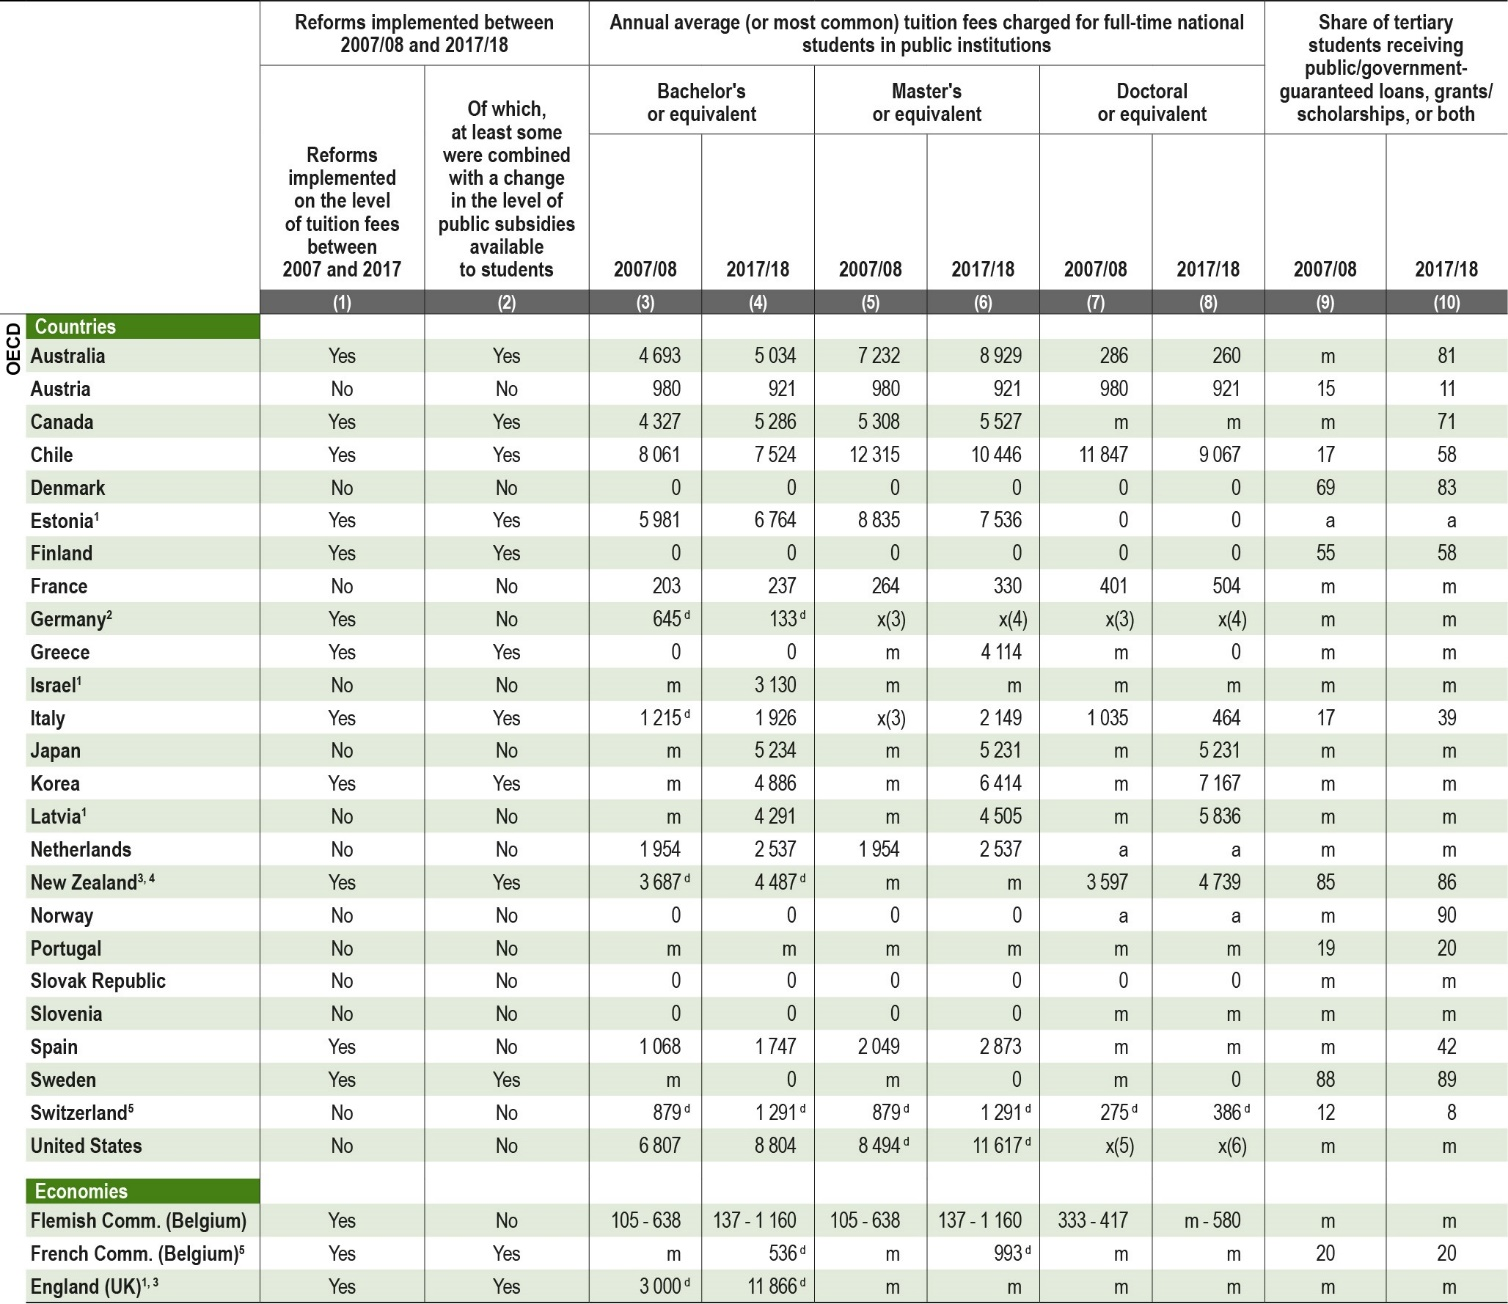 |
Note: The year of reference may differ across countries. Please see Annex 3 for details. |
1. Government-dependent institutions instead of public institutions. |
2. Tuition fees are presented for total tertiary education instead of bachelor's or equivalent level. Tuition fees correspond to national and foreign students. Only academic programmes are included. |
3. Short-cycle tertiary programmes are included in bachelor's or equivalent programmes. |
4. Estimates include universities only and exclude ISCED 6, such as postgraduate certificates and diplomas. |
5. Government-dependent private institutions are included in public institutions. |
Source: OECD (2019). See Source section for more information and Annex 3 for notes (https://doi.org/10.1787/f8d7880d-en). |
Please refer to the Reader's Guide for information concerning symbols for missing data and abbreviations. |
