
copy the linklink copied!Indicator C1. How much is spent per student on educational institutions?
On average, OECD countries spend 1.7 times more per student at the tertiary level than in non-tertiary education (primary, secondary and post-secondary non-tertiary levels). OECD countries spend on average USD 10 500 per student on primary to tertiary educational institutions. This represents about USD 9 400 per student at primary, secondary and post-secondary non-tertiary level, and USD 15 600 at tertiary level.
In non-tertiary education, spending on core educational services represents 93% of institutions’ expenditure per student. At the tertiary level, a much lower share of institutional expenditure goes to core services (67%), while roughly 30% of total educational expenditure per student goes on research and development (R&D).
The cumulative expenditure per student from the age of 6 to 15 amounts to about USD 93 000 on average across OECD countries.
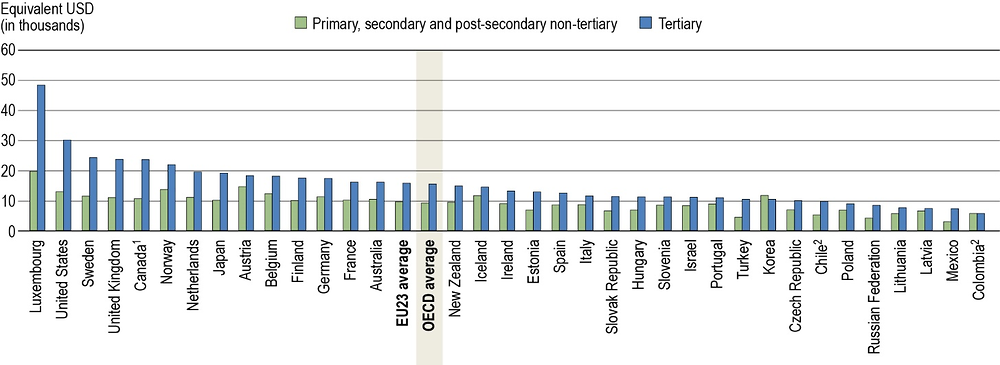
1. Primary education includes pre-primary programmes. Post-secondary non-tertiary figures are treated as negligible.
2. Year of reference 2017.
Countries are ranked in descending order of the total expenditure per student on tertiary education.
Source: OECD/UIS/Eurostat (2019), Table C1.1. See Source section for more information and Annex 3 for notes (https://doi.org/10.1787/f8d7880d-en).
Context
The willingness of policy makers to expand access to educational opportunities and to provide high-quality education can translate into higher costs per student and must be balanced against other demands on public expenditure and the overall tax burden. As a result, the question of whether the resources devoted to education yield adequate returns features prominently in public debate. Although it is difficult to assess the optimal volume of resources needed to prepare each student for life and work in modern societies, international comparisons of spending on educational institutions per student can provide useful reference points (see Definitions and Methodology sections).
This indicator provides an assessment of the investment in each student. Expenditure per student on educational institutions is influenced by teachers’ salaries (see Indicators C7 and D3), pension systems, instructional and teaching hours (see Indicators C7, D1 and D4), the cost of teaching materials and facilities (see Indicator C6), the programme provided (e.g. general or vocational) and the number of students enrolled in the education system (see Indicator B1). Policies to attract new teachers, reduce average class sizes or change staffing patterns (see Indicator D2) have also affected per-student expenditure. Ancillary services and R&D activities also influence the level of expenditure per student.
At primary and secondary levels, educational expenditure is dominated by spending on instructional services. At the tertiary level, other services, particularly those related to ancillary services or R&D activities, can account for a significant proportion of educational spending.
Other findings
On average, total expenditure per student is higher in private institutions than in public ones. Total expenditure in primary to tertiary public institutions amounts to over USD 10 300 per student, compared to USD 10 800 in private ones (Table C1.5, available on line).
From 2010 to 2016, expenditure on non-tertiary educational institutions increased by 5% on average across OECD countries, while the number of students remained stable over this period. This resulted in an increase of 5% in expenditure per student over the same period.
Annual expenditure per student on educational institutions as a share of gross domestic product (GDP) per capita amounts to 23% at primary, secondary and post-secondary non-tertiary levels on average across OECD countries. The figure is much higher at tertiary level, where countries spend on average 38% of GDP per capita on funding short-cycle, bachelor’s, master’s and doctoral students.
Analysis
Expenditure per student on educational institutions at different levels of education
Annual expenditure per student on educational institutions between primary and tertiary education provides an assessment of the investment made in each student. In 2016, annual spending per student from primary to tertiary education ranged from around USD 3 600 or slightly more in Colombia and Mexico to more than USD 15 000 in Austria, Norway and the United States and nearly USD 22 000 in Luxembourg (Table C1.1 and Figure C1.1). Across the OECD, countries spend on average USD 10 500 per student on primary to tertiary educational institutions.
The way resources are allocated across the different levels of education vary widely and largely reflect the mode of educational provision. Education still essentially takes place in settings with generally similar organisation, curricula, teaching style and management. These shared features have tended to result in similar patterns of expenditure per student from primary to post-secondary non-tertiary levels. In recent decades, however, greater use of private funds for tertiary education has modified the allocation of expenditure at this level compared to lower ones (see Indicator C3, and Table C1.5, available on line). In 2016, OECD countries on average spent around USD 9 400 per student at the primary, secondary and post-secondary non-tertiary levels and USD 15 600 at the tertiary level, although at this level, the average is affected by high expenditure in a few countries, most notably Canada, Luxembourg, Norway, Sweden, the United Kingdom and the United States (Table C1.1 and Figure C1.1). These differences lead to large differences in the cumulative expenditure per student over the theoretical duration of studies (Table C1.6, available on line). Significant differences are also observed at the subnational level (Box C1.1).
Annual expenditure per student can be quite heterogeneous across countries with large differences across regions. Among the three countries with available data at subnational level, Canada has the highest variation in annual expenditure per student on educational institutions at primary and secondary levels combined: the region with the highest value (USD 23 000) spends almost three times as much per student as the region with the lowest value (USD 8 000). Regional differences were the smallest in Belgium and Germany (OECD, 2019[1]).
An examination of regional differences in spending on primary and secondary education presents contrasting patterns. In Germany, 8 of the 12 Länder that spent less than the national average per student were located in the western part of the country. This may be explained by the sharp demographic downturn in the eastern Länder that led to a reduction in the number of students enrolled (OECD, 2019[1]).
To ensure comparability across countries, expenditure figures were converted into common currency (USD) using national purchasing power parities (PPPs). However, differences in the cost of living within countries were not taken into account.
The distribution of expenditure at different levels of education reflects governments’ priorities and the relative costs of education provision. Expenditure per student on educational institutions rises with the level of education in almost all countries, but the range varies markedly across countries (Table C1.1). OECD countries spend on average 18% more per secondary student than they do per primary student. This percentage is 50% or above in Canada, the Czech Republic, France and the Netherlands, but countries invest more per primary student than they do per secondary student in Chile, Colombia, Iceland, Israel, Lithuania, the Slovak Republic, Slovenia and the United Kingdom, despite the fact that teacher’s salaries tend to increase with higher levels of education. Similarly, educational institutions in OECD countries spend an average of 31% more on each tertiary student (excluding R&D) than on each primary student. Turkey and the United States spend twice as much on a tertiary student (excluding R&D) than on a primary student (Table C1.1).
Expenditure per student on core education services, ancillary services and R&D
On average across OECD countries, expenditure on core education services (such as teaching costs and other expenditure related to education) represents 87% of total expenditure per student from primary to tertiary educational institutions and it exceeds 90% in Chile, Latvia and Poland. In about a third of OECD and partner countries with available data, annual expenditure on research and development (R&D) and ancillary services per student accounts for around 15% or more of the total annual expenditure per student on primary to tertiary institutions. In the Slovak Republic and Sweden, this reaches 20%.
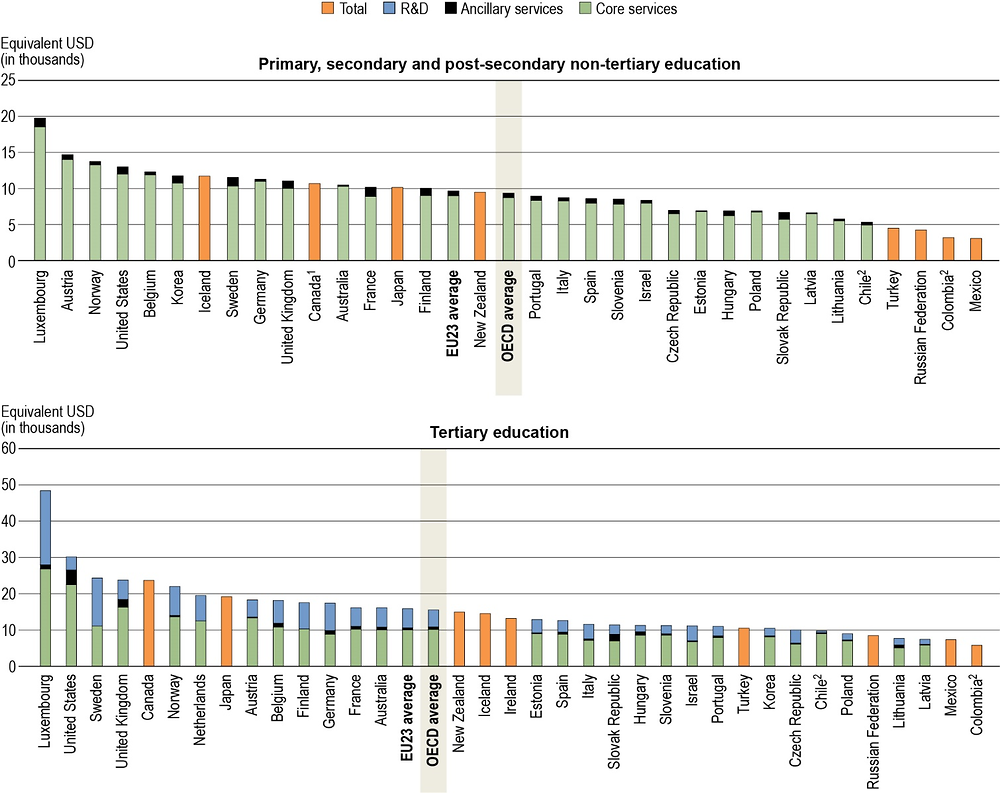
1. Primary education includes pre-primary programmes. Post-secondary non-tertiary figures are treated as negligible.
2. Year of reference 2017.
Countries are ranked in descending order of total expenditure on educational institutions per full-time equivalent student.
Source: OECD/UIS/Eurostat (2019), Table C1.2. See Source section for more information and Annex 3 for notes (https://doi.org/10.1787/f8d7880d-en).
However, this overall picture masks large variations across levels of education (Table C1.2 and Figure C1.2). At non-tertiary levels (primary, secondary and post-secondary non-tertiary), expenditure is dominated by spending on core education services. On average, OECD countries spend 93% of their total per-student expenditure (about USD 8 700) on core educational services at this level. However, in Finland, France, the Slovak Republic and Sweden, ancillary services account for 10% or slightly more of the expenditure per student (Table C1.2).
The share of total expenditure on educational institutions per student devoted to core services differs more across countries at tertiary level, as R&D expenditure can account for a significant proportion of educational spending (Table C1.2). On average across OECD countries, 67% of total expenditure on educational institutions at tertiary level goes to core services, while around 30% is spent on research and development. OECD countries in which R&D is mostly conducted in tertiary education institutions tend to report higher levels of expenditure per student than those where a large proportion of R&D is performed in other public institutions or in industry. Excluding R&D activities, average expenditure per student on average across OECD countries amounts to over USD 11 000, ranging from less than USD 6 000 in Lithuania and Mexico to more than USD 25 000 in Luxembourg and the United States.
On average across OECD countries, expenditure on R&D and ancillary services at the tertiary level represents 33% of all tertiary expenditure on educational institutions per student. In five of the OECD and partner countries for which data are available, expenditure on R&D and ancillary services in tertiary institutions is at least 40% of total expenditure on educational institutions per student, with Sweden (54%) the country with the highest share. However, the share of expenditure on ancillary services tends to be lower in tertiary education than at lower levels of education. On average, only 5% of expenditure on tertiary institutions goes towards ancillary services, and the amount is negligible (below USD 100 per student) in Austria, Chile, the Czech Republic, Estonia, Finland, Israel, Korea, Poland and Sweden. The United Kingdom and the United States spend the most in ancillary services per student at tertiary level among OECD countries, over USD 2 000 per student.
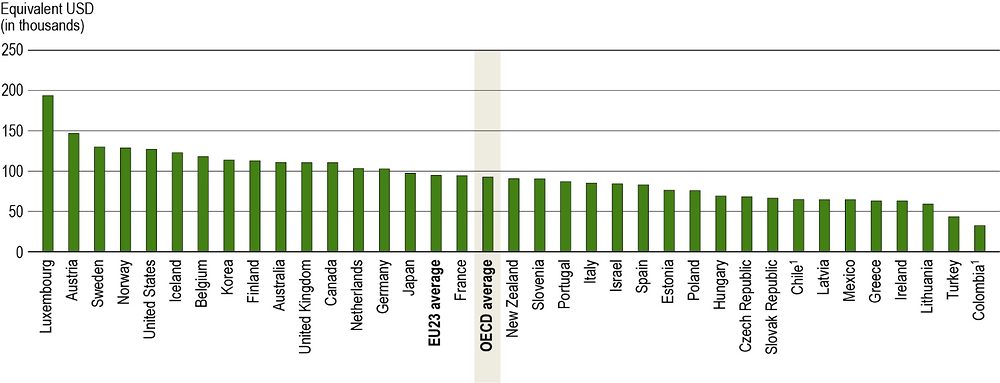
1. Year of reference 2017.
Countries are ranked in descending order of the total expenditure on educational institutions per student over the theoretical duration of primary and secondary studies between the age of 6 and 15.
Source: OECD/UIS/Eurostat (2019), Table C1.6, available on line. See Source section for more information and Annex 3 for notes (https://doi.org/10.1787/f8d7880d-en).
Policy makers are interested in the relationship between the resources devoted to education and the outcomes of their education systems (Box B1.1 in Education at a Glance 2017 (OECD, 2017[2])). The cost of education across countries depends not only on the annual expenditure per student, but also on the total duration of studies at each level and the level of enrolment. High expenditure per student, for example, might be offset by short programmes or limited access to education at certain levels. On the other hand, a seemingly inexpensive education system in per student terms can prove to be costly overall, if enrolment is high and students spend more time in school.
Primary and secondary education are usually compulsory across the OECD, and the cumulative expenditure per student between the ages of 6 and 15 at these levels shows how much it costs to teach a student on average during the course of current compulsory education (Figure C1.3 and Table C1.6, available on line). On average across OECD countries, the total cumulative expenditure per student from the age of 6 to 15 amounts to around USD 92 700 per student. Theoretical cumulative expenditure on educational institutions per student varies considerably among countries. Austria, Iceland, Luxembourg, Norway, Sweden and the United States spend over USD 120 000 per student over this period, while the figure is below USD 50 000 in Colombia and Turkey.
Expenditure per student on educational institutions relative to per capita GDP
Expenditure on educational institutions per student relative to gross domestic product (GDP) per capita is a measure of spending that takes into account the relative wealth of OECD countries. Since access to education in most OECD countries is universal (and usually compulsory) at lower levels of schooling, the amount spent per student as a share of per capita GDP can indicate whether the resources spent per student are proportionate to the country’s ability to pay. At higher levels of education, where student enrolment varies sharply among countries, the link is less clear. At tertiary level, for example, OECD countries may rank relatively high on this measure, even when a large proportion of their wealth is spent on educating a relatively small number of students.
In OECD countries, overall expenditure per student on educational institutions from primary to tertiary levels averages 26% of per capita GDP, which can be broken down into 23% at primary, secondary and post-secondary non-tertiary levels and 38% at the tertiary level (Table C1.4, available on line). Countries with low levels of expenditure per student may still be investing relatively large amounts as a share of per capita GDP. For example, although Portugal’s expenditure per student for all educational levels and its per capita GDP are both below the OECD average, it spends an above-average share of its per capita GDP per student at each educational level.
The relationship between per capita GDP and expenditure per student on educational institutions is difficult to interpret. However, there is a clear positive relationship between the two at non-tertiary educational levels. In other words, less wealthy countries tend to spend less per student than richer countries. Although the relationship is generally positive at these levels, there are variations even between countries with similar levels of per capita GDP, especially among countries where per capita GDP exceeds USD 30 000. Austria and the Netherlands, for example, have similar levels of per capita GDP (around USD 50 000; see Table X2.1 in Annex 2) but they allocate very different shares of their wealth to primary, secondary and post-secondary non-tertiary education. Austria spends 28% of per capita GDP on non-tertiary institutions (above the OECD average of 23%) while the Netherlands spends 22% (Table C1.4, available on line).
At tertiary level, there is more variation in spending and in the relationship between countries’ relative wealth and their level of tertiary expenditure. Spending on tertiary institutions in Canada, the United Kingdom and the United States represents more than 50% of per capita GDP for each student (Table C1.4, available on line). The high share for the United Kingdom is mostly the result of its high expenditure on R&D, which accounts for about one-fourth of total expenditure per student at this level (Table C1.2).
Changes in expenditure per student on educational institutions between 2010 and 2016
Changes in expenditure on educational institutions largely reflect changes in the size of the school-age population and in teachers’ salaries. Teachers’ salaries, the main component of educational costs, have increased in the majority of countries over the past decade (see Indicator D3). The size of the school-age population influences both enrolment levels and the amount of resources and organisational effort a country must invest in its education system. The larger this population, the greater the potential demand for education services. Changes in expenditure per student over the years may also vary between levels of education within countries, as both enrolment and expenditure may follow different trends at different levels of education.
At non-tertiary levels, the number of students has remained fairly stable on average across OECD countries between 2010 and 2016. During the same period, expenditure by non-tertiary educational institutions increased by an average of 5% (Table C1.3). As a result, expenditure per student at these levels increased by 5% in 2016 compared to its 2010 level. Most OECD countries spent more per student in 2016 than they did in 2010, with the exception of some countries that were heavily hit by the economic crisis of 2008 such as Australia, Estonia, Ireland, Italy, Slovenia and Spain. Expenditure per student increased by over 20% in Chile, Israel, and Latvia. In Chile, Latvia, Poland and the Slovak Republic, decreases in enrolments of more than 5% coincided with significant increases in spending on educational institutions per student between 2010 and 2016. In contrast, the increase in number of students enrolled was accompanied by a reduction in spending on educational institutions per student in Ireland, Slovenia and Spain.
Expenditure at tertiary level increased at a higher rate than at lower levels of education, rising on average by 9% between 2010 and 2016. It also increased more than the number of students enrolled over this period (3%). As a result, OECD countries recorded an average increase of 8% in expenditure per student over this period. However, there are stark differences across countries. Among OECD and partner countries with available data, Australia, Finland, France, Germany, Italy, Lithuania, Mexico, Portugal and Spain recorded a decrease in expenditure on tertiary education per student. In most of these countries, the decline was mainly the result of a rapid increase in the number of tertiary students. In contrast, expenditure per tertiary student increased in Estonia, Iceland and the Slovak Republic due to an increase in total expenditure and a reduction in the number of students at tertiary level (Table C1.3). Changes in expenditure on tertiary educational institutions can affect the allocation of resources across types of service, and in particular, the investment in core educational goods and services (Box C1.2).
Spending on educational core goods and services provides educational institutions with the necessary resources to accomplish their main mission, developing the skills of students. Comparing the change in expenditure on core services with the change in expenditure on all services provides a better understanding of how changes in total expenditure on institutions affect the funds available for core educational goods and services. This is particularly relevant at tertiary levels of education, where a greater share of total spending is allocated to services other than core educational goods and services, such as ancillary services or research and development (R&D). While there may be reasons to prioritise spending in these areas, a reduction in investment in educational core services might affect the quality of learning and the material conditions under which instruction takes place, particularly in countries where enrolment in tertiary education has increased significantly.
Between 2012 and 2016, the rate of change of expenditure on core educational services and total expenditure on tertiary educational institutions has varied significantly across countries (Figure C1.a). Total expenditure on tertiary institutions increased in two-thirds of OECD and partner countries during this period. In most of these, spending on core educational goods and services also increased, although to differing extents. Spending on core educational goods and services increased by at least 24 percentage points more than total spending on tertiary institutions in Estonia and the Slovak Republic. In contrast, spending on core educational goods and services increased more slowly than total expenditure on tertiary institutions in Belgium, Finland, Chile, Ireland, Israel, Lithuania, the Russian Federation, Sweden, the United Kingdom, and the United States. Luxembourg is the only country to witness both an increase in total spending at tertiary level (+34%) and a decrease in spending on core educational services (-24%). This difference suggests increased investment in ancillary services or R&D over this period at the expense of core educational service and is indicative of a research based higher education policy system.
The other third of countries saw their total investments on tertiary institutions decline between 2012 and 2016. However, Hungary and Portugal managed to increase total spending on core educational goods and services in spite of these budget cuts by reallocating funds from ancillary services or R&D. In contrast, spending on core educational goods and services fell in the Czech Republic, Italy, Latvia and Slovenia although to a lesser extent than total spending on tertiary institutions.
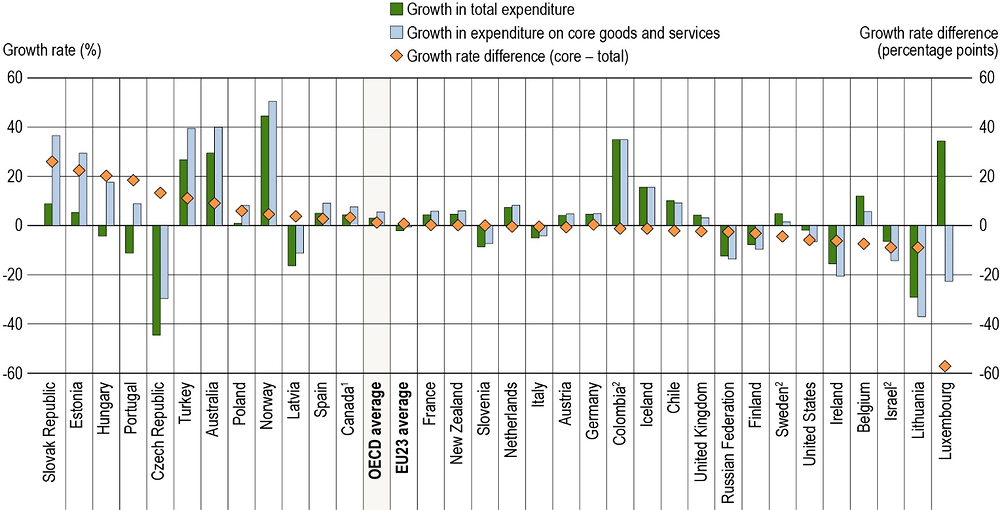
Note: Core educational expenditure has been obtained by subtracting expenditure devoted on ancillary services and R&D from the total expenditure on educational institutions. A positive figure refers to a higher growth rate of the expenditure on core educational services compared to the growth rate of total expenditure on all services. See Definitions and Methodology sections for more information.
1. Reference period 2012-2015.
2. Reference period 2013-2016.
Countries are ranked in descending order of the percentage-point difference.
Source: OECD/UIS/Eurostat (2019), Education at a Glance Database http://stats.oecd.org/. See Source section for more information and Annex 3 for notes (https://doi.org/10.1787/f8d7880d-en).
Definitions
Ancillary services are services provided by educational institutions that are peripheral to their main educational mission. The main component of ancillary services is student welfare. In primary, secondary and post-secondary non-tertiary education, student welfare services include meals, school health services and transportation to and from school. At the tertiary level, they include residence halls (dormitories), dining halls and health care.
Core educational services include all expenditure that is directly related to instruction in educational institutions, including teachers’ salaries, construction and maintenance of school buildings, teaching materials, books, and school administration.
Research and development includes research performed at universities and other tertiary educational institutions, regardless of whether the research is financed from general institutional funds or through separate grants or contracts from public or private sponsors.
Methodology
Expenditure per student on educational institutions at a particular level of education is calculated by dividing total expenditure on educational institutions at that level by the corresponding full-time equivalent enrolment. Only educational institutions and programmes for which both enrolment and expenditure data are available are taken into account. Expenditure in national currencies is converted into equivalent USD by dividing the national currency figure by the purchasing power parity (PPP) index for GDP. The PPP conversion factor is used because the market exchange rate is affected by many factors (interest rates, trade policies, expectations of economic growth, etc.) that have little to do with current relative domestic purchasing power in different OECD countries (see Annex 2 for further details).
Data on subnational regions on how much is spent per student are adjusted using national purchasing power parities (PPPs). Future work on the cost of living at subnational level is required to fully adjust expenditure per student used in this section.
Expenditure per student on educational institutions relative to per capita GDP is calculated by dividing expenditure per student on educational institutions by the per capita GDP. In cases where the educational expenditure data and the GDP data pertain to different reference periods, the expenditure data are adjusted to the same reference period as the GDP data, using inflation rates for the OECD country in question (see Annex 2).
Full-time equivalent student: The ranking of OECD countries by annual expenditure on educational services per student is affected by differences in how countries define full-time, part-time and full-time equivalent enrolment. Some OECD countries count every participant at the tertiary level as a full-time student, while others determine students’ intensity of participation by the credits that they obtain for the successful completion of specific course units during a specified reference period. OECD countries that can accurately account for part-time enrolment have higher apparent expenditure per full-time equivalent student on educational institutions than OECD countries that cannot differentiate between the different types of student attendance.
For more information please see the OECD Handbook for Internationally Comparative Education Statistics 2018 (OECD, 2018[3]) and Annex 3 for country-specific notes (https://doi.org/10.1787/f8d7880d-en).
Source
Data refer to the financial year 2016 (unless otherwise specified) and are based on the UNESCO, OECD and Eurostat (UOE) data collection on education statistics administered by the OECD in 2017 (for details see Annex 3 at https://doi.org/10.1787/f8d7880d-en). Data from Argentina, the People’s Republic of China, India, Indonesia, Saudi Arabia and South Africa are from the UNESCO Institute of Statistics (UIS).
The data on expenditure for 2005, 2011 to 2016 were updated based on a survey in 2018-19, and expenditure figures for 2005 to 2015 were adjusted to the methods and definitions used in the current UOE data collection.
Data on subnational regions are currently available for three countries: Belgium, Canada and Germany. Subnational estimates were provided by countries using national data sources. Subnational data are based on a special survey administrated by the OECD in 2019.
Note regarding data from Israel
The statistical data for Israel are supplied by and are under the responsibility of the relevant Israeli authorities. The use of such data by the OECD is without prejudice to the status of the Golan Heights, East Jerusalem and Israeli settlements in the West Bank under the terms of international law.
References
[1] OECD (2019), OECD Regional Statistics Database, http://stats.oecd.org/Index.aspx?DataSetCode=REGION_DEMOGR.
[3] OECD (2018), OECD Handbook for Internationally Comparative Education Statistics 2018: Concepts, Standards, Definitions and Classifications, OECD Publishing, Paris, https://doi.org/10.1787/9789264304444-en.
[2] OECD (2017), Education at a Glance 2017: OECD Indicators, OECD Publishing, Paris, https://doi.org/10.1787/eag-2017-en.
Table C1.1 Total expenditure on educational institutions per full-time equivalent student (2016)
Table C1.2 Total expenditure on educational institutions per full-time equivalent student for core educational services, ancillary services and R&D (2016)
Table C1.3 Index of change in total expenditure on educational institutions per full-time equivalent student (2005, 2011 and 2016)
WEB Table C1.4 Total expenditure on educational institutions per full-time equivalent student relative to GDP per capita (2016)
WEB Table C1.5 Total expenditure on educational institutions per full-time equivalent student, by type of institution (2016)
WEB Table C1.6 Cumulative expenditure on educational institutions per full-time equivalent student between the age of 6 and 15 (2016)
Cut-off date for the data: 19 July 2019. Any updates on data can be found on line at https://doi.org/10.1787/eag-data-en. More breakdowns can be found at http://stats.oecd.org/, Education at a Glance Database.
StatLink: https://doi.org/10.1787/888933981058
Table C1.1. Total expenditure on educational institutions per full-time equivalent student (2016) |
|---|
In equivalent USD converted using PPPs for GDP, direct expenditure within educational institutions, by level of education, based on full-time equivalents |
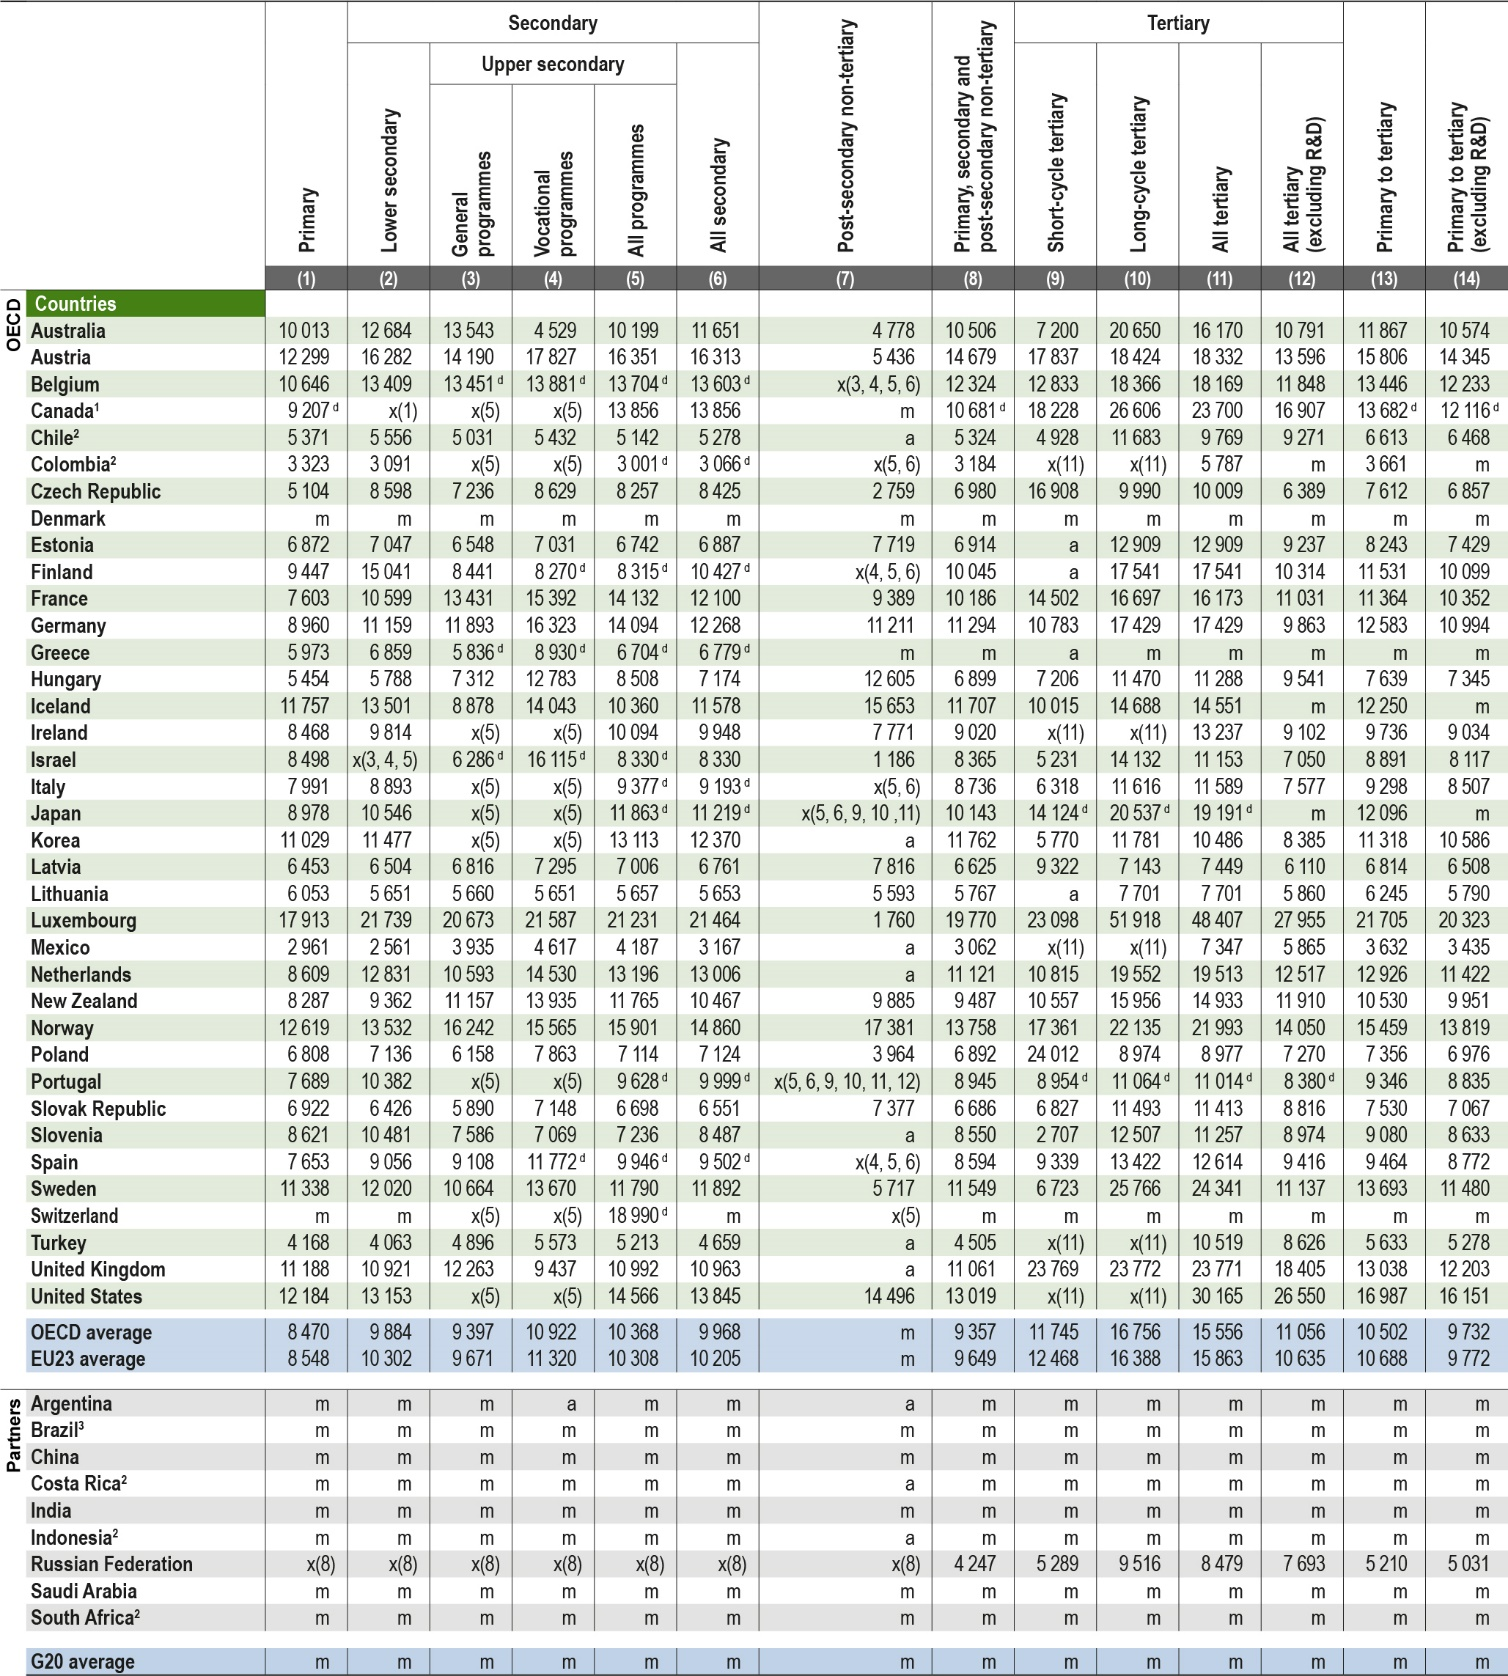 |
Note: See Definitions and Methodology sections for more information. Data and more breakdowns available at http://stats.oecd.org/, Education at a Glance Database. |
1. Primary education includes pre-primary programmes. Post-secondary non-tertiary figures are treated as negligible. |
2. Year of reference 2017. |
3. Data on expenditure on public vs. private educational institutions are displayed in Table C1.5 available on line. |
Source: OECD/UIS/Eurostat (2019). See Source section for more information and Annex 3 for notes (https://doi.org/10.1787/f8d7880d-en). |
Please refer to the Reader’s Guide for information concerning symbols for missing data and abbreviations. |
Table C1.2. Total expenditure on educational institutions per full-time equivalent student for core educational services, ancillary services and R&D (2016) |
|---|
In equivalent USD converted using PPPs for GDP, direct expenditure within educational institutions, by level of education, based on full-time equivalents |
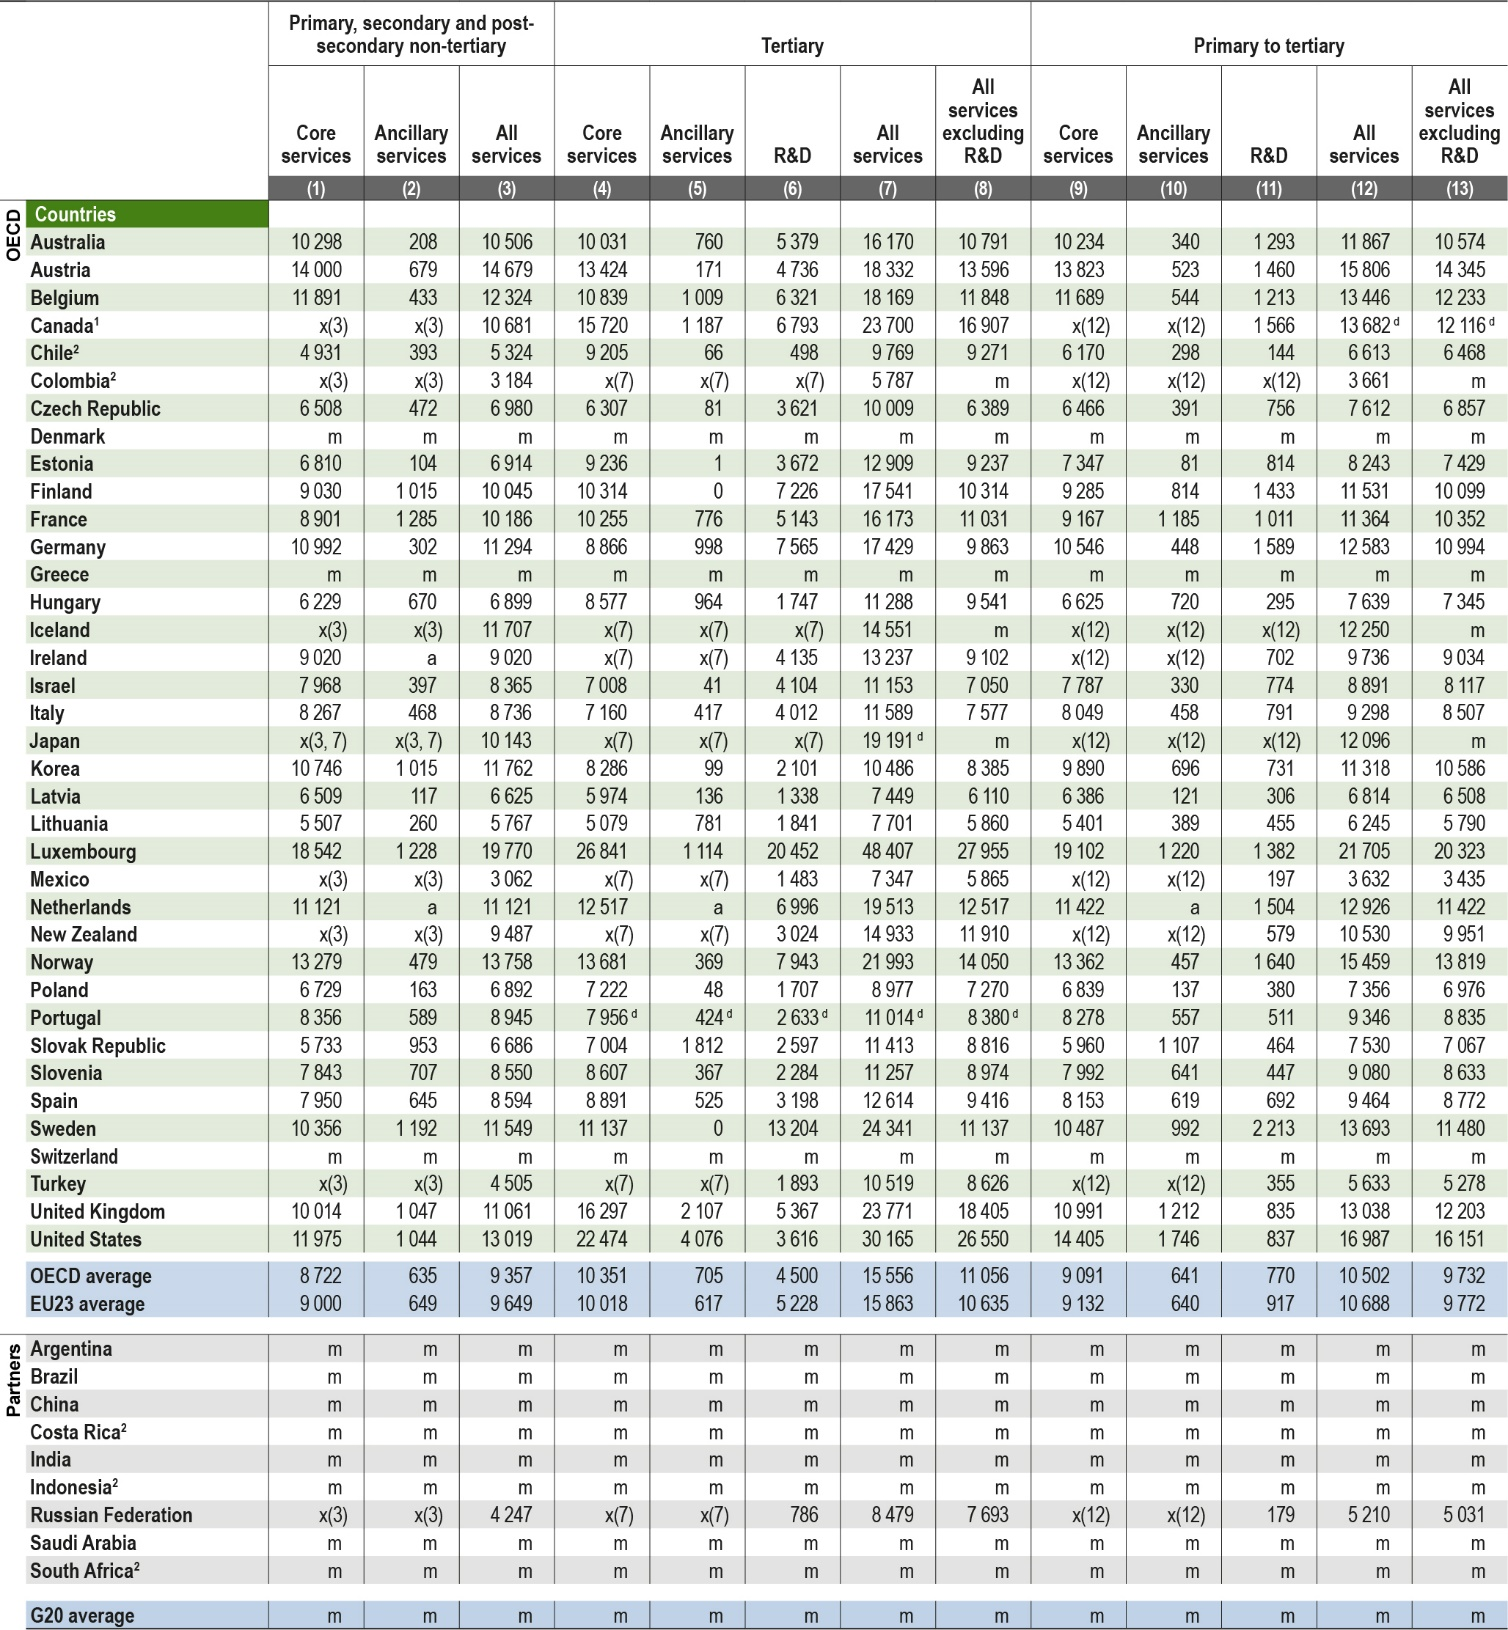 |
Note: Some levels of education are included with others. Refer to "x" code in Table C1.1 for details. See Definitions and Methodology sections for more information. Data and more breakdowns available at http://stats.oecd.org/, Education at a Glance Database. |
1. Primary education includes pre-primary programmes. Post-secondary non-tertiary figures are treated as negligible. |
2. Year of reference 2017. |
Source: OECD/UIS/Eurostat (2019). See Source section for more information and Annex 3 for notes (https://doi.org/10.1787/f8d7880d-en). |
Please refer to the Reader’s Guide for information concerning symbols for missing data and abbreviations. |
Table C1.3. Index of change in total expenditure on educational institutions per full-time equivalent student (2005, 2011 and 2016) |
|---|
GDP deflator 2010 = 100, constant prices |
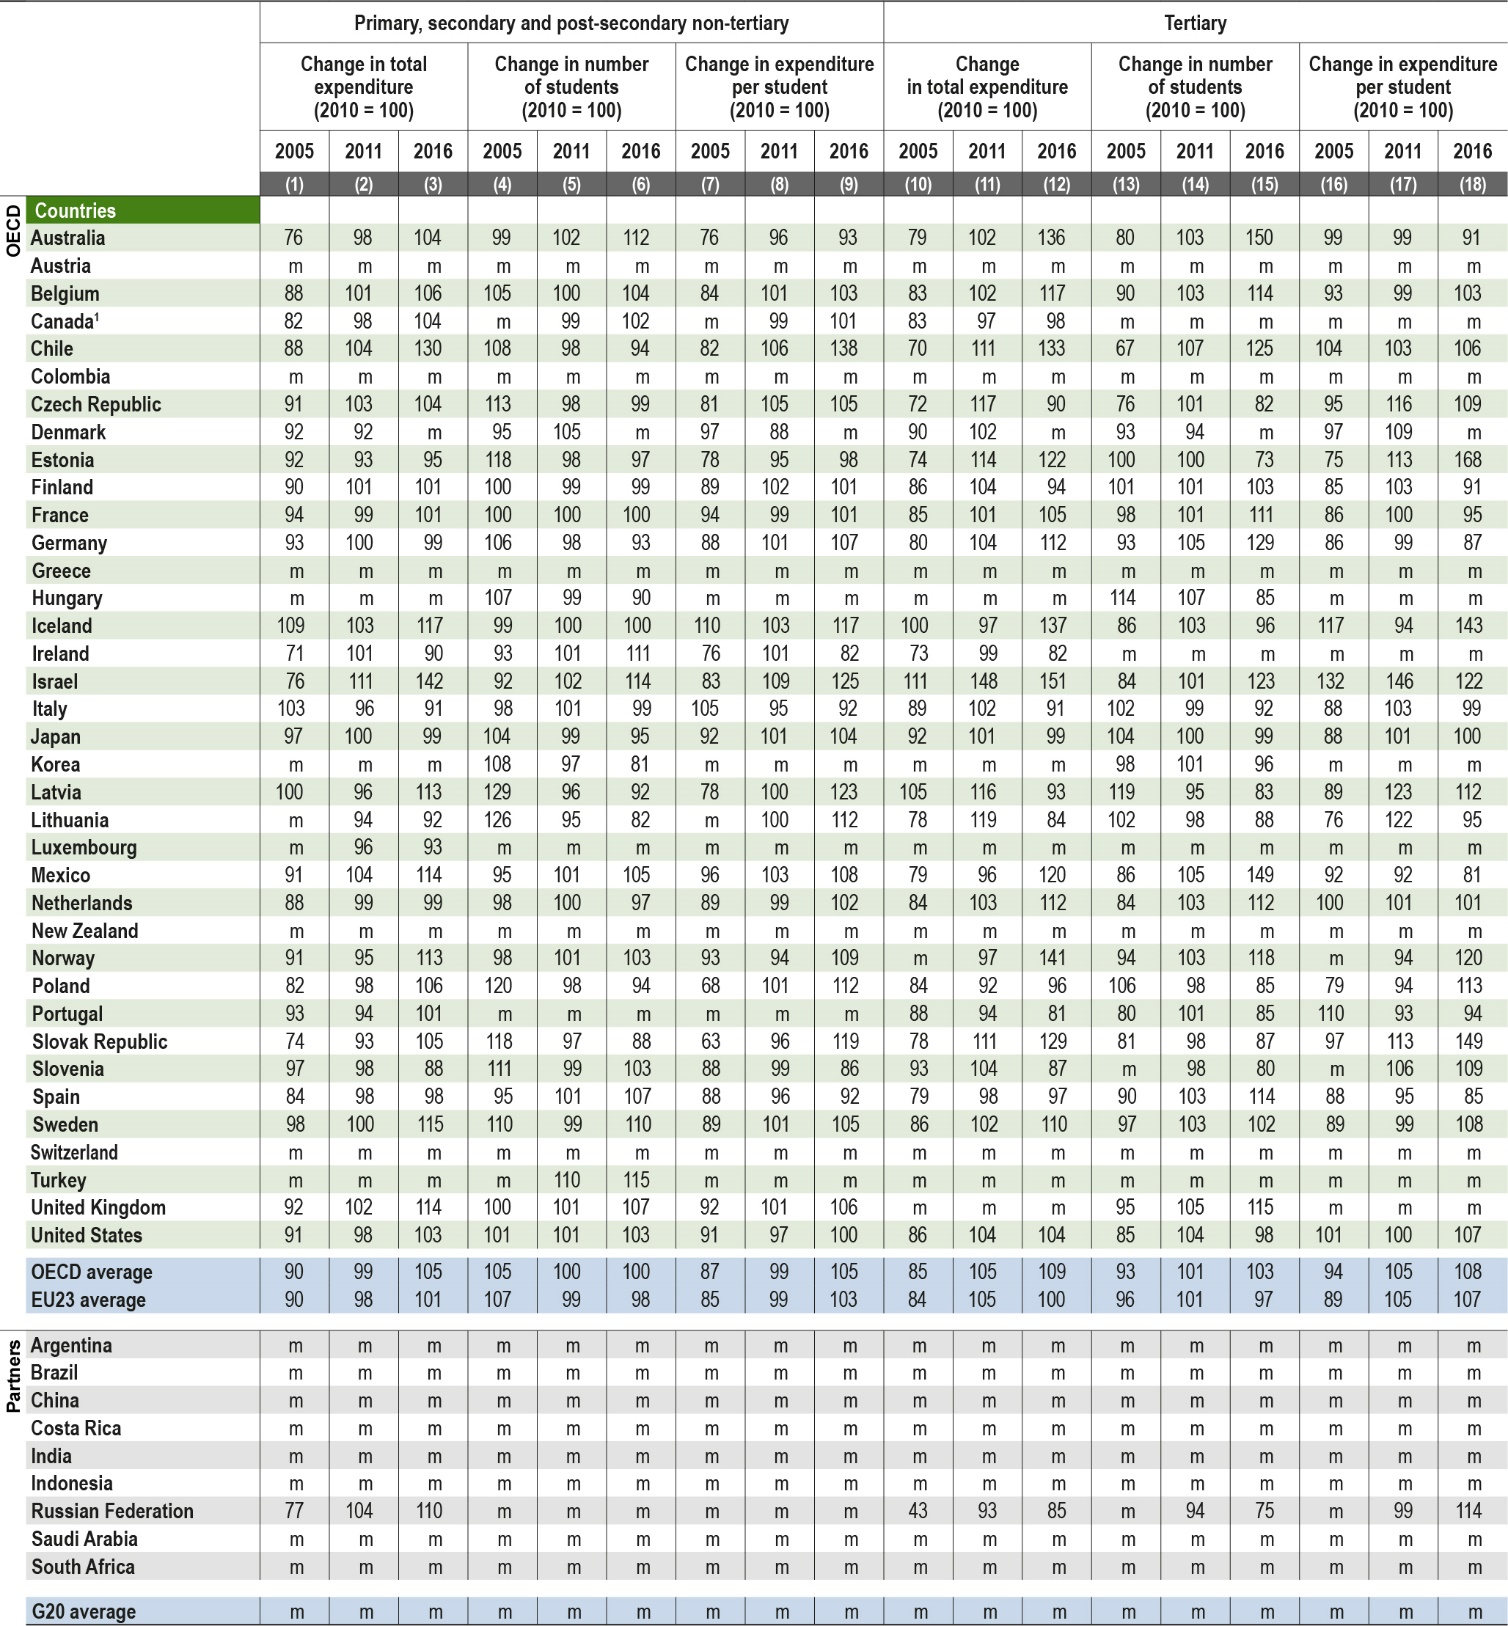 |
Note: See Definitions and Methodology sections for more information. Data and more breakdowns available at http://stats.oecd.org/, Education at a Glance Database. |
1. Primary education includes data from pre-primary and lower secondary education. |
Source: OECD/UIS/Eurostat (2019). See Source section for more information and Annex 3 for notes (https://doi.org/10.1787/f8d7880d-en). |
Please refer to the Reader’s Guide for information concerning symbols for missing data and abbreviations. |
