copy the linklink copied!Chapter 2. Housing for all
Housing is a key part of well-being and contributes to spatial and social mobility. In India, the housing market is characterised by excess demand for affordable dwellings, a small rental market and an oversupply of high-end housing, especially in urban areas. The housing shortage among low-income groups is large, despite increases in the stock of quality housing in recent years, as house prices are high relative to incomes and access to credit is often difficult. Prices are high because of structural rigidities in the market, stemming from stringent zoning and land regulations, restrictive floor indices and high transaction costs, in the context of high population density. Ongoing urbanisation, and particularly rural-urban migration, will intensify demand for affordable housing, especially at the low end of the market. Improving the functioning of the market calls for clarifying property rights and easing rent control and zoning rules. Lowering transaction taxes, especially stamp duties, would support mobility. Simplifying land use regulations and enhancing contract enforcement would also boost housing supply. The Real Estate (Regulation and Development) Act of 2016, which aims at bringing transparency, protecting the interests of homebuyers and boosting investment in the real estate sector, helped improve the market situation. By improving the collateral security, the law can also facilitate access to housing finance. The Housing for All programme that aims to provide a home for every Indian by 2022 is a good way forward in reducing the shortage. As with many past government programs, it promotes ownership. More is needed to develop rental housing and to address the needs of vulnerable groups. The 2019 Model Tenancy Act is a step in the right direction.
The rapid rise in population and incomes over the past decades has resulted in an increase in demand for housing. However, despite several public housing programmes that boosted supply, the housing shortage remains. In 2015, according to government estimates, about 40 million households faced housing shortages —which includes the homeless and households in sub-standard or congested dwellings, or without basic amenities—. The housing shortage is larger in rural areas, where the large majority of the population lives, and among low income groups.
Providing adequate and affordable housing is an ever-growing challenge. Demand for housing will rise as the population continues to increase and the migration from rural to urban areas accelerates. India is projected to have the fastest growing urban population in the coming decades among the BRIICS.
The housing market is very fragmented, influenced by various regulations. The rental market is small, as rigid rent controls and strong renter protection laws limit return to investment and incentives for maintenance for owners (IDFC, 2018[1]). Weak property rights and costly land acquisition constrain supply. At the same time, there are large stalled real estate projects in many suburbs and numerous vacant houses, pointing to oversupply of certain types of housing and a misallocation of the housing capital stock. Access to finance is also difficult, affecting certain categories of demand, as the mortgage market remains small (Soundararajan, 2017[2]).
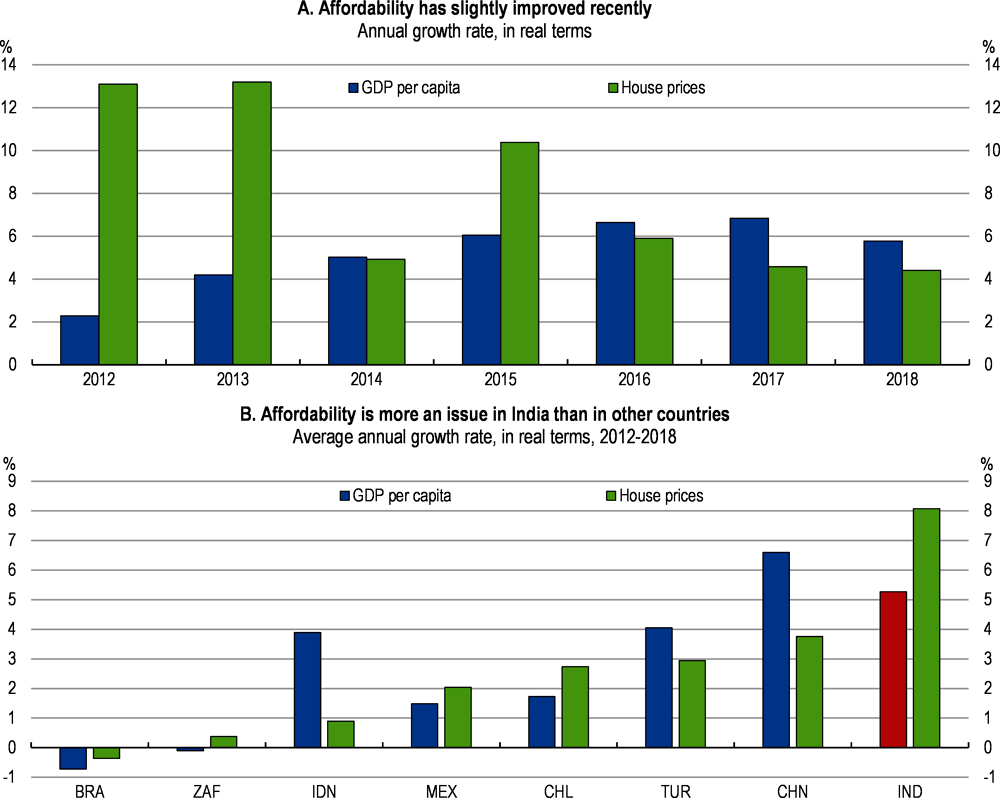
Average real housing prices have increased much more than GDP undermining housing affordability in particular for low income households (Figure 2.1). The various regulations and costly land in urban areas tend to drive up house prices, which can be much higher than low income households’ annual incomes (Tiwari and Rao, 2016[3]).
Improving the functioning of the housing market and addressing affordability are key challenges. Access to affordable housing is crucial for achieving a number of other policy objectives, including poverty reduction, equality of opportunity and more inclusive and sustainable growth. The housing market should enable spatial mobility between and within cities as job opportunities arise, and vertical mobility so that people can change house and neighbourhood when they climb the socio-economic ladder.
The government has launched various initiatives, including the Housing for All scheme and the Smart cities programme. Support has mostly favoured ownership in terms of interest subsidies or building programmes. There are ambitious targets for 2022 (based on current needs) for new houses in both urban and rural areas. Improving the regulations governing the housing market should also receive more attention. This chapter will discuss various elements of the housing market, past policies to increase affordable housing and potential policies to better respond to needs.
Note: Data for India relate to fiscal years.
Source: OECD.
copy the linklink copied!A persistent shortage with many vacant units points to large imbalances in the housing market
Housing shortages continue to be a challenge
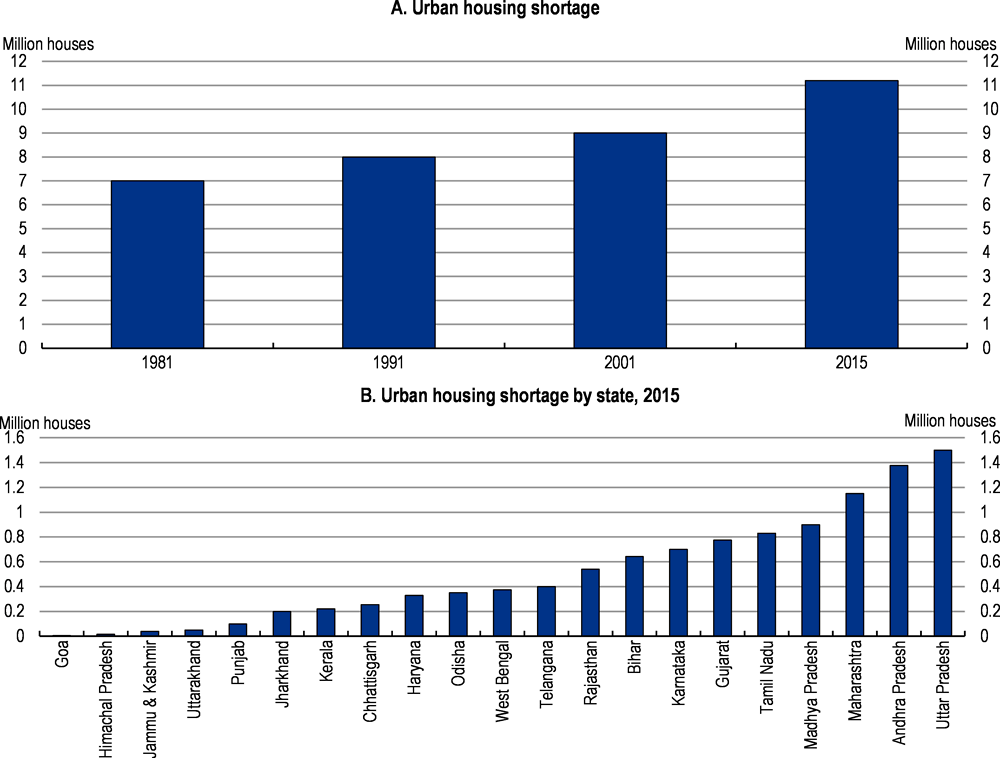
International comparisons show that the share of people living in poor quality housing in India is high compared to other Emerging Market Economies. The urban shortage has increased fast in recent times (Figure 2.2, panel A) and continues to worsen as migration and natural population growth have intensified, but the biggest shortage is still in rural areas. There are large regional differences – the shortage is particularly important in Uttar Pradesh, Andhra Pradesh and Maharashtra (Figure 2.2, panel B). In urban areas, the housing shortage is mainly due to congestion, i.e. too many people per dwelling, whereas in the rural areas it is related to the quality of housing. Housing shortage will be addressed with the completion of the Housing for All programme and other social programmes (see below).
Housing conditions have improved for some vulnerable groups
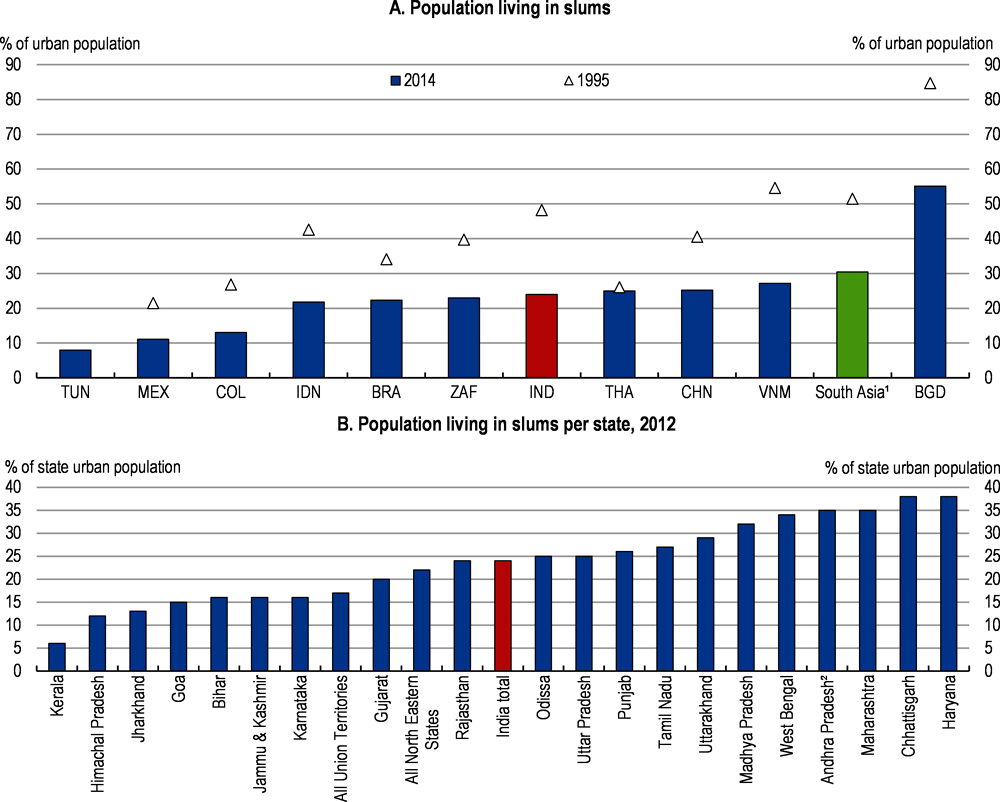
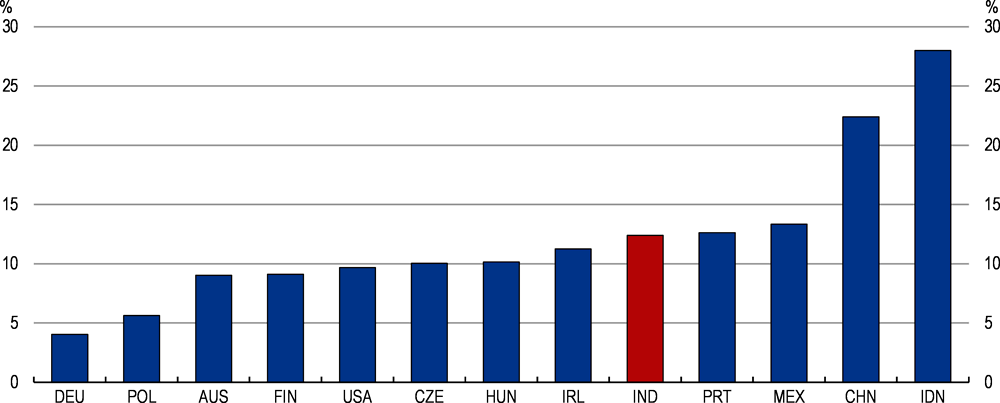
Despite rising urbanisation and housing shortages, the share of population living in slums has decreased in the last two decades. However, around 25% of the total urban population still live in slums, similar to other large EMEs (Figure 2.3, panel A). The disparity across states is large, ranging from 6% of the urban population living in slums in Kerala to more than 35% in Andhra Pradesh, Chhattisgarh, Haryana and Maharashtra (Figure 2.3, panel B). Many workers who migrate from rural to urban areas to work end up in slums as they cannot afford buying a house, and the rental market is not well developed (see below). Globally, people living in the richest states (as measured by GDP per capita) face better housing conditions on average (Figure 2.4).
Note: Housing shortage = Households living in non-serviceable katcha (nondurable) + households living in obsolescent houses + households living in congested houses + households that are homeless.
Source: Ministry of Housing and Urban Affairs.
Note: South Asia according to the definition of the World Bank. 2. Andhra Pradesh includes Telangana.
Source: World Bank, World Development Indicators database; Ministry of Housing and Urban Affairs.
Housing conditions for the homeless have also improved somewhat (defined as those who live in “the open or roadside, pavements, in hume-pipes, under fly-overs and staircases, or in the open in places of worship, mandaps, railway platforms etc.”). Their number was estimated in the 2011 Census at 1.8 million (0.15% of total population or 3-4% of the shortage), a slight decline from the previous census especially in rural areas, while it increased in cities (Kumuda, 2014[4]) (Figure 2.5, panel A). The share of homeless population differs across states (Figure 2.5, panel B).
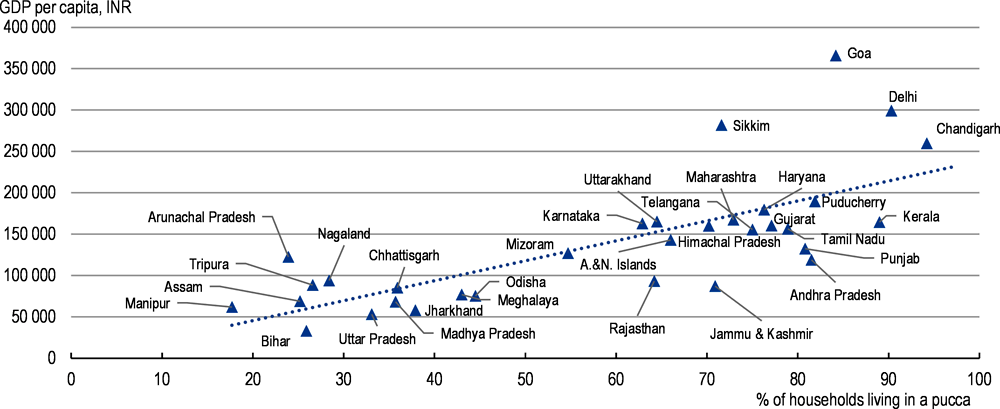
Note: Houses made with high quality materials throughout, including the floor, roof and exterior walls, are called pucca houses.
Source: OECD calculations based on data from CEIC; National Family Health Survey 2015-16, International Institute for Population Sciences.
Access to basic services has also improved in recent years. In April 2018, the last village without electricity received power. The Swachh Bharat Mission has brought toilets to 98% of the rural population. Access to piped water has also improved, except in some states such as Bihar, Uttar Pradesh and Jharkhand where more than 70% of the rural population still does not have access to it (Figure 2.6).
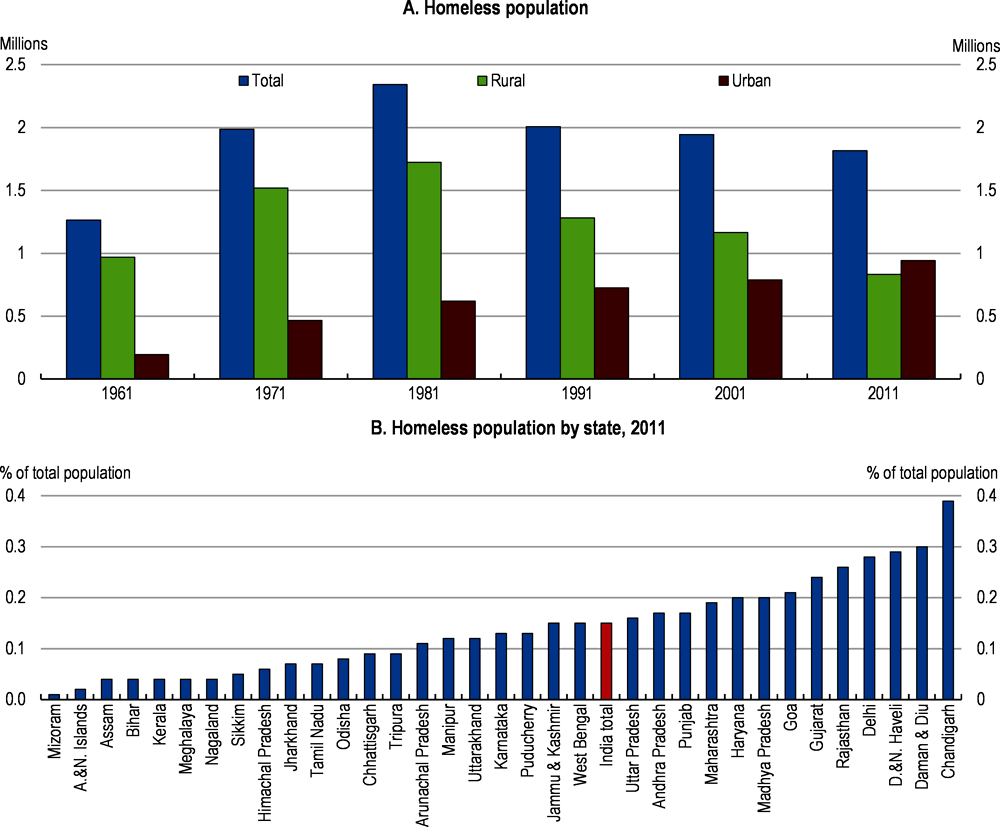
Source: Data from the respective population censuses; Sanjukta Sattar, "Homelessness in India", Shelter, April 2014, Volume 15, No. 1.
High housing prices make affordability a major problem
Real housing prices increased significantly between 2010 and 2015, and have stabilised since then, partly reflecting temporary factors (Figure 2.7, panel A). The evolution differs significantly across cities (Figure 2.7, panel B). Property prices relative to income are high in comparison to other emerging markets (see below).
House prices are high relative to incomes for most people. Overall affordability measured by the “house price to income” ratio or the “loan to income” ratio has worsened over the past 4 years (RBI, 2019[5]). The average house price was estimated to be much higher than the annual income for the poorest income group in 2010 (Tiwari and Rao, 2016[3]) (Figure 2.8). As the data refer to 2010 and since then income have increased and house prices have stabilised, it can be assumed that the situation has improved. On the other hand, there are indications that wealth inequality has widened. Closing the gap for the poorest households with subsidies alone would be extremely costly. By contrast, owing to rent controls, renting a house is relatively affordable and more so than in other EMEs (Figure 2.9).
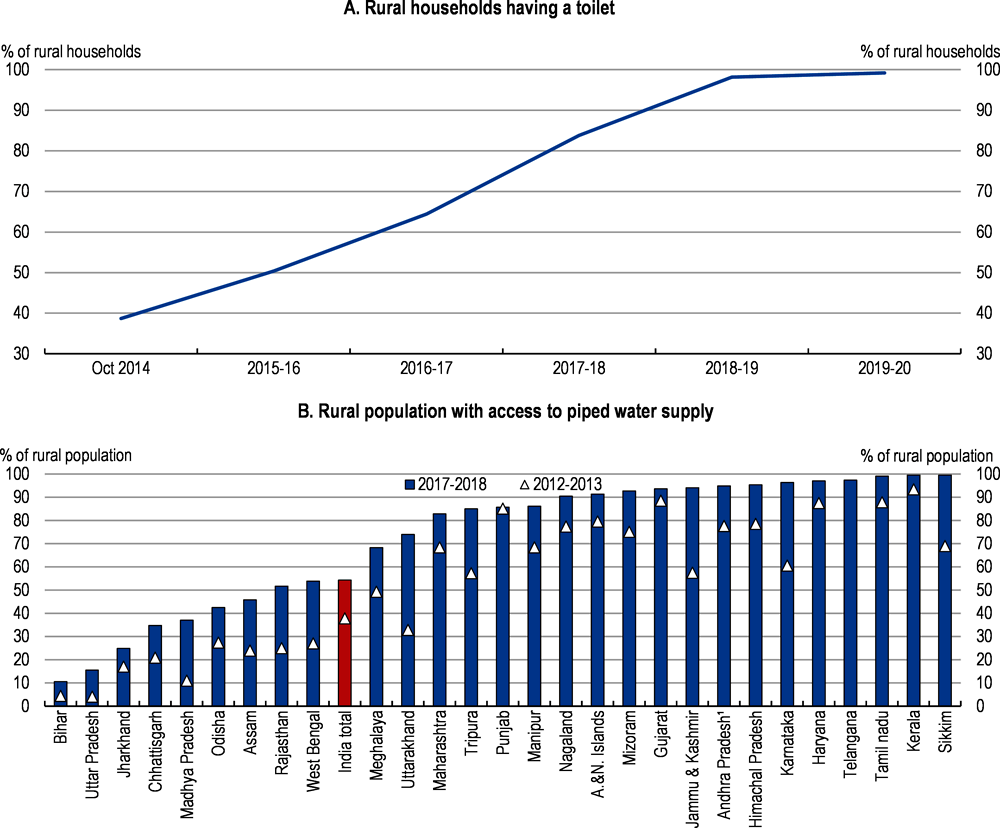
Note: Andhra Pradesh includes Telangana for the data referring to 2012-13.
Source: Ministry of Drinking Water and Sanitation.
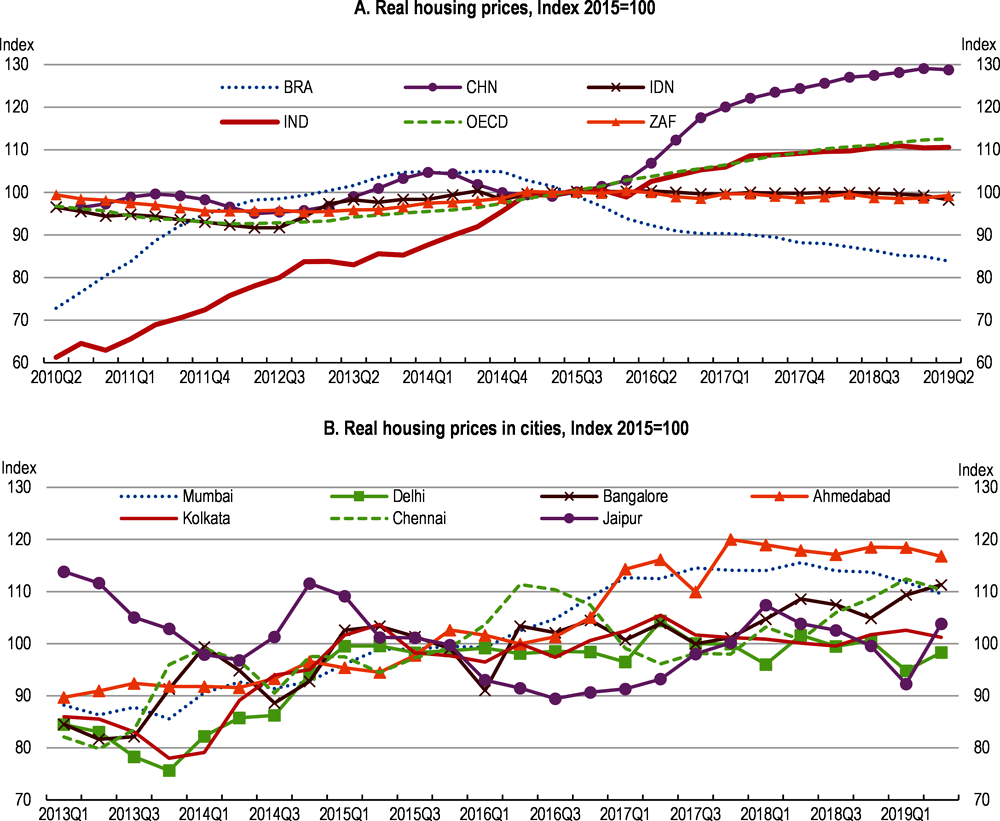
Note: The series in Panel A are based on the real housing price index, deflated with the private consumption deflator, from the OECD. The series in Panel B are based on 3-month average housing price indices, deflated with the urban CPI, from the RBI. The base for all series is the 2015 average value.
Source: RBI; OECD, Prices and Purchasing Power Parities database.
Gaps in the price-to-income ratio across different income groups affect incentives to build various types of housing. The increase in real income per capita, especially for the wealthiest 1% and 10% (by 6 and 2 percentage points respectively between 2000 and 2018), led developers to favour large and luxury apartments.
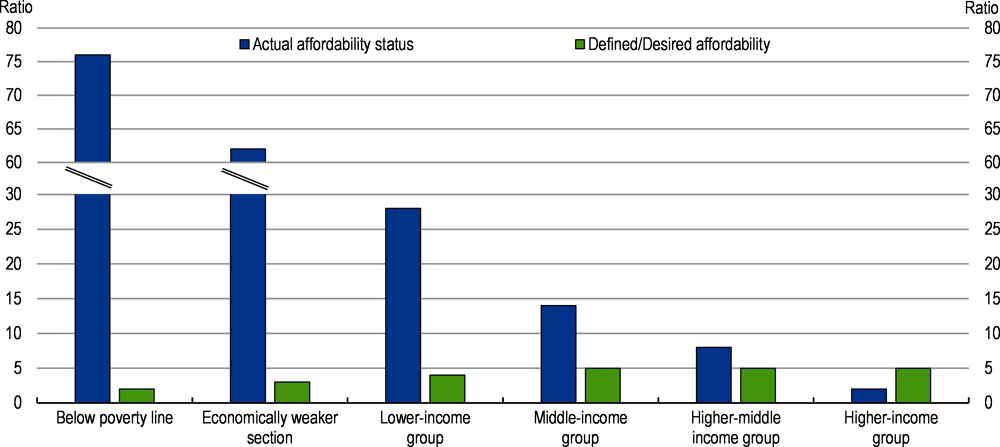
Note: “Defined/desired affordability” is defined as the ratio of house price to annual income, assuming that the house is financed by home loans with equated monthly installments (EMIs) not exceeding a certain amount for each income groups. EMIs should not exceed 5% of the household gross monthly income for Below Poverty Line (BPL), 20% for economically weaker sections (EWS), 30% for lower-income groups (LIG) and 40%, for the middle-income group (MIG).
Source: Piyush Tiwari and Jyoti Rao, Asian Development Bank Institute, "Housing Markets and Housing Policies in India" (No. 565, April 2016).
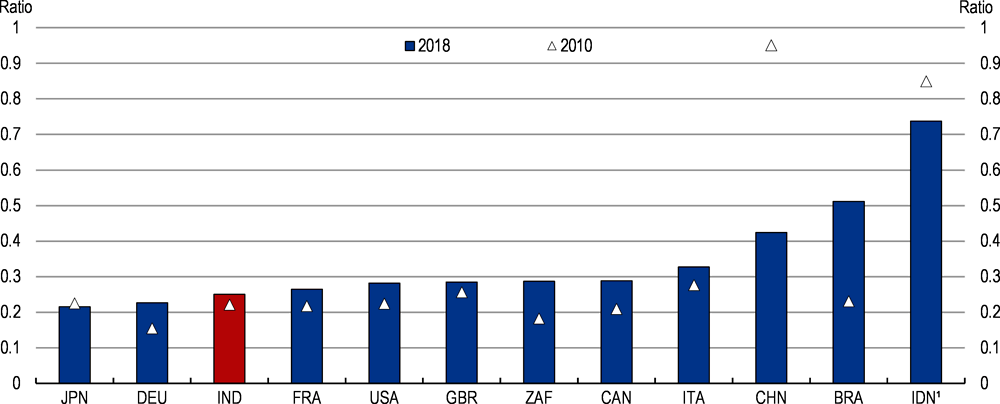
Note: Rent to income ratio is defined as annualised average monthly rent for an apartment of 50 m2 in the city centre divided by the annualised average monthly income (after tax) times 1.5 (50% of women is assumed to participate in the workforce). Data are for 2011 for Indonesia.
Source: Numbeo and OECD calculations.
Many dwellings remain vacant
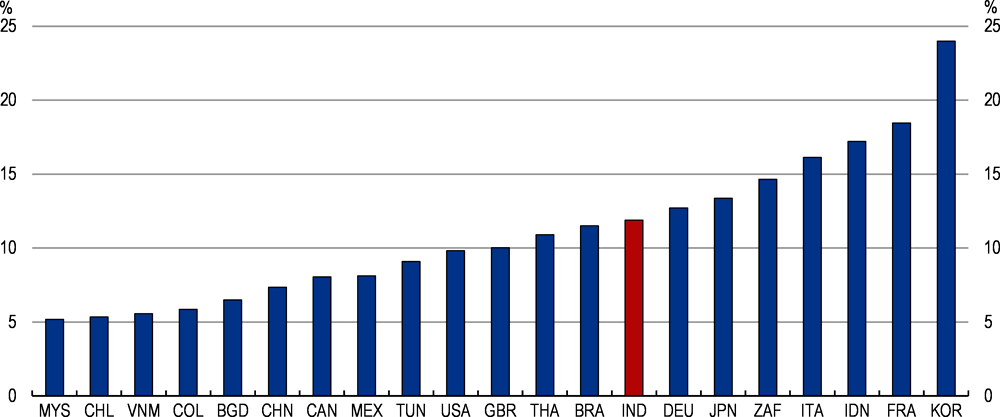
The large number of vacant dwellings points to misallocation of the housing capital stock. The 2011 Census showed 11 million vacant urban housing units. Housing vacancy rates in 2015 are lower than in other EMEs but higher than in advanced OECD countries (Figure 2.10). Most of the vacant dwellings are in mass-produced homes on peri-urban land with deficient infrastructure (transport) and basic services, far from job opportunities and city centres. This is partly a result of strict zoning laws in city centres and the policy of preserving land in city centres for government use. These laws vary across states. However, many Indians want to live closer to their jobs and this, in part, explains the numerous vacant dwellings.
Another factor is affordability, as real prices have increased significantly in the last decade, and low-income people cannot afford to buy most of these new dwellings. Moreover, it is important for most people to maintain neighbourhood connections (Barnhardt, Field and Pande, 2017[6]).
Note: Year of reference: 2010 for the United States and Mexico; 2011 for Australia, the Czech Republic and Ireland. For Indonesia, data refer to Jakarta only and are vacancy rates for apartments for lease.
Source: OECD Questionnaire on Affordable and Social Housing; India MoF Economic Survey 2017-18; China Households Finance Survey; Colliers International (2017), Jakarta Property Market Report.
The rental market is small
Rental housing is key to spatial mobility, as it makes it easier for people to move closer to the places where they can find a job. It is important for migrants moving to cities, temporarily or permanently, and for youth, low income and disadvantaged people who want or need to live in cities but cannot afford to buy a house.
The rental market is very small in India especially in rural areas. Even in urban areas, the share of rented housing has decreased from 54% in 1961 to 31% in 2011 out of the total stock (Tandel et al., 2015[7]). There are also stark regional differences ranging from almost 30% in Delhi to less than 5% in Bihar and Uttar Pradesh (IDFC, 2018[1]) (Figure 2.11). Moreover, most of the rentals are informal so as to avoid the strict rent controls that exist in many states.
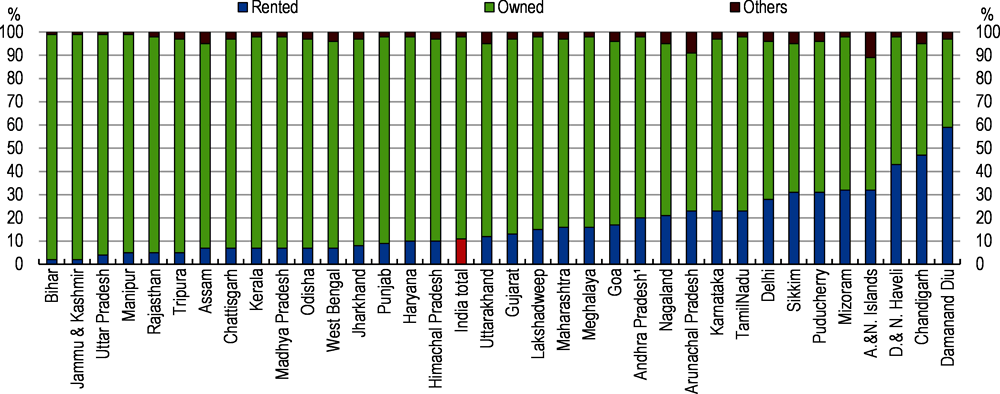
Note: Andhra Pradesh includes Telangana.
Source: Ministry of Home Affairs, Office of the Registrar General of India.
Boosting rental housing calls for modernising rent controls
Experience in OECD countries suggests that the supply of private rental housing is determined by demographics, income, the profitability of different types of investments, and housing policies related to rental regulations (which are often aimed at addressing market imperfections such as asymmetric information and/or unequal bargaining power between landlords and tenants), taxation, building regulations and rent allowances (Andrews, Caldera Sánchez and Johansson, 2011[8]). The small rental market in India is partly due to low rental yields in major cities compared to other EMEs and OECD countries (Figure 2.12) or other forms of investment due mostly to strict rent controls.
By imposing a price ceiling, rent controls generate market distortions, creating excess demand while discouraging investors for new buildings and maintenance of old ones (Nallathiga, 2005[9]). Rent controls have been in place in India since 1947 to prevent landlords from imposing very high rents on migrants when they arrive in a city (IDFC, 2018[1]). Rents have been kept at below-market rates for many years. The problem is further exacerbated by the slow pace with which disputes between owners and tenants are addressed by the judicial system, the inability to evict tenants and unclear property rights. In many states, rental rights are also transferrable to younger generations (Ministry of Finances, 2018[10]).
The central government has tried many times to persuade states to reform their rental regulations and suggested different tenancy models in 1992, 2011 and 2015. The main amendments in the 2015 tenancy model included the suppression of the standard rent level and the inclusion of the rent increase in the Tenancy Agreement. In addition to the new tenancy model, the reform of Rent Control Acts was classified as mandatory under the 2005 housing programme (the Jawaharlal Nehru National Urban Renewal Mission). However, progress has been slow (Table 2.1). In 2019, a new Model Tenancy Act has been released. Under the Act, landowners are obliged to provide a written notice three months before revising rent. The Act encourages the appointment of district collector as rent authority and heavy penalty on tenants for overstaying. The Act also restricts the security deposit to be paid by the tenant in advance to a maximum of two months' rent. Given the large number of vacant dwellings, the Act could boost the rental market. Only Andhra Pradesh, Punjab and Tamil Nadu have amended their rent control. Since 2015, the Maharashtra government has tried many times to reform rent controls without success as it faces political resistance. One of the main issues with the current rent legislation is that the standard rent level is significantly lower than the prevailing market rent and many of the existing tenants have enjoyed the excessive benefit of very low rent for more than 50 years.
Note: Rental yields are defined as the rental income of an investment property as a percentage of its price.
Source: Global Property Guide.
Many countries have started to eliminate rent controls. In Egypt, rent control and stringent tenant protection regulation reduced the attractiveness of rental housing for investors. In 1996, a law was passed that eliminated the rent control for newly built and vacant units. It resulted in a more dynamic market despite the fact that 40% of the rental housing stock was still under the rent control regime due to grandfathering (Peppercorn and Taffin, 2013[11]). Rent controls were in place in Brazil until 1991, when a new law eliminated it and introduced some advantages for owners and tenants. Landlords acquired the right to charge an “entry fee” at the beginning of a contract and to charge a penalty for early termination; tenants won the ban of entry fees for contract renewals, a preferential buy option in case of sale of the property and exemption from large expenses for the building (Peppercorn and Taffin, 2013[11]). In most OECD countries, the initial rent level is unrestricted. However, the rate at which rents can be increased during the term of a contract and/or the frequency of such increases is regulated in most countries, with some exceptions. In India, the states should continue to modernise the rent control system.
The pressures for housing will be exacerbated by continued urban migration
Urban population growth is influenced by natural increase, reclassification of rural areas as urban ones and net internal migration. Natural increase is the major component of urban growth, accounting for about 50% of total growth. Census migration tables show that net migration accounted for around 21% of urban population growth between 1991 and 2001, and it had marginally increased to almost 23% between 2001 and 2011 (Chandrasekhar, 2017[12]). The 2017 Economic Survey by the Ministry of Finance provided a new measure based on railway passenger traffic. It estimates the annual work-related inter-state migration at around 9 million people between 2011 and 2016, up from 6 million per annum between 2001 and 2011 (Ministry of Finances, 2017[13]).
Migration can be temporary or permanent. A key driver for rural-urban migration is low agricultural income. Some programmes have reduced migration pressures to some extent. The 2005 Mahatma Gandhi National Rural Employment Guarantee Act enhances the livelihood security of the households in rural areas by providing at least 100 days of guaranteed wage employment every financial year to each household. More recently, a basic income for farmers has been included in the 2019 budget. Nonetheless, more and more people are likely to move to cities in search of better jobs opportunities and higher wages.
A large share of temporary migrants are seasonal migrants who combine several activities according to seasonal labour requirements. These are mostly poor farmers searching for jobs during the monsoon season or outside the harvest season, mainly in construction or the informal sector, to secure subsistence income. The temporary migrants are often poor, low educated, landless and belong to schedules tribes and castes (Keshri and Bhagat, 2012[14]). The highest temporary migration rates were found in Bihar, Jharkhand and Gujarat and the lowest in Haryana, Delhi and Punjab.
Migrants often arrive alone and live in very difficult conditions. Many end up living on the street while others stay in their factory to sleep, eat and bathe. Some move to a slum or an informal rental dwelling at the periphery of the cities, involving long commuting time.
Urbanisation and the natural increase in the population will put further pressure on urban housing. Currently, around 35% of the population lives in urban areas. This share is projected to rise to more than 50% in 2050 (Figure 2.13). Delhi is projected to become the world’s largest city by 2028, reaching 39 million inhabitants in 2030 (United Nations). The ten cities in the world that will experience the fastest population growth between 2019 and 2035 will all be in India. Consequently, the demand for housing in cities will intensify and it is crucial to invest in urban infrastructure.
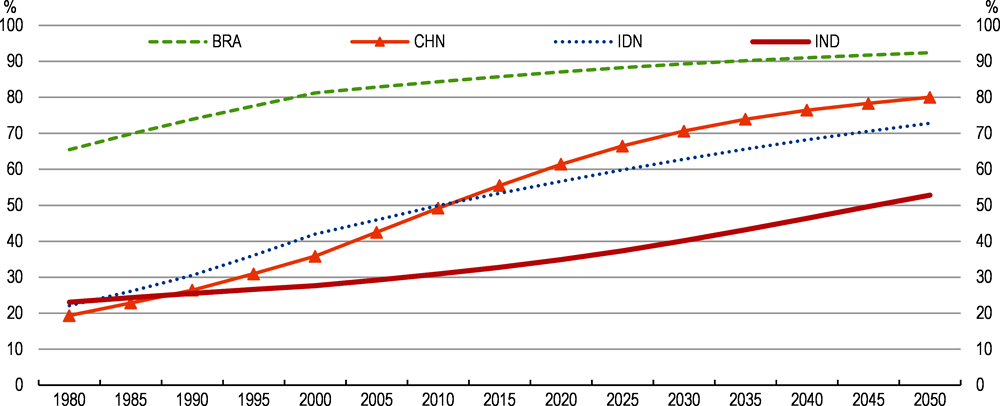
Note: The share of urban population is defined as the annual urban population at mid-year to the total of urban and rural population at mid-year.
Source: United Nations, Department of Economic and Social Affairs, Population Division (2018). World Urbanization Prospects: The 2018 Revision.
copy the linklink copied!Making the housing market more efficient
Recent measures have helped to contain prices and ease access to housing
With the introduction of the Housing for All programmes and the related measures to support the low and middle-income home-buyers (see below), developers have reduced the size of dwellings. Moreover, recent regulations such as the RERA and the Benami Act have reduced speculation. This has also improved housing affordability, although large disparities remain between low and higher income groups.
The Real Estate (Regulation & Development) Act, 2016 (RERA) introduced in May 2016 is designed to protect buyers and boost investment in the real estate sector by bringing more transparency and accountability (Box 2.1). It has not been implemented in all states yet. In Maharashtra (a pioneer in the implementation of the RERA) it may have constrained supply first as developers needed to adapt to the new rules. The act should have a positive impact on housing provision after the adjustment period.
The implementation of the 2016 Real Estate (Regulation and Development) Act (RERA) started in 2017. The RERA seeks to promote transparency and accountability, protect the rights and interests of the buyers, promote fair and standard builders practices, achieve symmetry of information between the promoter and the purchaser and improve transparency of contractual conditions. It also introduces a fast-track dispute resolution mechanism.
Main provisions of RERA:
-
The Act regulates transactions between buyers and promoters of residential real estate projects. It establishes state-level regulatory authorities, called Real Estate Regulatory Authorities (RERAs).
-
Residential real estate projects, with some exceptions, need to be registered with RERAs. Promoters cannot book or offer these projects for sale without registering them. Real estate agents dealing with these projects also need to register with RERAs.
-
On registration, the promoter must upload details of the project on the website of the RERA. These include the site and layout plan, and schedule for completion of the real estate project.
-
70% of the amount collected from buyers for a project must be maintained in a separate bank account and can only be used for construction of that project. The state government can alter this amount to less than 70%.
-
The Act establishes state level tribunals called Real Estate Appellate Tribunals. Decisions of RERAs can be appealed in these tribunals.
Progress made by the states in implementing RERA as of end-September, 2019:
-
30 states or Union Territories (UTs) have notified rules under RERA, 4 north eastern states (Arunachal Pradesh, Meghalaya, Nagaland and Sikkim) are under process to notify rules under RERA.
-
29 states or UTs have set up a Real Estate Regulatory Authority.
-
22 states or UTs have set up a Real Estate Appellate Tribunal.
-
45 092 real estate projects and 35 611 real estate agents have registered under RERA across the country.
Maharashtra has been efficient in implementing the RERA, resolving cases through fast-tracked redress mechanisms. These judgments have been successful in restoring buyer sentiment in under-construction projects and in addressing difficulties in the construction development process. Some judgments have been delivered within 30 days. Since its constitution, the authority (MahaRERA) has ruled in over 1 000 cases with the first ruling coming in September 2017. Karnataka is also thriving to head in this direction by giving prompt ruling in 63 cases.
Source: Ministry of Housing and Urban Affairs and PRS India.
The Benami Transactions Act, passed in 2008 and amended in 2015, aims at limiting cash transactions in the real estate sector. The 2015 amendment is more stringent: it expanded the definition of a Benami transaction (where a property is held by or transferred to a person, but has been paid by another person). The law also established adjudicating authorities and an Appellate Tribunal to deal with Benami transactions and penalty for entering into Benami transactions (Ministry of Finance, PRS). By dampening demand, the Bill has probably contributed to price moderation.
Other measures have been implemented to limit cash transactions with an impact on the housing sector. The Permanent Account Number (PAN) was made mandatory for all transactions above INR 0.2 million (USD 2 900) and in July 2016, the Supreme Court recommended a ban on cash transactions above INR 0.3 million (USD 4 300) and an upper limit for cash holdings of INR 1.5 million (USD 2 150). Demonetisation also had a temporary impact on prices. The measure has restrained demand for some time and held back price increases.
To promote further housing investments, the government has introduced tax incentives for some housing categories. In 2019, the GST rate on housing construction was reduced from 12% with an input tax credit to 5% without an input tax credit for housing outside the “affordable housing segment”. For the latter, the GST rate was reduced from 8% with an input tax credit to 1% without an input tax credit. However, the impact of the lower rates may be partly offset by the withdrawal of the input tax credit, which can lead to an increase in the selling price if the developer passes the additional cost to the buyer. Moreover, it could also reintroduce cash transactions in the market.
To allow more people to benefit from the tax incentives, the government widened the definition of the “affordable housing segment” by considering dwellings priced up to INR 4.5 million (USD 65 000) and with a carpet area of 90 m2 in non-metropolitan areas and 60 m2 in metropolitan areas.
Maharashtra is an interesting example of the impact of the measures taken by the central government on the housing sector. In 2017, housing supply was hindered by the demonetisation, the introduction of the RERA and the GST. Residential building launches in the Mumbai Metropolitan Region declined by 30% (Knight Frank, 2018[15]). The market recovered strongly in 2018 and the residential launches tripled (from the low 2017 base) partly because the Supreme Court lifted the ban on new construction approvals (in place since March 2016) for a period of seven months from March 2018.
Dealing with structural rigidities in the housing market can enhance affordability
Prices are pushed up by population growth and structural factors such as high cost of construction from various zoning and other regulations, difficulties in land acquisition and high transaction costs. While it is relatively easy to deal with construction permits and getting electricity, it is much more difficult than in OECD countries and other EMEs to register property and to enforce contracts (Table 2.2). A simplification of these rules could help increase housing supply and lower prices. A particularly important issue for the housing sector is land titling as land records do not guarantee ownership. India has a system of registered sale deeds as opposed to land titles, and it is cumbersome and costly to register a property (Figure 2.14). The record of rights (document with details of the property), property tax receipts, and survey documents are also used to recognise ownership but they are not a government-guaranteed title to the property, but only a record of the transfer of property (Mishra and Suhag, 2017[16]). More recently, some cities such as Bengaluru have attached a unique ID number to each property. Extending this practice to more cities will allow clarify property ownership, facilitate transactions and contain Benami transactions.
Land records are poorly maintained and difficult to access. The central government implemented the Digital India Land Records Modernisation Programme (before named the National Land Records Modernisation Programme) to improve the quality of land records in a view to achieve complete computerisation of the property registration process and digitisation of all land records. Progress has been slow and differs across states. While Telangana, Odisha and Karnataka have nearly completed the computerisation of their land records, northeast states – Arunachal Pradesh, Meghalaya, Mizoram and Nagaland have not yet started the process. Nineteen states and Union territories, including Goa, Odisha and Tripura, have started to record property transactions and link them to cadastral maps. Between 2008 and September 2017, 64% of the funds released under the programme have been effectively used (Mishra and Suhag, 2017[16]). It is important to move to a system of registered property titles (contrary to sale deeds) as the primary evidence of ownership, and assure clear and updated land records as is done in OECD countries.
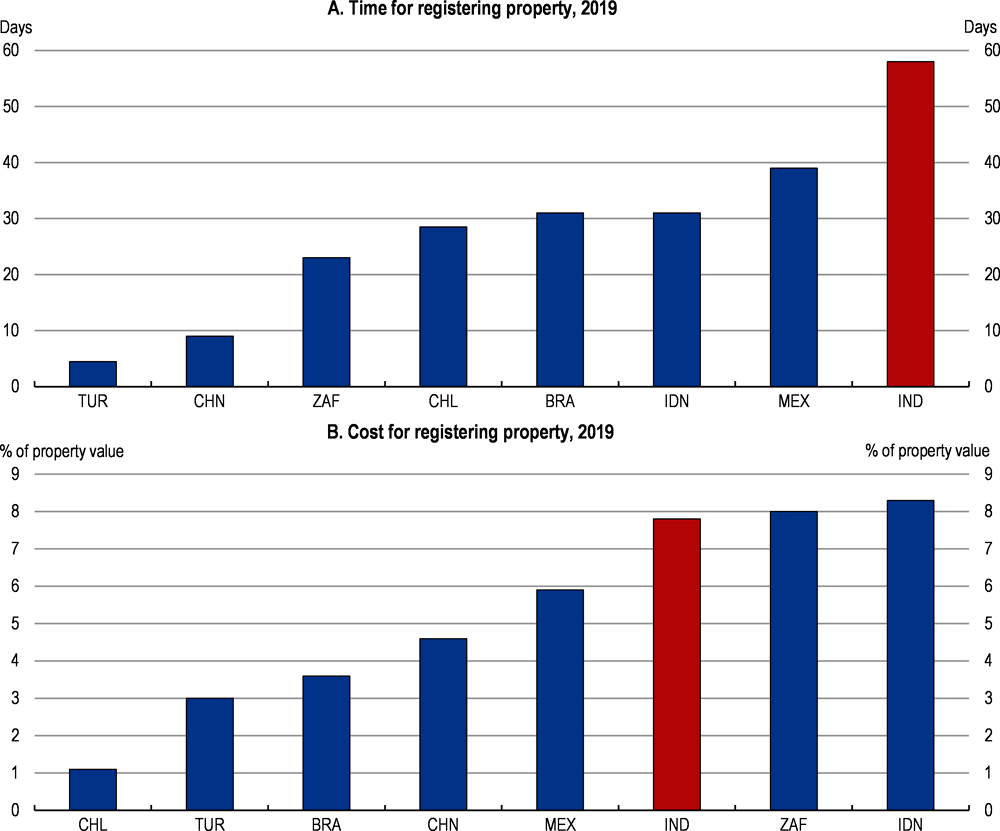
Source: World Bank, Doing Business.
Prices are also pushed up by the floor space index limiting the height of buildings in cities and by overall high population density. India is one of the most land-scarce countries in the world, and the rapid urbanisation has put more pressure on land (Figure 2.15). The floor space index (a measure of height limit regulation) is particularly low in India (Table 2.3). It affects both the selling and rental markets as it prevents the construction of taller buildings. Limiting the height of the building in cities often leads to urban sprawl that contributes to air pollution, with higher emissions from road transport. Economic consequences of urban sprawl are also numerous. It puts pressures on local public finances, as it is more expensive to provide public services to remote and low-density areas and generates notable time losses due to traffic congestion (OECD, 2018[17]).
India should consider relaxing the floor space index. This would generate more supply and lower prices allowing more people to live in city centres. A moderate increase in the height limit could lead to a substantial reduction in commuting cost for households living in the periphery (Brueckner and Sridhar, 2012[18]).
Transaction costs, especially stamp duties levied by states on the sale of immovable property, albeit decreasing, are relatively high compared to many EMEs (Figure 2.16). High transaction costs reduce mobility by increasing the cost of moving to places with more abundant jobs and better housing conditions. India should consider lowering these costs to promote mobility. The fiscal loss should be compensated by the greater use of recurrent taxes on immovable property based on updated property values, which are currently low, or the reintroduction of inheritance taxes (OECD, 2017[19]).
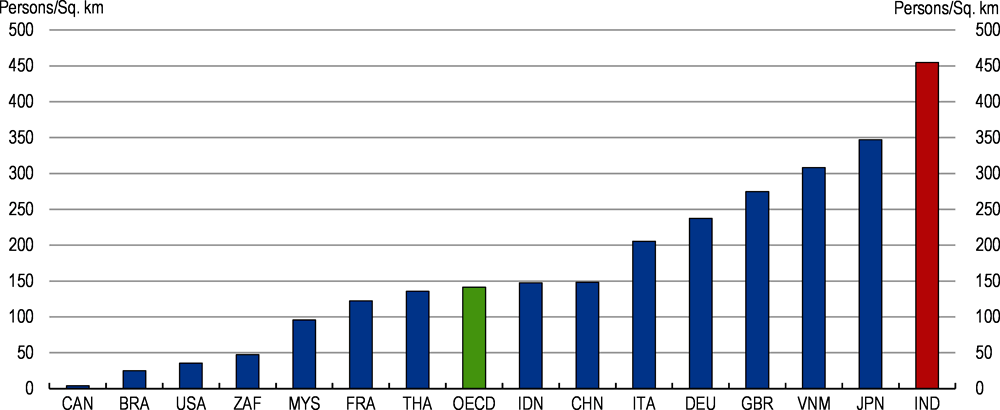
Note: OECD refers to an unweighted average.
Source: World Bank, World Development Indicators database.
Note: Transactions costs are the costs of buying a property plus the costs of selling and include fees and taxes incurred in registering the property, real estate agents fees, legal fees and sales and transfer taxes.
Source: Global Property Guide.
copy the linklink copied! Improving affordability of housing with government support
Housing has been a top policy priority for a long time in India but with mixed results
The different governments have launched many initiatives to secure decent housing for their citizens (Box 2.2). In many cities, the development of affordable housing and the rehabilitation of slums generated areas where poor and rich people live together, reducing social segregation. The persistent and acute housing shortage along with rising demand for affordable housing in cities point to many challenges.
The different governments have launched several initiatives to provide good quality, affordable housing for all. In 1988, the National Housing Policy aimed at providing a comprehensive strategy to housing by encompassing finance, technology, land, materials, and targeted poverty alleviation. In 1998, the National Housing and Habitat Policy aimed at the construction of two million dwelling units each year and ensure priority to the housing sector (National Housing Bank, 2018[20]).
In 2005, the Jawaharlal Nehru National Urban Renewal Mission (JNNURM) was launched and included two components: Basic Services for Urban Poor and Integrated Housing and Slum Development Programme, which aimed at integrated development of the slums to provide shelter, basic services and other related civic amenities to the urban poor. The Mission was initially launched for a seven-year period and was extended up to 2017.
In 2009, the Rajiv Awas Yojana (RAY) programme was launched to promote a slum-free India in 5 years. In 2013, it included the Affordable Housing in Partnership (AHP) scheme to increase the stock of affordable housing. In June 2015, RAY was replaced by the Housing for All programme.
The impact of those programmes has been limited as the budget allocated to them was too small, despite sound objectives. Moreover, some programmes lack coordination among different stakeholders. For instance, different components of the JNNURM involved separate ministries at the Central level and were implemented by different entities at the local level (Tiwari and Rao, 2016[3])).
Most support in India has been for house ownership
In 2015, the Indian government launched the Housing for all (Pradhan Mantri Awas Yojana) programme with the aim of providing every family with “a pucca house (solid house) with water connection, toilet facilities, 24x7 electricity supply and access” by 2022. The programme is split in an urban and a rural schemes. The target is to construct 11.2 million houses in urban areas and 29.5 million in rural areas (10 million to be achieved by March 2019). This roughly corresponds to the estimated housing shortage around 2011. In March 2019, 83% of the 10 million rural targets had been achieved. While these programme are well targeted, a key concern is whether they can reach the very poor.
The urban programme has four pillars: In-situ Rehabilitation of existing slum dwellers using land as a resource through private participation, the Credit Linked Subsidy, the Affordable Housing in Partnership, and a subsidy for beneficiary-led individual house construction/enhancement (Box 2.3). A model for Private Public Partnership was issued to incentivise the private sector to participate in the provision of affordable housing (Ministry of Housing and Urban Affairs, 2017[21]). Some states such as Gurajat have used this model in the context of the slum rehabilitation program. In October 2019, around 60% of the sanctioned houses were grounded (construction under progress) and 30% have been completed. Some states have registered significant progress (Figure 2.17).
The aim of the rural programme is to replace kutcha houses (non-durable) by pucca houses, enhance the well-being of beneficiaries by providing basic amenities, improve the quality of the construction through rural mason training and achieve disaster-resilient and environmentally-sustainable houses suited to local geo-climatic conditions. Progress, so far, follows what was expected, with about 80%, of houses targeted already built. Progress is monitored through geo-tagged photographs. Complete details of beneficiaries and payments made to them are available publicly. The payment is electronically transferred to the beneficiary account through a Direct Benefit Transfer platform which limits the intervention of intermediaries and reduces corruption.
Since 2009, the government has also provided an interest subsidy to the poorest households for house purchases. The Interest Subsidy Scheme for Housing the Urban Poor, targeted to the Economically Weak Sections (EWS) and Low Income Group (LIG) of the urban population, was designed to promote housing loans and increase home ownership. The scheme is still available under the Housing for All programme (the so-called Credit Linked Subsidy Scheme). While the other pillars of the Housing for All programme are centrally sponsored schemes implemented by the state government agencies, this is a central government scheme implemented through banks and housing finance companies (Kundu and Kumar, 2017[22]). Under this scheme, the calculation of the interest subsidy is uniform across banks and housing finance companies. Between 2015 and 2019, 718 000 people used the Credit Linked Subsidy Scheme while only around 18 000 people benefitted from the interest subsidy scheme between 2008 and 2013.
Pradhan Mantri Awas Yojana – Urban (PMAY-U):
PMAY-U aims at addressing the housing requirement of urban poor including slum dwellers.
Beneficiaries include Economically Weaker Section (EWS), Low-Income Groups (LIGs) and Middle Income Groups (MIGs). The annual income cap is up to INR 300 000 (USD 400) for EWS, INR 300-600 000 for LIG and INR 600-1 800 000 for MIG. EWS beneficiaries are eligible for assistance in all four components of the programme whereas LIG and MIG categories are eligible under only Credit Linked Subsidy Scheme (CLSS) component of the programme.
The beneficiary family should not own a pucca house either in his/her name or in the name of any member of his/her family in any part of India to be eligible to receive central assistance under the programme.
The programme supports construction of houses up to 30 m2 carpet area with basic infrastructure. Slum redevelopment projects and Affordable Housing projects in partnership (including Private Public Partnerships) should have basic infrastructure like water, sanitation, sewerage, road, electricity etc.
The houses constructed/acquired with central assistance under the programme should be in the name of the female head of the household or in the joint name of the male head of the household and his wife, and only in cases when there is no adult female member in the family, the house can be in the name of male member of the household.
Credit Linked Subsidy Scheme
The Credit Linked Subsidy Scheme first targeted the EWS and LIG seeking housing loans from banks, housing finance companies and other such institutions. It has been extended in December 2018 to the MIG with effect from 1st January, 2017. The subsidy is available for housing loans provided for new construction and addition of rooms, kitchen, toilet etc. to existing dwellings as incremental housing. The beneficiary can build a larger house, but interest subsidy would be limited to the maximum amount allowed. The generosity of the subsidy further depends on the income groups (Table 2.4).
Subsidy for beneficiary-led individual house construction
This is assistance to individual eligible families belonging to EWS categories to either construct new houses or enhance existing houses on their own to cover the beneficiaries who are not able to take advantage of any other component of the mission. Such families may avail of central assistance of INR 150 000 (USD 2 100) and should be part of Housing For All Plan of Action. A minimum addition of 9 m2 of carpet area to the existing house will be required to be eligible for Central assistance under the ‘Beneficiary Led Construction (Enhancement)’ component of the housing mission.
To access the subsidy, a household must display adequate documentation regarding land ownership. Such beneficiaries may reside either in slums or outside the slums. Beneficiaries in slums which are not being redeveloped can be covered under this component if they have a kutcha or semi pucca house.
Pradhan Mantri Awas Yojana-Rural (PMAY-G)
Under this programme, financial assistance is provided for construction of pucca house to all houseless and households living in sub-standard houses. The assistance is INR 120 000 (USD 1 750) in plain areas and INR 130 000 (USD 1 900) in hilly states and difficult areas. The cost of assistance is to be shared between the centre and state governments in the ratio 60:40 in plain areas and 90:10 for North Eastern and hilly states.
The minimum size of the house is 25 m2 with a hygienic cooking space.
PMAY-G selects beneficiaries using housing deprivation parameters in the Socio Economic and Caste Census (SECC), 2011, which is verified by the Gram Sabhas (village council). Parameters reflecting housing deprivation are assigned priority with those who receive a high score on the following parameters: households with no adult member between ages 16 and 59, female-headed households with no adult male member between ages 16 and 59, households with no literate adult above 25 years, households with any disabled member and no able-bodied adult member, and landless households deriving a major part of their income from casual manual labour.
Source: Ministry of Housing and Urban Affairs and Ministry of Rural Development
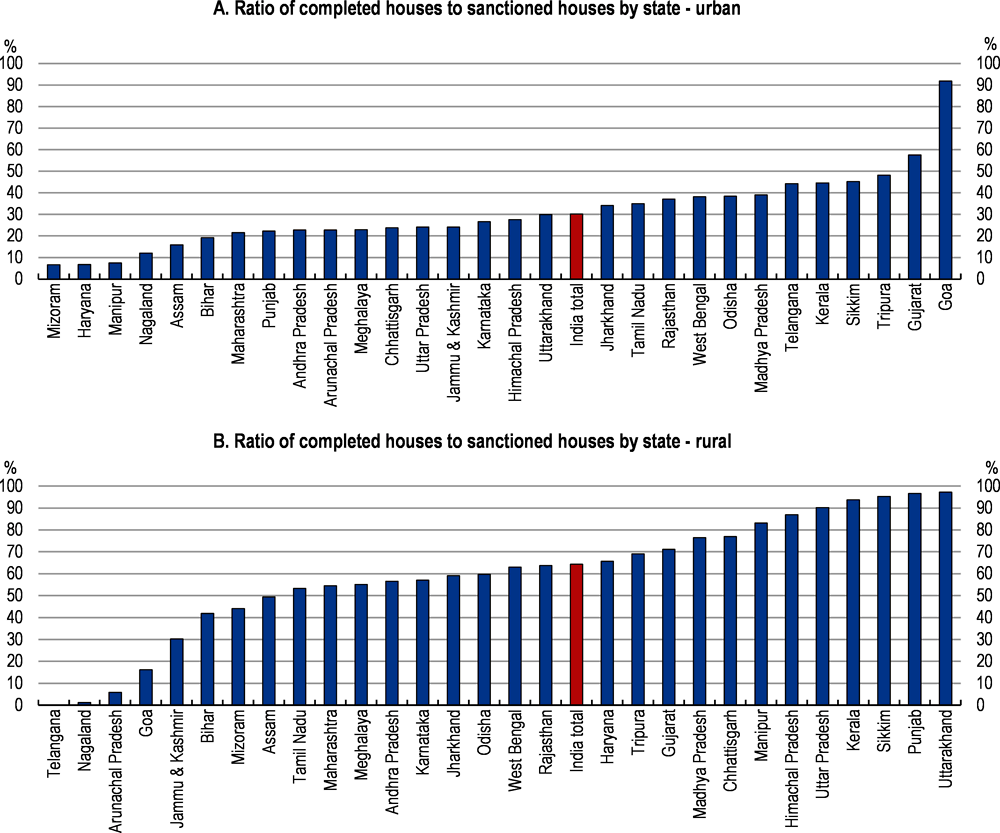
Note: Number of completed houses as a share of number of sanctioned houses, under the Pradhan Mantri Awas Yojana project. Data extracted on 12 November 2019.
Source: Ministry of Rural Development and Ministry of Housing and Urban Affairs.
The integration of housing into a global urban development policy
Housing policy should be integrated into a global urban development policy which includes the provision of quality public services, sanitation, urban transports and access to employment opportunities.
The development of urban infrastructure and public service provision has not followed urban population growth, leading to an important shortage in waste management, water, energy, transport, education and health. To address these challenges, the government has launched several initiatives such as the Swachh Bharat Mission (urban), the Atal Mission for Rejuvenation and Urban Transformation and the smart cities programme. The Delhi Metro, begun at the end of the 1990s, is developing quickly (343 km). By December 2017, 425 km of metro lines were operational in Delhi, Noida, Gurugram, Kolkata, Mumbai, Chennai, Bengaluru, Hyderabad, Jaipur, Lucknow and Kochi and 684 km were under construction in various cities (Ministry of Finances, 2018[10]).
The objective of the smart cities programme is to promote sustainable and inclusive cities that provide core infrastructure and give a decent quality of life to their citizens, a clean and sustainable environment and application of ‘Smart’ Solutions. The programme, which aims to develop 100 smart cities with the support of the private sector, faces some challenges. For instance, the urban local bodies which will play an important role in the implementation of the programme lack adequate financial and professional resources. Collaboration between different bodies is inefficient, and the business environment is cumbersome as regards public procurement, land acquisition, dispute resolution and procedures for certifications and environmental clearances (World Economic Forum, 2016[23]).
Support to the rental market is needed
The government can intervene to boost the construction of buildings for private and social rental. In some countries, the government provides subsidies to private developers to make the construction for rent more profitable or to offset high development costs. For instance, in the United States the Low Income Tax Credit Program provides tax breaks to house builders if they reserve units for rent to lower-income households (Joint Center for Housing Studies, 2008[24]). In Colombia, the Ministry of Finance recently allocated credit at low rate to construction companies to finance social housing. However, in most OECD countries supply-side government interventions are related to the provision of social housing. The Indian government could provide incentives (through credit subsidies) to the private sector to construct buildings for rent or convert part of the vacant housing stock into rental dwellings.
Developing the rental market was first discussed in the 1988 National Housing Policy. In 2015, the then Ministry of Housing and Urban Poverty Alleviation proposed expanding rental social housing for the urban poor. This policy would involve both the central and the state governments and encompass both supply and demand side interventions. However, this policy has not been implemented so far. As a consequence, the provision of public social rental housing is almost inexistent in India so far.
Developing the social rental market for the poor
Providing social rental housing to low income people is a common policy across OECD countries and emerging economies (Box 2.4). It is, however, generally more efficient to support the housing needs of the poor people by giving them means-tested housing-cost subsidies, generally known as housing allowances. Compared to social rental housing, this instrument provides more equitable access to the benefits and fewer disincentives to housing mobility. However, housing allowances may also be less effective in providing access to good-quality rental housing, especially for vulnerable households, who can face difficulties in finding private rental contracts as a result of their unstable revenues. Housing allowances may also have perverse effects on rental prices (Salvi del Pero et al., 2016[25]). Given the high prices of housing and size of the migration inside India and to promote mobility, the development of a social housing stock should be considered.
In Brazil, beginning in the early 2000s, the municipality of São Paulo developed a rental housing program based on government ownership and rent subsidies for poor people. The program consists of upgrading slums and constructing new houses. A targeted system of rental vouchers was further implemented to support rent for poor families in privately owned units.
In China, municipal governments are responsible for building and managing rental housing for low and middle income people. In Beijing, government-subsidised apartments in 2015 were rented at 80% of the market rate. Municipalities in China face difficulties in financing the construction of housing and often build public rental estates outside city centres, leading to long commute times.
Singapore had favoured ownership for decades and the public rental housing sector meets the needs of the low-income population. Basic flats are rented at heavily subsidised prices (10 to 30% of the market rent) to the poor and those who have no other housing options or family support.
In France, despite supports for home ownership, the housing rental sector is large. Both the private and the social sector receive a significant part of the housing subsidies. After the disengagement of institutional investors in the 1970s and 1980s due to low returns and heavy management costs, private rental housing began receiving generous tax incentives. In 2010, the housing policy represented more than 2% of GDP. Direct subsidies are part of the welfare system and benefit more than 40% of tenants.
Source: (Peppercorn and Taffin, 2013[11])
Some state governments have provided social housing to low-income households. For instance, the Mumbai Metropolitan Regional Development Authority (MMRDA) launched the Rental Housing Scheme in 2008 with the aim of developing flats for renting, by extending the Floor Space Index (FSI) and allowing builders to purchase additional FSI. However, after the construction of the buildings, management of the rental scheme by the MMRDA was poorly organised. Thus, the government had to sell these units because of its difficulty in (i) identifying rental users in a fair and transparent manner (ii) raising rents, and (iii) forcing eviction in case of non-payment and/or misbehaviour (IDFC, 2018[1]) .
Despite the difficulties encountered in some states and taking into account the large on-going urbanisation, India could consider developing some forms of social rental housing in cities to tackle the needs of seasonal and permanent migrants. Ideally, social housing should be designed to avoid spatial segregation and promote social mixing by ensuring that locations are well integrated into the urban structure and have appropriate access to transport networks and quality public services such as education, health and culture. The development of this social rental housing could be included in the slum rehabilitation programme, where some parcels could be reserved for this purpose. In principle, social housing should be targeted to disadvantaged groups and means-tested. To be efficient, the eligibility criteria should be reassessed regularly. If tenants’ eligibility has changed, an increase in the rent or a termination of the contract should be envisaged.
Further improving access to housing finance can reduce some of the shortage and raise affordability
Access to credit has often been cited as one constraint to affordable housing. Housing credit has expanded, though from a low base. It has grown faster than total credit, driven mainly by government initiatives such as fiscal incentives and the Credit Linked Subsidy Scheme (Figure 2.18). However the ratio of household debt to GDP is much lower than in OECD countries and EMEs (Figure 2.19). The loan-to-value ratio (which restricts housing loans to a certain proportion of the house value) is set at a reasonable level to avoid a real-estate boom (Figure 2.20). It is comparable to those in other emerging economies (Cerutti et al., 2015[26]). Credit information could be improved.
Housing financing is mainly provided by housing finance companies (around 80% are Public Limited and 20% Private Limited), banks and, to a much lesser extent, co-operative institutions. Banks and housing finance companies (HFC) are not allowed to finance land purchases. Since the late 1990s, the number of housing finance entities has increased and the market has deepened. Outstanding housing loans increased from 6.8% of GDP in 2010-11 to 10.3% in 2017-18 (National Housing Bank, 2018[20]). The HFC share in total loans to the housing sector has increased in the past decade to reach almost 44% in 2017-18 (RBI).
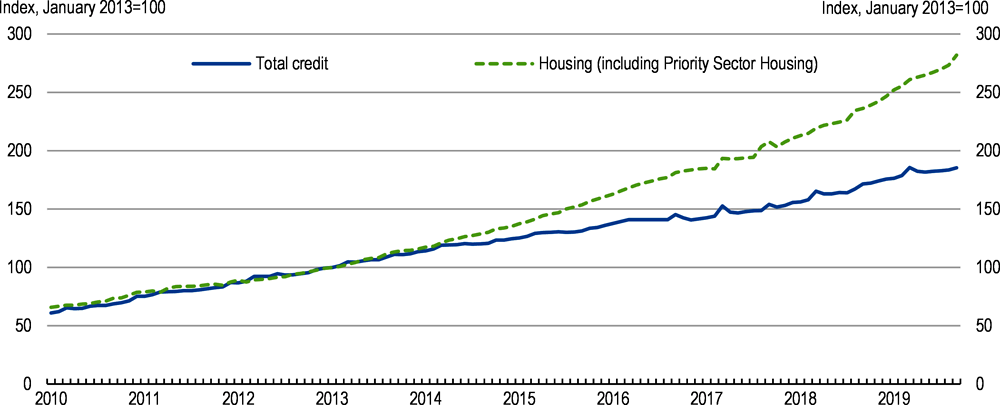
Note: Total credit excludes credit for food (related) items.
Source: RBI.
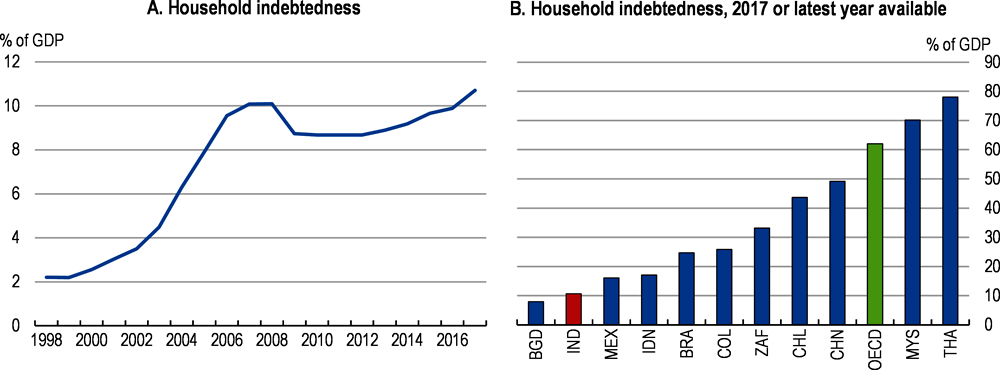
Note: Data for India include bank credit only. The ratio of household indebtedness would be around 17% if one would add the credit from Non-Bank Financial Companies and Housing Finance Companies.
Source: IMF, Global Debt database.
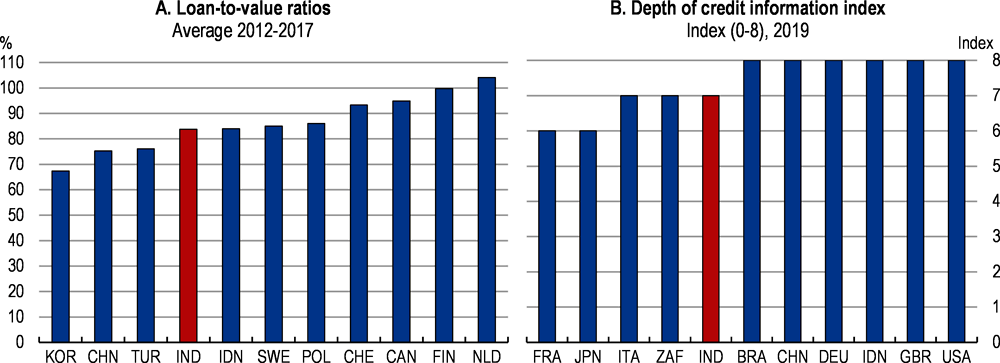
Note: Loan-to-value ratios refer to the maximum loan-to-value ratio applied to mortgage loans.
Source: (Cournede B., S. Sakha and V. Ziemann, 2019[27]); World Bank, Doing Business.
Bank lending to the real estate sector has been affected by the increase in Non-Performing Loans (NPLs), higher risk provisioning assigned to the real estate sector by the RBI and decreasing profits in the sector. While NPLs accounted for 1.3% of total loans in 2018 for HFC, they reached 6% for NBFCs and almost 11% for the banks in September 2018 (RBI, 2018[28]). The real estate sector has also been affected with liquidity issues and increasing debt as the unsold housing stock has increased. The RBI has implemented prudential norms for housing finance to ensure that portfolios are healthy and resilient to systemic risks. Moreover, the regulation of HFCs has come under the purview of the Reserve Bank with effect since August 2019 while supervision of HFCs continues to remain with the National Housing Bank. Housing finance companies are now considered as part of NBFCs for regulatory purpose bringing harmonization of regulations between NBFCs and HFCs. Access to finance can further be improved by enhancing credit information and implementing further prudential measures.
A significant part of the bank credit to housing (around 40% in 2018) comes under the priority sector lending schemes. The RBI requires banks to provide a certain part (40%) of their lending to specific sectors including housing for economically weaker sections and low income groups. Banks can provide loans up to a certain amount to individuals who want to buy or repair a dwelling. Moreover, loan to any governmental agency and to Housing Finance Companies that, in turn, lend the money for the purpose of purchase/construction/reconstruction of individual dwelling units or slum rehabilitation are also eligible.
In June 2018, the RBI raised the housing loan limits under the priority sector lending scheme to converge with the Affordable housing scheme. While this measure can help low-income people to buy a house, it can also lead to an increase in NPLs in the construction sector. The RBI has also constituted up a Committee on the Development of Housing Finance Securitisation Market, with a view to review the existing state of mortgage securitisation in India and various issues constraining market development, and to develop the market further.
The housing sector benefited from the introduction of the Insolvency and Bankruptcy Code (IBC) that aims at simplifying and shortening the closure of construction businesses mainly by recovering large parts of non-performing assets. The introduction of the IBC has led to the recognition of home-buyers as financial creditors, which allowed them to receive a proportionate share of the liquidation proceeds just like financial institutions. The IBC, in line with the RERA, also allows home-buyers to claim interest to compensate for a delayed possession.
References
[8] Andrews, D., A. Caldera Sánchez and Å. Johansson (2011), “Housing Markets and Structural Policies in OECD Countries”, OECD Economics Department Working Papers, No. 836, OECD Publishing, Paris, https://dx.doi.org/10.1787/5kgk8t2k9vf3-en.
[6] Barnhardt, S., E. Field and R. Pande (2017), “Moving to opportunity or isolation? Network effects of a randomized housing lottery in urban India”, American Economic Journal: Applied Economics, https://doi.org/10.1257/app.20150397.
[18] Brueckner, J. and K. Sridhar (2012), “Measuring welfare gains from relaxation of land-use restrictions: The case of India’s building-height limits”, Regional Science and Urban Economics, https://doi.org/10.1016/j.regsciurbeco.2012.08.003.
[26] Cerutti, E. et al. (2015), Housing Finance and Real-Estate Booms: A Cross-Country Perspective; by Eugenio Cerutti, Jihad Dagher, and Giovanni Dell’Ariccia; June 2015; SDN/15/12.
[12] Chandrasekhar (2017), On the importance of triangulating datasets to examine indians on the move, Center for Policy Research.
[27] Cournede B., S. Sakha and V. Ziemann (2019), “Empirical links between housing markets and economic resilience”, OECD Economics Department Working Papers, Vol. 1558.
[1] IDFC (2018), Making Housing Affordable, IDFC Institute.
[24] Joint Center for Housing Studies (2008), America’s Rental Housing.
[14] Keshri and Bhagat (2012), “Temporary and seasonal migration in India”, Economic and Political Weekly, Vol. XLVII/4.
[15] Knight Frank (2018), India real Estate.
[4] Kumuda, D. (2014), “Homeless population in India”, Global Journal for Research Analysis, Vol. 3/8.
[22] Kundu and Kumar (2017), “Housing for the Urban Poor?”, Economic and Political Weekly, Vol. LII/52.
[10] Ministry of Finances (2018), Economic Survey 2017-2018.
[13] Ministry of Finances (2017), “Economic Survey 2016-17”.
[21] Ministry of Housing and Urban Affairs (2017), Public Private Partnership Models for Affordable Housing.
[30] Ministry of Housing and Urban Affairs (2012), Report of the technical group on urban housing shortage.
[16] Mishra and Suhag (2017), Land records and titles in India.
[9] Nallathiga, R. (2005), Regulatory impacts on Land and Housing Markets in Mumbai.
[20] National Housing Bank (2018), Report on Trend and Progress of Housing in India.
[32] OECD (2019), Under Pressure: The Squeezed Middle Class, OECD Publishing, Paris, https://dx.doi.org/10.1787/689afed1-en.
[17] OECD (2018), Rethinking Urban Sprawl: Moving Towards Sustainable Cities, OECD Publishing, Paris, https://dx.doi.org/10.1787/9789264189881-en.
[19] OECD (2017), OECD Economic Surveys: India 2017.
[31] Oxford Poverty and Human Development Initiative (2018), Global Multidimensional Poverty Index 2018: The Most Detailed Picture To Date of the World’s Poorest People.
[11] Peppercorn, I. and C. Taffin (2013), Rental Housing, The World Bank, https://doi.org/10.1596/978-0-8213-9655-1.
[5] RBI (2019), Residential Asset Price Monitoring Survey.
[28] RBI (2018), Report on Trend and Progress of Banking in India 2017-18.
[25] Salvi del Pero, A. et al. (2016), “Policies to promote access to good-quality affordable housing in OECD countries”, OECD Social, Employment and Migration Working Papers, No. 176, OECD Publishing, Paris, https://dx.doi.org/10.1787/5jm3p5gl4djd-en.
[29] Sattar, S. (2014), “Homeless in India”, Shelter, Vol. 15/1.
[2] Soundararajan, N. (2017), Affordable Housing - The Next Steps, Pahle Foundation.
[7] Tandel et al. (2015), “Decline of rental housing in India: the case of Mumbai”, Environment and Urbanization, Vol. 28, pp. 259-274, https://doi.org/10.1177/0956247815620316.
[3] Tiwari, P. and J. Rao (2016), ADBI Working Paper Series Housing Markets and Housing Policies in India Asian Development Bank Institute, http://www.adb.org/publications/major-challenges-facing-small-and-medium-sized-.
[23] World Economic Forum (2016), Reforms to Accelerate the Development of India’s Smart Cities.
Metadata, Legal and Rights
https://doi.org/10.1787/554c1c22-en
© OECD 2019
The use of this work, whether digital or print, is governed by the Terms and Conditions to be found at http://www.oecd.org/termsandconditions.