
copy the linklink copied!Chapter 7. Girls’ and boys’ performance in PISA
This chapter analyses performance differences between boys and girls in the three core PISA subjects – reading, mathematics and science – in 2018. It identifies those countries where these disparities shrank over the past decade. It also discusses the variations in performance amongst boys and girls, and their relationship with students’ socio-economic status.
PISA has consistently found that girls outperform boys in reading and, to a lesser extent, that boys outperform girls in mathematics, on average across all participating countries and economies (OECD, 2016[1]; OECD, 2015[2]). Gender disparities in achievement are a matter of considerable concern, as they may have long-term consequences for girls’ and boys’ personal and professional future. Those boys who lag behind and lack basic proficiency in reading may face serious difficulties in their further education, in the labour market and in everyday life. Equally, the under-representation of girls amongst top performers in science and mathematics can at least partly explain the persistent gender gap in careers in science, technology, engineering and mathematics (STEM) fields – which are often amongst the highest-paying occupations.
However, the magnitude, pervasiveness and practical significance of the gender gap in student performance vary across countries. Over the past few decades many countries have made significant progress in narrowing, and even closing, the gender gap in educational attainment (OECD, 2015[2]). Gender-related disparities in achievement thus appear to be neither innate nor inevitable.
Scientific debates about gender inequalities in education have highlighted several explanations for the variations in the educational attainment of girls and boys across countries and over time. Some suggest that differences in achievement may be partly related to differences in how girls and boys are socialised, both at home and in school; for a survey, see for instance Hadjar et al., 2014[3]. Identifying which countries and economies have been able to narrow or close the gender gap in student performance may help determine the conditions and practices that allow both boys and girls to realise their potential.
-
In all countries and economies that participated in PISA 2018, girls significantly outperformed boys in reading – by almost 30 score points, on average across OECD countries. The narrowest gender gaps (less than 20 score points) were observed in Argentina, Beijing, Shanghai, Jiangsu and Zhejiang (China), Chile, Colombia, Costa Rica, Mexico, Panama and Peru; the widest (more than 50 score points) were observed in Finland, Jordan, the Republic of North Macedonia, Qatar, Saudi Arabia and the United Arab Emirates.
-
In Estonia, Ireland, Macao (China), Peru and Singapore, the gender gap in reading performance narrowed between 2009 and 2018; and both boys and girls scored higher in 2018 than their counterparts did in 2009.
-
On average across OECD countries in 2018, 28% of boys did not reach proficiency Level 2 in reading. Only in five PISA-participating countries and economies – Beijing, Shanghai, Jiangsu and Zhejiang (China), Estonia, Hong Kong (China), Ireland and Macao (China) – did more than one in four disadvantaged boys attain Level 2 in reading. In 19 countries and economies, more than three in four disadvantaged boys scored below Level 2 in reading.
-
Boys outperformed girls – but by only five score points – in mathematics, on average across OECD countries. While boys significantly outperformed girls in mathematics in 32 countries and economies, in 14 countries/economies the opposite pattern was observed. The largest gender gap in mathematics performance was observed in Qatar, where girls scored around 24 points higher than boys.
-
Girls slightly outperformed boys in science, by only two score points, on average across OECD countries. In only six countries/economies – Argentina, Beijing, Shanghai, Jiangsu and Zhejiang (China), Colombia, Costa Rica, Mexico and Peru – did boys significantly outperform girls in science, while the opposite was true in 34 countries and economies.
copy the linklink copied!The gender gap in PISA performance
In PISA 2018, girls outperformed boys in reading by almost 30 score points, on average across OECD countries (Figure II.7.1). While girls outperformed boys in reading in every participating country and economy, the gap was much wider in some countries than in others. The narrowest gender gaps (less than 20 score points) were observed in Argentina, Beijing, Shanghai, Jiangsu and Zhejiang (China) (hereafter “B-S-J-Z [China]”), Chile, Colombia, Costa Rica, Mexico, Panama and Peru; the widest (more than 50 score points) were observed in Finland, Jordan, the Republic of North Macedonia (hereafter “North Macedonia”), Qatar, Saudi Arabia and the United Arab Emirates.
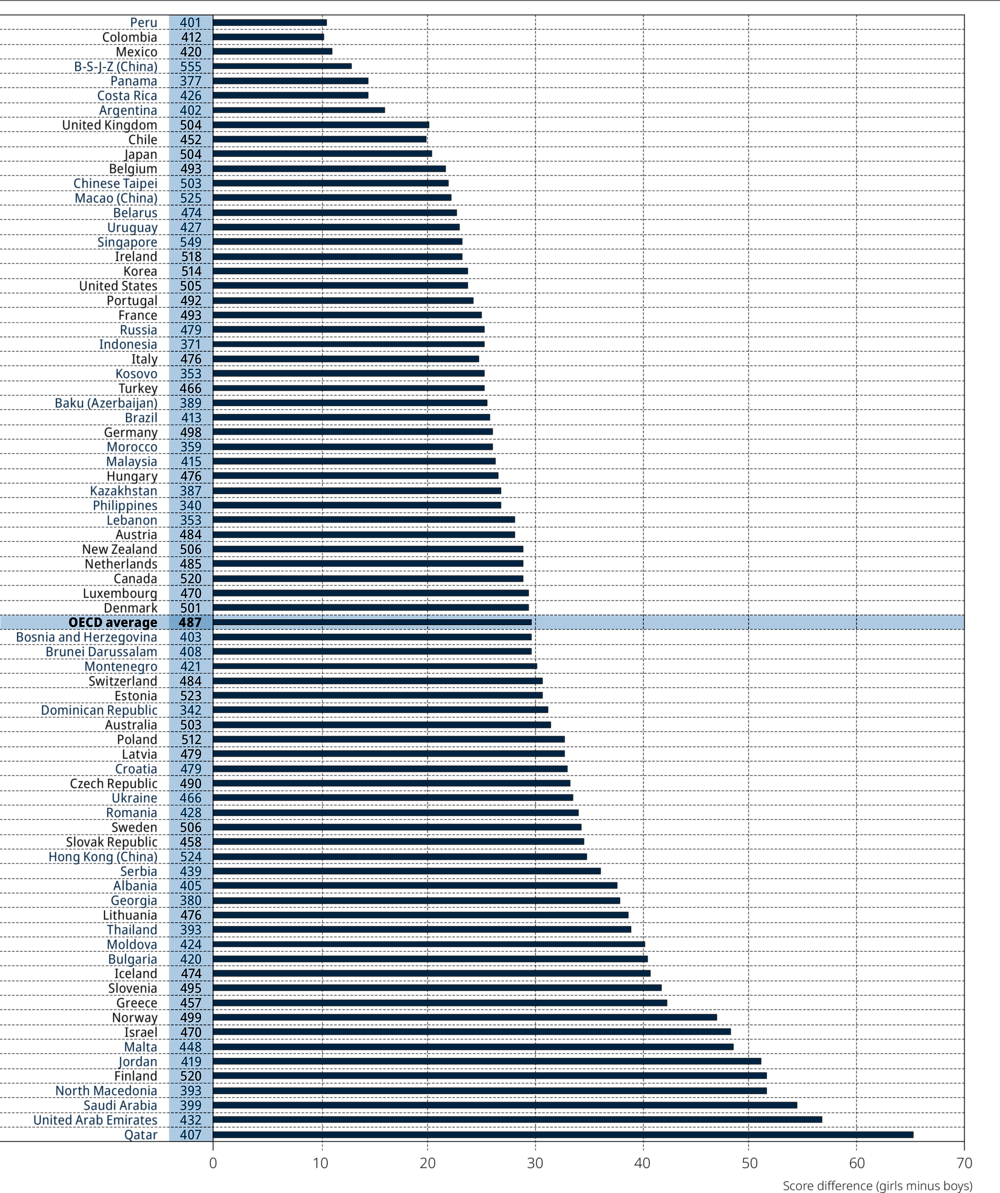
Notes: The mean score in reading is shown next to the country/economy name.
All difference are statistically significant (see Annex A3).
Countries and economies are ranked in ascending order of the score-point difference related to gender (girls minus boys).
Source: OECD, PISA 2018 Database, Tables I.B1.4 and II.B1.7.1.
The size of the gender gap in reading does not appear to be related to average performance (Figure II.7.2). However, in 16 of the 25 countries and economies whose mean score in reading was higher than the OECD average, the difference in reading performance between boys and girls was smaller than the average gender gap in reading across OECD countries. Amongst this set of high-performing countries, differences in reading performance between boys and girls ranged from 13 score points in B-S-J-Z (China) to 52 score points in Finland.
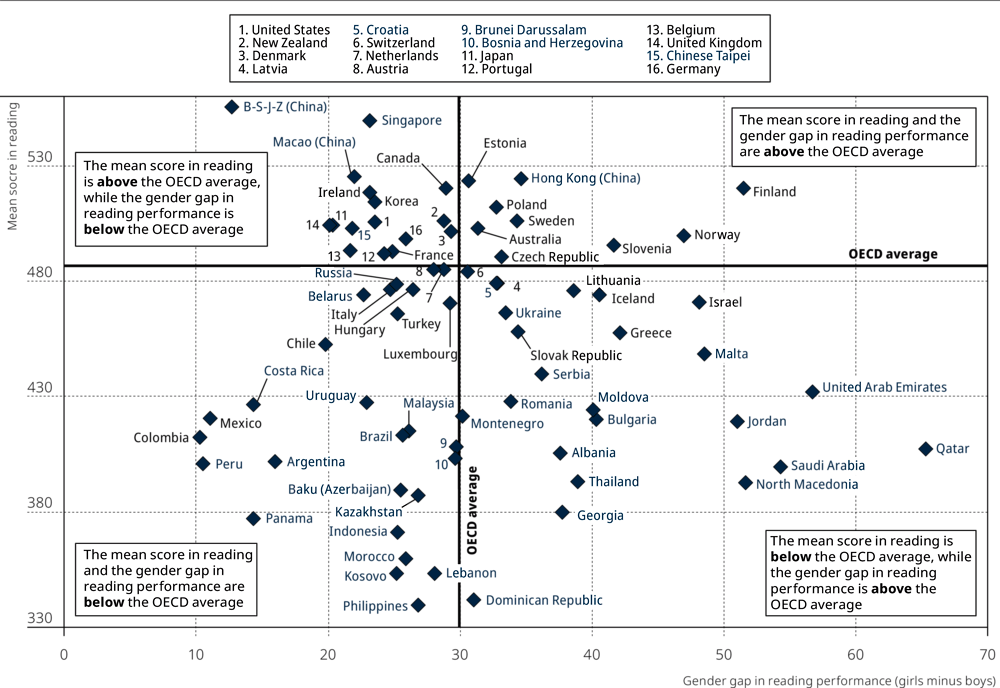
Source: OECD, PISA 2018 Database, Tables I.B1.4 and II.B1.7.1.
Boys outperformed girls in mathematics by a much smaller margin than girls outperformed boys in reading. The average gender gap in mathematics amounted to only five score points, in favour of boys, on average across OECD countries. Despite the stereotype that boys are better than girls at mathematics, boys significantly outperformed girls in mathematics in only 32 of the 79 countries and economies that participated in PISA 2018. The largest difference in scores between boys and girls, in favour of boys, was seen in Colombia, where boys scored around 20 points higher than girls (Table II.B1.7.3 and Figure II.7.2, available on line). In Argentina, Costa Rica, Italy and Peru, the difference amounted to between 15 and 18 points. However, in 14 countries and economies, including Brunei Darussalam, Finland, Iceland, Indonesia, Malaysia, Malta, North Macedonia, Norway, the Philippines, Qatar, Saudi Arabia, Thailand and the United Arab Emirates, girls significantly outperformed boys in mathematics.
The gender gap in science performance was narrower than that observed in mathematics and reading. On average across OECD countries in 2018, girls outperformed boys in science by two score points; and in around half of the countries/economies assessed, the performance difference between boys and girls was not statistically significant (Table II.B1.7.5 and Figure II.7.3, available on line). In only 6 countries/economies was boys’ performance in science significantly higher than that of girls; the opposite was observed in 34 countries and economies. The widest gender gaps in science performance, in favour of girls, were observed in Qatar (by 39 points), Jordan (by 29 points), Saudi Arabia (by 29 points) and the United Arab Emirates (by 26 points). In Albania, Bulgaria, Finland, Georgia, Greece, Israel, Malta, the Republic of Moldova, North Macedonia, Norway and Thailand, the gender gap in science performance, in favour of girls, ranged from 10 to 24 score points. By contrast, boys significantly outperformed girls in science in Argentina, B-S-J-Z (China), Colombia, Costa Rica, Mexico and Peru, where there was a 9 to 13 score-point difference between boys and girls.
The PISA 2018 reading literacy framework, while similar in many respects to the PISA 2009 reading literacy framework, put greater emphasis on multiple-source texts, i.e. texts composed of several units of text, created separately by different authors (for a detailed description, see Chapters 1 and 5 in PISA 2018 Results [Volume I], What Students Know and Can Do (OECD, 2019[4])). These types of text are more prevalent in digital media, and the computer delivery of the PISA reading test made it easier to assess students’ proficiency in reading them. While a text of multiple sources is not necessarily more difficult to read, the inclusion of multiple-source units helped expand the range of higher-level reading processes and strategies measured by PISA. In 2018 these included searching for information across multiple documents, integrating across texts to generate inferences, assessing the quality and credibility of sources, and handling conflicts across sources.
Two sets of reading subscales were developed. One set is related to sources, distinguishing between single-source texts and multiple-source texts. The other is related to processes, and distinguishes amongst three skills: locating information, understanding, and evaluating and reflecting. It is usually inadvisable to compare subscales related to different framework components, i.e. comparisons between a process subscale and a source subscale, but comparisons across subscales within a particular classification of assessment task is considered as sufficiently reliable.
In general, scores on any section of the PISA reading assessment are highly correlated with the overall reading score and with scores in other subscales (see Chapter 5 in PISA 2018 Results [Volume I], What Students Know and Can Do (OECD, 2019[4])). Students who perform well in one aspect of reading also tend to perform well in other areas of reading. However, Chapter 5 of Volume I (OECD, 2019[4]) also shows variations in performance across different subscales at the country level; these may reflect differences in emphasis in education systems’ curriculum and teaching. One may also identify differences related to gender, as boys and girls differ in how they spend their leisure time (see Chapter 8 in this volume), for example, reading or using the Internet, which may affect performance on one or another of the subscales.
In general, the gender gaps in the subscales were consistently of the same magnitude. For the subscales related to text source, the gender gap in favour of girls appeared to be slightly smaller for multiple-source texts than for single-source text; but the differences appear relatively small compared to the gender gap in these subscales. On average across OECD countries, the gender gap in favour of girls in reading single-source texts was 32 score points (Table II.B1.7.10) but 26 score points in reading multiple-source texts (Table II.B1.7.11).
The gender gaps in favour of girls in the process subscales (locating information, understanding, and evaluating and reflecting) are large and significant in all countries; but the magnitude of girls’ advantage in these subscales varies across countries/economies (see Tables II.B1.7.7, II.B1.7.8 and II.B1.7.9).
In general, and as shown in Figure II.7.3, the magnitude of the gender gap in reading can predict the size and direction of the gender gap in mathematics (the R2 value in the figure is 0.63). In countries and economies with the widest gender gaps in reading in favour of girls, including Finland, North Macedonia, Qatar, Saudi Arabia and the United Arab Emirates, girls also outperformed boys in mathematics. By contrast, in countries and economies where the gender gap in reading was narrowest, including Argentina, B-S-J-Z (China), Chile, Colombia, Costa Rica, Mexico, Panama and Peru, boys outperformed girls in mathematics by a larger margin than the OECD average.
However, the relationship is not deterministic. For instance, while the gender gap in reading in favour of girls was around 25 score points in France, Indonesia, Italy, Kosovo, the Russian Federation and Turkey, the gender gap in mathematics performance in these countries ranged from 16 points in favour of boys in Italy to 10 points in favour of girls in Indonesia.
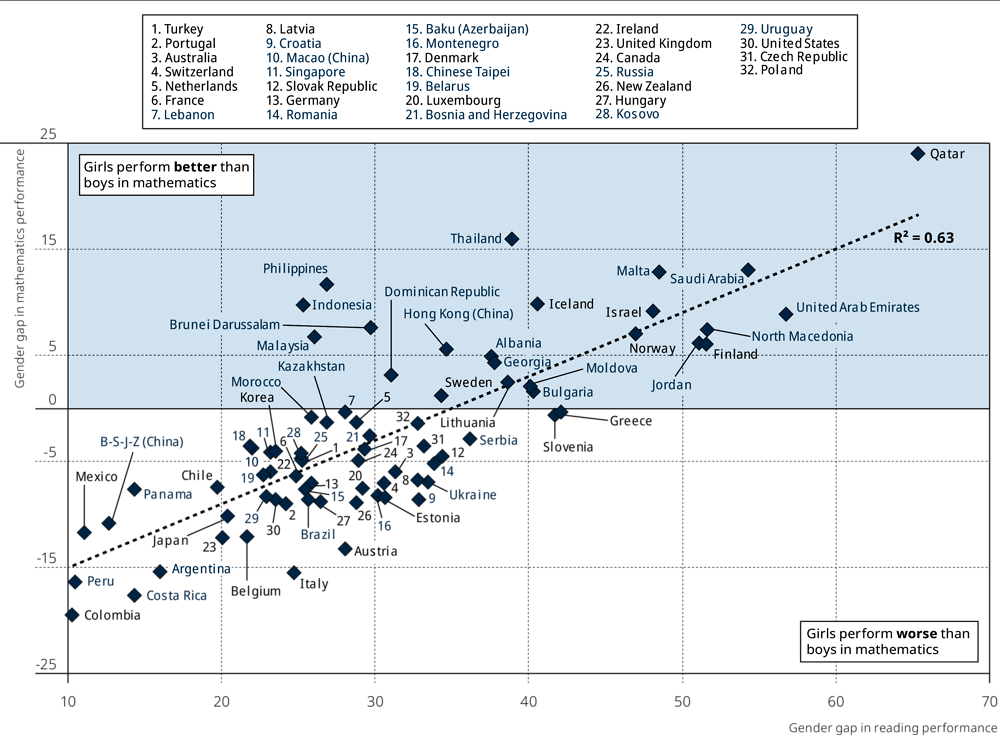
Note: Gender gap refers to the difference between girls and boys (girls minus boys).
Source: OECD, PISA 2018 Database, Tables II.B1.7.1 and II.B1.7.3.
Trends in the gender gap
How have the gender gaps in student performance evolved over the past decade? A comparison of results in reading performance between 2009, when reading was also the main subject assessed in PISA, and 2018 shows that, in several countries/economies, the gender gap in reading performance narrowed over time. It shrank significantly in 36 of the 62 countries and economies that participated in both the 2009 and 2018 PISA assessments (Table II.7.1). In 17 of those countries/economies, the narrowing of the gender gap in reading performance was due to an improvement in the performance of boys. In five of those countries/economies, namely Estonia, Ireland, Macao (China), Peru and Singapore, boys and girls in 2018 scored higher in reading than their counterparts did in 2009, even as the gender gap between them shrank during the period.
However, in 11 countries, namely Bulgaria, Hungary, Indonesia, Italy, Japan, Kazakhstan, Latvia, Mexico, New Zealand, the Slovak Republic and Switzerland, the narrowing of the gender gap in reading performance was due not to an improvement in boys’ performance but to a decline in girls’ performance. On average across OECD countries, the gender gap in reading performance narrowed by ten score points between 2009 and 2018, but this can be attributed to a decline in the average performance of girls while boys’ performance was unchanged on average.1
In 43 out of 64 countries and economies, the gender gap in mathematics performance in favour of boys did not change significantly between 2009 and 2018. In Colombia, Denmark, Israel, Macao (China) and Qatar, this gender gap shrank due to improvements in girls’ performance in mathematics. However, in Canada, Finland, Greece, Iceland, Luxembourg, the Netherlands, Switzerland and the United States, the narrowing of the gender gap in mathematics performance was due to a significant decline in boys’ performance in mathematics (see Figure II.7.20, available on line, and Table II.B1.7.34). Over the same period, the gender gap in science narrowed by 2 score points, on average across OECD countries (Table II.B1.7.41); but this is because boys’ performance in science declined more (by 10 score points) than girls’ performance did (by 8 score points) between 2009 and 2018.
copy the linklink copied!Variation in performance amongst boys and girls
The average performance of boys and girls masks wide variations amongst students of the same gender, as there is no such thing as a “typical” girl or a “typical” boy. Some students may score far below, or far above, the average performance of their peers of the same gender. For instance, using data from several large-scale international surveys, including previous cycles of PISA (from 2000 to 2012), (Baye and Monseur, 2016[5]) show that gender differences vary largely by students’ proficiency level, and that the gender differences at the extreme ends of the performance distribution are often more substantial than gender differences at the mean.
This variability in boys’ and girls’ performance was also observed in PISA 2018. In almost all PISA-participating countries and economies, the variation in performance in reading, mathematics and science (see Tables II.B1.7.1, II.B1.7.3 and II.B1.7.5) was larger amongst boys than amongst girls.
A larger standard deviation and lower mean reading performance amongst boys strongly implies that more boys than girls would be expected to score towards the bottom of the performance scale. This can be seen in the left panel of Figure II.7.5, which plots the distribution of boys’ and girls’ reading scores in OECD countries. Boys are over-represented amongst students who scored below 450 points, while the opposite is observed amongst students who scored higher.
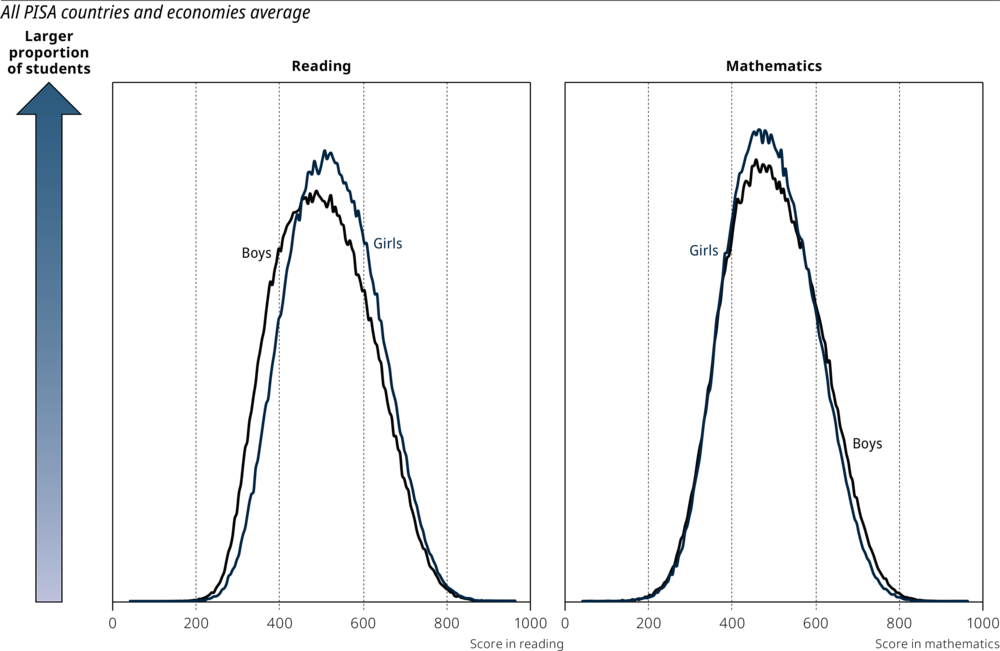
Note: This figure is a histogram of performance using an interval size of five score points.
Source: OECD, PISA 2018 Database.
At the country/economy level, a larger variation in scores implies that the difference between the highest- and lowest-performing boys was often larger than that amongst the highest- and lowest-performing girls. On average across OECD countries, the 10% lowest-performing girls scored 42 points higher than the 10% lowest-performing boys, while the 10% highest-performing girls scored “only” 18 points higher than the 10% highest-performing boys (Figure II.7.4). In 11 PISA-participating countries and economies, namely B-S-J-Z (China), Chile, Colombia, Costa Rica, Japan, Korea, Mexico, Panama, Peru, Chinese Taipei and the United States, there was no difference between boys and girls at the top of the distribution of reading performance. But in all countries/economies, the first decile of the performance distribution amongst boys was significantly lower than that amongst girls. In Finland, Israel, Jordan, Malta, Norway, Qatar, Saudi Arabia and the United Arab Emirates, the 10% lowest-performing boys scored at least 60 points lower than the 10% lowest-performing girls.
Given these results, the reading performance amongst the weakest boys, also observed in previous PISA assessments (Baye and Monseur, 2016[5]), should be a matter of considerable concern in several countries. On average across OECD countries, 28% of boys and “only” 18% of girls did not reach Level 2 proficiency in reading, which is considered to be a “minimum” proficiency level; see Chapter 2 in this volume; and for more details, see PISA 2018 Results [Volume I], What Students Know and Can Do (OECD, 2019[4]). In 26 PISA-participating countries and economies, more than one in two boys did not reach Level 2 proficiency in reading (Table II.B1.7.12). Only in B-S-J-Z (China), Canada, Estonia, Finland, Hong Kong (China), Ireland, Korea, Macao (China), Poland and Singapore did more than four in five boys attain Level 2 proficiency in reading. By contrast, in 36 countries and economies, more than four in five girls attained at least this level of proficiency in reading.
While boys were over-represented at the bottom of the performance distribution, girls were over-represented at the top. In 45 of 77 participating countries/economies with available data, significantly more girls than boys attained the highest levels of performance (Level 5 or 6) (Table II.B1.7.12). The largest gender gap amongst top performers was observed in Finland, where almost 20% of girls, but only 9% of boys attained proficiency Level 5 or 6 in reading. The shares of these students were much larger than those observed in most other countries and economies, though. On average across OECD countries, only 7% of boys and 10% of girls were top performers in reading.
The picture was more complex in mathematics and science performance. Boys were generally over-represented at both the bottom and the top of the performance distributions in these two subjects. For example, in many countries girls’ scores at the first decile of the distribution of mathematics performance were higher than boys’ scores, meaning that the lowest-performing girls scored above the lowest-performing boys in their countries (Table II.B1.7.3). In 16 countries and economies, more boys than girls did not attain Level 2 proficiency in mathematics (Table II.B1.7.17); in only 8 countries/economies was the opposite observed.
However, the largest differences were observed at the top of the distribution of mathematics performance, meaning that amongst the highest performers of both genders, boys usually outperformed girls. This is illustrated in the right panel of Figure II.7.4, which shows the distribution of mathematics performance, amongst boys and girls, in all countries. Boys were slightly over-represented both amongst those who scored below 350 points and those who scored above 620 points. On average across OECD countries, almost 24% of both boys and girls did not attain Level 2 proficiency in mathematics; but 12.3% of boys and 9.5% of girls attained the highest levels of mathematics performance (Level 5 or 6), while 7.3% of boys and 6.2% of girls were top performers in science. But some education systems showed little or no gender gaps at the highest levels of performance. In 35 countries and economies, including those where the average score in mathematics performance was amongst the highest of all PISA-participating countries and economies, including Hong Kong (China), Korea and Chinese Taipei, gender gaps at the top of the distribution of mathematics performance were not significant (see Table II.B1.7.17).
copy the linklink copied!The gender gap and socio-economic status
Scientific research that aims to describe and account for disparities in the magnitude of the gender gap across countries and over time generally highlights the role of socialisation. Parents and teachers may interact differently with boys and girls, which can lead to disparities in learning outcomes (Rodríguez-Planas and Nollenberger, 2018[6]; Nollenberger, Rodríguez-Planas and Sevilla, 2016[7]). For instance, teachers may hold certain beliefs about boys’ and girls’ interests and abilities that may affect their evaluations of student performance, which, in turn, may reinforce, or reduce, gender disparities in achievement (Hadjar et al., 2014[3]). These beliefs may also vary from country to country, depending on the prevailing social norms and economic conditions in a given period. One long-term analysis involving a large number of countries suggests that greater participation in the labour force amongst women is associated with higher performance in education amongst girls (van Hek, Kraaykamp and Wolbers, 2016[8]). In economies where women’s participation in the labour market is low, the returns to education are expected to be lower for girls than boys, and this may partly explain why parents invest less time, money and effort in educating their daughters.
But large disparities in the magnitude of the gender gap may also be observed between different social groups within the same country, notably related to socio-economic status. Socio-economic status is often reflected in the resources, both social and economic, that parents can provide for the cognitive development of their children. The PISA index of economic, social and cultural status appears to be strongly correlated with education outcomes (see Chapters 2 through 6 in this volume). However, recent studies suggest that boys and girls may be affected differently by the quantity and quality of the resources provided by both families and schools (Autor et al., 2016[9]). Some recent research suggests that boys born to disadvantaged families have lower achievement scores and are less likely to complete high school than girls from similar backgrounds (Autor et al., 2019[10]; Brenøe and Lundberg, 2018[11]).
Describing the inter-relationship amongst gender, socio-economic status and performance, including differences within and between groups, may help identify key population groups and the points at which interventions should be targeted to address inequalities in education outcomes. This section examines how the association between students’ socio-economic status and their performance varies between boys and girls.
While the gender gap in reading performance is large and significant, in all countries and economies it was much smaller than the differences in performance related to socio-economic status. On average across OECD countries, advantaged students (those in the top quarter of the PISA index of economic, social and cultural status in their country/economy) scored 88 points higher, on average, than disadvantaged students (those in the bottom quarter of the index in their country/economy; see Chapter 2). By comparison, the gender gap in reading performance amounted to “only” 30 score points.2 In all countries and economies, performance in PISA appeared more strongly associated with socio-economic status than with gender.
When comparing the reading performance of boys and girls by socio-economic group, in all PISA-participating countries and economies, socio-economically advantaged boys outperformed disadvantaged girls in reading (see Figure II.7.6). But in all countries, advantaged girls significantly outperformed advantaged boys in reading, while disadvantaged girls significantly outperformed disadvantaged boys. The only exception is Peru, where advantaged boys and girls performed at a similar level, on average.
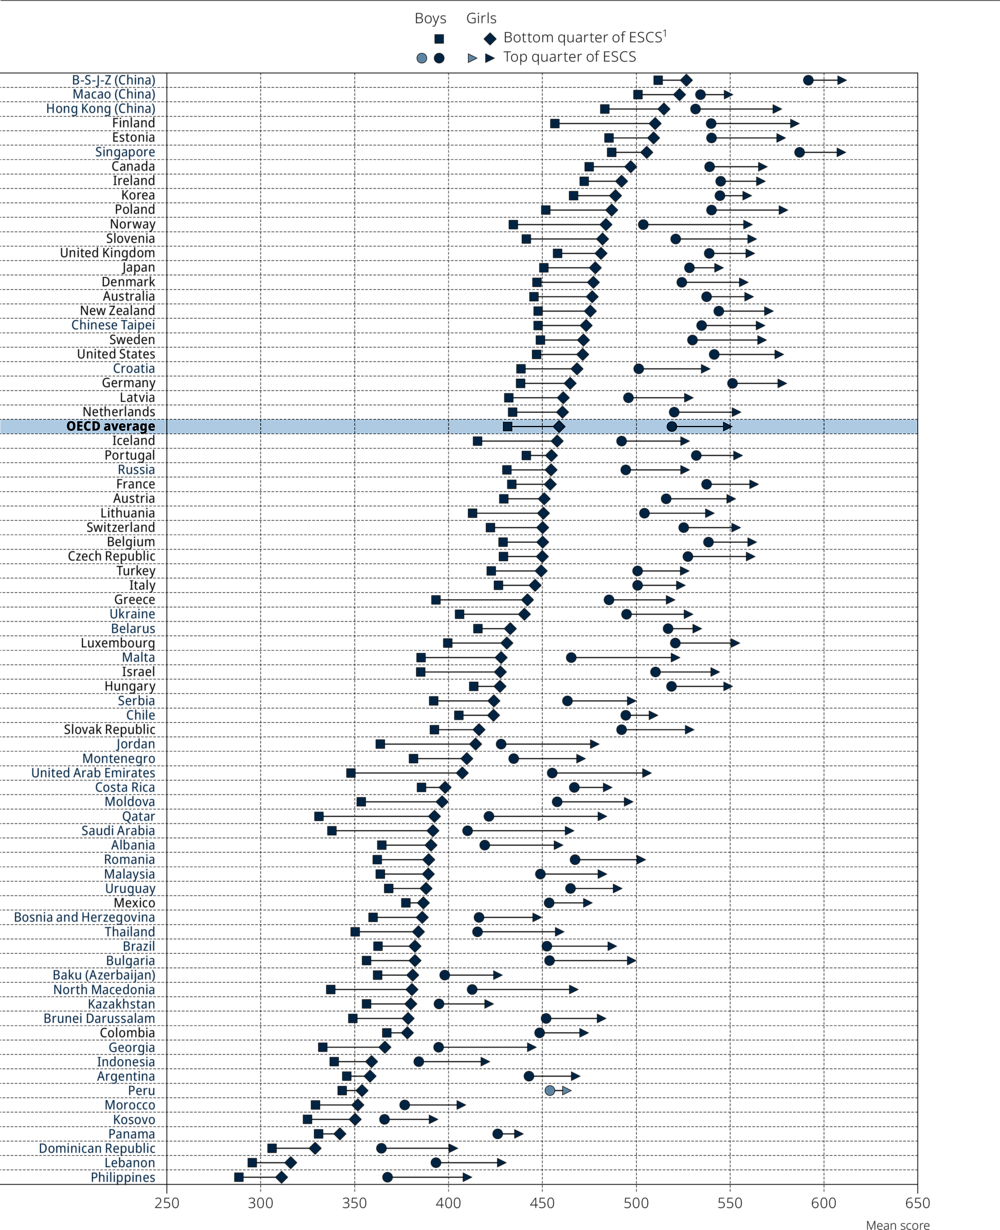
1. ESCS refers to the PISA index of economic, social and cultural status.
Note: All differences between girls and boys in the bottom quarters of socio-economic status are statistically significant. And statistically significant differences in the top quarter are marked in a darker tone (see Annex A3).
Countries and economies are ranked in descending order of the mean score of girls in the bottom quarter of socio-economic status.
Source: OECD, PISA 2018 Database, Table II.B1.7.43.
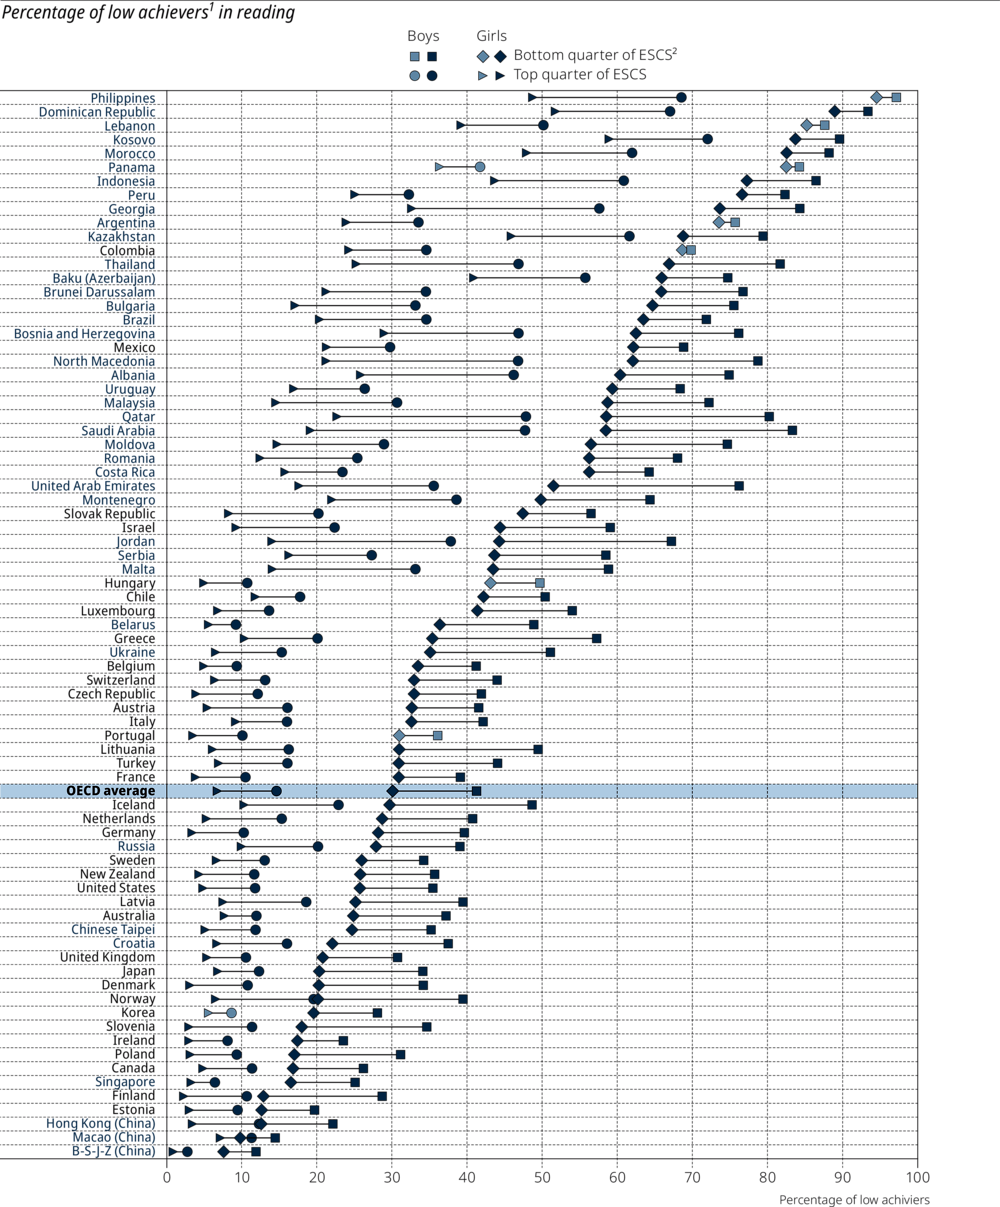
1. Low achievers are students who performed below Level 2.
2. ESCS refers to the PISA index of economic, social and cultural status.
Note: Statistically significant differences between girls and boys in the top and/or bottom quarters of socio-economic status are marked in a darker tone (see Annex A3).
Countries and economies are ranked in descending order of the percentage of girls in the bottom quarter of socio-economic status who are low performers.
Source: OECD, PISA 2018 Database, Table II.B1.7.46.

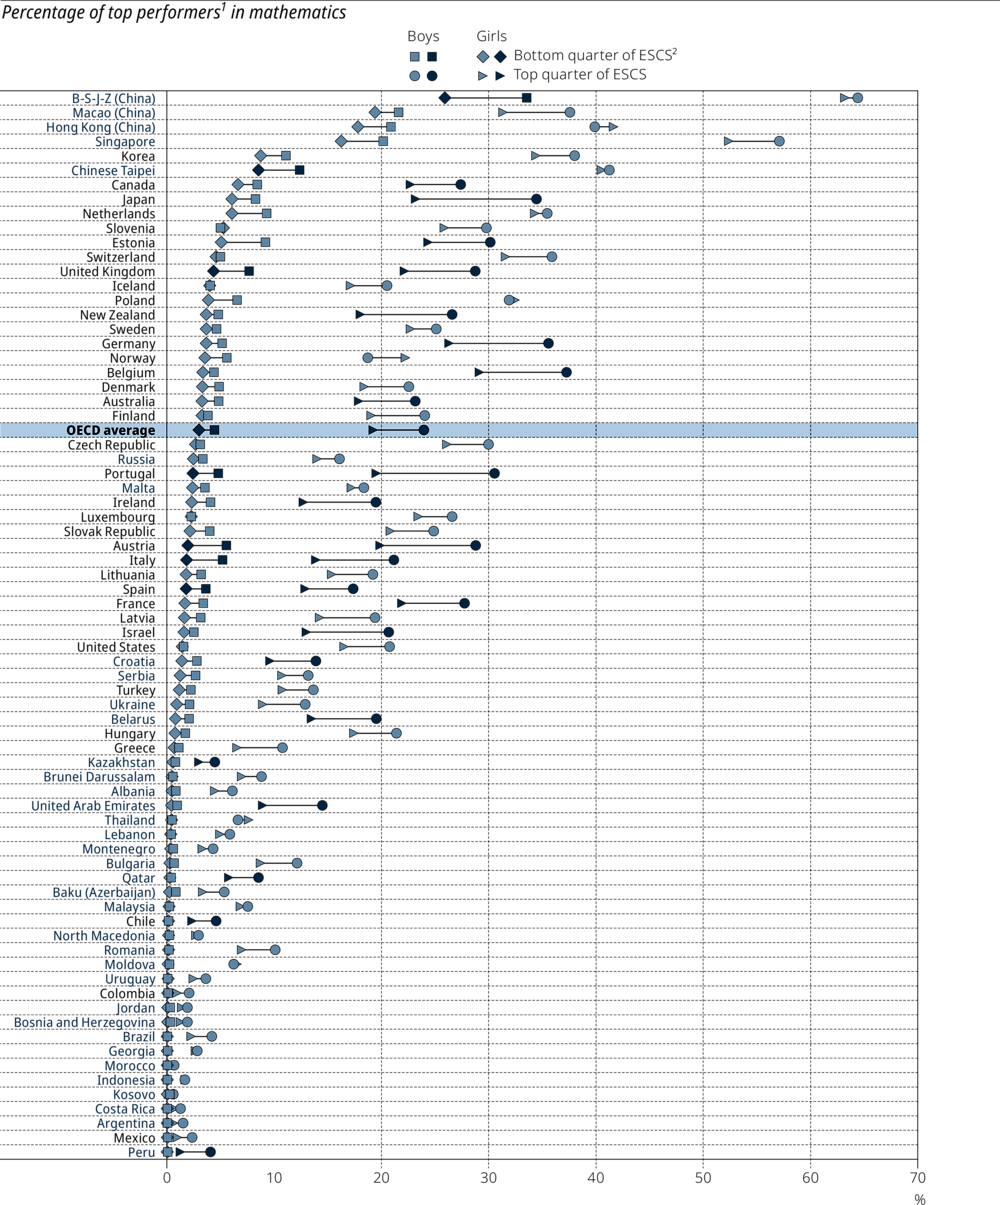
1. Top performers are students who performed at or above Level 5.
2. ESCS refers to the PISA index of economic, social and cultural status.
Note: Statistically significant differences between girls and boys in the top and/or bottom quarters of socio-economic status are marked in a darker tone (see Annex A3).
Countries and economies are ranked in descending order of the percentage of boys in the top quarter of socio-economic status who are top performers.
Source: OECD, PISA 2018 Database, Table II.B1.7.46.
1. Top performers are students who performed at or above Level 5.
2. ESCS refers to the PISA index of economic, social and cultural status.
Note: Statistically significant differences between girls and boys in the top and/or bottom quarters of socio-economic status are marked in a darker tone (see Annex A3).
Countries and economies are ranked in descending order of the percentage of girls in the bottom quarter of socio-economic status who are top performers.
Source: OECD, PISA 2018 Database, Table II.B1.7.47.
The underperformance of disadvantaged boys is confirmed when looking at the level of proficiency attained by boys and girls. Only in five countries/economies – B-S-J-Z (China), Estonia, Hong Kong (China), Ireland and Macao (China) – did more than one in four disadvantaged boys attain Level 2 in reading. In 19 countries and economies, more than three in four disadvantaged boys scored below Level 2 in reading (Figure II.7.10). In 40 countries and economies, more than 50% of disadvantaged boys were low performers, while in 48 countries/economies, less than 50% of disadvantaged girls scored below Level 2 in reading. Socio-economic status appears to be a much more reliable predictor of low performance in reading than gender.
At the other end of the performance distribution, advantaged girls often outnumbered advantaged boys amongst top performers. On average across OECD countries, 20.2% of advantaged girls and 14.6% of advantaged boys attained Level 5 or 6 in reading, and this difference was significant in 32 countries and economies (Figure II.7.8). By contrast, in most countries and economies, the shares of top performers amongst disadvantaged girls and boys were similar – and small. On average across OECD countries, only 3.6% of disadvantaged girls and 2.3% of disadvantaged boys attained proficiency Level 5 or 6 in reading.
In mathematics and science, the gender gap in performance between boys and girls of similar socio-economic status was not significant; but the gap related to socio-economic status was large in all PISA-participating countries and economies (see Figures II.7.5 and II.7.6, available on line). In most countries, the proportions of disadvantaged girls and boys who were top performers in mathematics were not significantly different (Figure II.7.9). Only in 22 countries and economies was the gender gap significant amongst advantaged students who were top performers in mathematics. On average across OECD countries, only 4.4% of disadvantaged boys and 3% of disadvantaged girls were top performers in mathematics, while 23.9% of advantaged boys and 19.2% of advantaged girls attained proficiency Level 5 or 6 in mathematics.
References
[10] Autor, D. et al. (2019), “Family Disadvantage and the Gender Gap in Behavioral and Educational Outcomes”, American Economic Journal: Applied Economics, Vol. 11/3, pp. 338-381, https://doi.org/10.1257/app.20170571.
[9] Autor, D. et al. (2016), “School Quality and the Gender Gap in Educational Achievement”, American Economic Review, Vol. 106/5, pp. 289-295, https://doi.org/10.1257/aer.p20161074.
[5] Baye, A. and C. Monseur (2016), “Gender differences in variability and extreme scores in an international context”, Large-scale Assessments in Education, Vol. 4/1, https://doi.org/10.1186/s40536-015-0015-x.
[11] Brenøe, A. and S. Lundberg (2018), “Gender gaps in the effects of childhood family environment: Do they persist into adulthood?”, European Economic Review, Vol. 109, pp. 42-62, https://doi.org/10.1016/j.euroecorev.2017.04.004.
[3] Hadjar, A. et al. (2014), “Gender and educational achievement”, Educational Research, Vol. 56/2, pp. 117-125, https://doi.org/10.1080/00131881.2014.898908.
[7] Nollenberger, N., N. Rodríguez-Planas and A. Sevilla (2016), The math gender gap: The role of culture, American Economic Association, https://doi.org/10.1257/aer.p20161121.
[4] OECD (2019), PISA 2018 Results (Volume I): What Students Know and Can Do, PISA, OECD Publishing, Paris, https://dx.doi.org/10.1787/5f07c754-en.
[1] OECD (2016), PISA 2015 Results (Volume II): Policies and Practices for Successful Schools, PISA, OECD Publishing, Paris, https://dx.doi.org/10.1787/9789264267510-en.
[2] OECD (2015), The ABC of Gender Equality in Education: Aptitude, Behaviour, Confidence, PISA, OECD Publishing, Paris, https://dx.doi.org/10.1787/9789264229945-en.
[6] Rodríguez-Planas, N. and N. Nollenberger (2018), “Let the girls learn! It is not only about math … it’s about gender social norms”, Economics of Education Review, Vol. 62, pp. 230-253, https://doi.org/10.1016/j.econedurev.2017.11.006.
[8] van Hek, M., G. Kraaykamp and M. Wolbers (2016), “Comparing the gender gap in educational attainment: the impact of emancipatory contexts in 33 cohorts across 33 countries”, Educational Research and Evaluation, Vol. 22/5-6, pp. 260-282, https://doi.org/10.1080/13803611.2016.1256222.
Notes
← 1. The PISA 2018 framework, while similar to the 2009 assessment framework, also differs from its predecessor. The 2009 assessment was conducted on paper while the 2018 assessment was conducted (by default) on computer, allowing for the use of adaptive testing (whereby the test form that a student saw depended on his or her answers to earlier questions), which improved the precision of measurement at both ends of the performance distribution. In addition, the 2018 assessment emphasised multiple-source texts to a greater extent than in previous cycles. For details, see Chapter 1 of PISA 2018 Results (Volume I): What Students Know and Can Do (OECD, 2019[4]).
← 2. These estimates are computed on different populations, as the gender gap is computed on the entire sample while the socio-economic gap is computed only on the subsamples composed of the most and least socio-economically advantaged students. Effect sizes, which are scale-free and not sensitive to the relative sample size in these subsamples, confirmed that socio-economic gaps are more strongly related to academic performance than gender is. On average across OECD countries, the standardised difference in performance between boys and girls was 0.29 (= 30/99 the ratio of the gender gap and the standard deviation in the population) while the standardised difference between the most and least advantaged students was 0.86 (=89/103 the ratio of the socio-economic gap and the subpopulation of disadvantaged and advantaged students).
Metadata, Legal and Rights
https://doi.org/10.1787/b5fd1b8f-en
© OECD 2019
The use of this work, whether digital or print, is governed by the Terms and Conditions to be found at http://www.oecd.org/termsandconditions.
