Chapter 1. Sovereign borrowing outlook for OECD countries
Between 2007 and 2018, the borrowing needs of OECD governments surged drastically and outstanding central government marketable debt for the OECD area as a whole doubled in nominal terms. At the same time, favourable funding conditions eased debt sustainability concerns and enabled public debt managers to enhance the resilience of public finances to shocks. Looking forward, while OECD sovereigns as a whole need to sell more than USD 11 trillion to the markets this year, the central government marketable debt-to-GDP ratio is projected to remain constant in 2019. Against this background, this chapter provides an overview of borrowing, deficits, redemptions and debt developments in the OECD area over 2007-2019.
Public debt management is part of the overall macroeconomic policy framework which encompasses monetary, fiscal and macro-prudential policies. With that in mind, this chapter discusses the implications of fiscal policy and monetary policy developments for public debt dynamics as well as government debt securities markets. The analysis includes strategic considerations on interest rate and investor base developments, and secondary market liquidity conditions from a public debt management perspective. This chapter also includes a box on security lending practices of sovereign debt management offices.1*
1.1. Introduction
During the past decade, sovereign debt structure in the OECD area has been significantly affected by the fiscal and monetary policy responses to the financial crisis. Between 2007 and 2018, the borrowing needs of OECD governments surged drastically and outstanding central government debt for the OECD area as a whole doubled in nominal terms. At the same time, favourable funding conditions eased the debt sustainability concerns and enabled public debt managers to enhance resilience of public finance to shocks. Public debt managers have also adapted their practices to respond to evolving market structures mainly driven by the post-crisis regulatory reforms, unconventional monetary policies and advances in financial technology. While the legacy of the financial crisis continues to cast a long shadow over public finances in the form of heavy debt repayments and monetary policy conditions have changed, public debt managers are now facing a new set of issues. Against this background, this chapter provides an overview of sovereign debt developments in the OECD area and discusses policy challenges and medium-term considerations for sovereign debt management policy.
Key findings
-
Gross borrowings of OECD governments from the markets, which peaked at USD 10.9 trillion in 2010 in the wake of the financial crisis, are set to reach a new record level in 2019 by exceeding USD 11 trillion. While government funding needs in the wake of the financial crisis increased in most OECD countries, the recent further increase is confined to a few countries, particularly the United States.
-
In 2017, the new debt issuance of OECD governments to the markets registered the lowest level since 2008, but increased by USD 600 billion to USD 1.9 trillion in 2018 and is projected to exceed USD 2 trillion in 2019.
-
Between 2007 and 2018, outstanding central government debt for the OECD area as a whole doubled and the debt-to-GDP ratio rose from 49.5% to 72.6%. While the new debt issuance is set to increase the nominal level of outstanding central government debt further, debt-to-GDP ratio is projected to remain at 72.6% in 2019, mainly owing to continued economic growth in the OECD area.
-
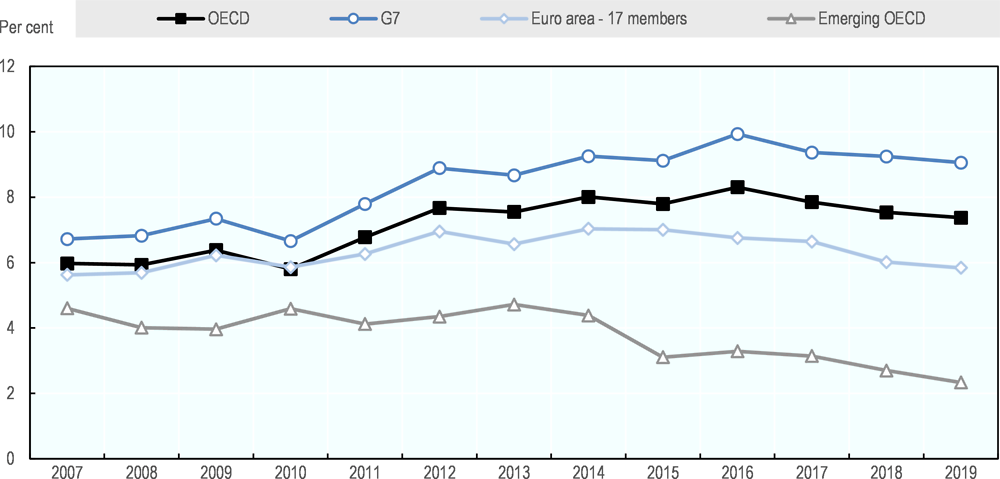
Compared with the pre-crisis levels, the interest rate-growth differentials – an important indicator to explain debt-to-GDP developments – in the G7 countries have improved significantly and slowed growth in debt-to-GDP ratios in recent years. Nevertheless, central government marketable debt-to-GDP ratio for the G7 countries is expected to increase and reach its highest level in 2019. Among the G7 countries, the differential is still positive only in Italy, albeit a relative improvement compared to 2007.
-
The gradual exit from unconventional monetary policy has important implications for sovereign funding conditions, mainly through changes in borrowing interest rates and the investor base. The impact of higher interest rates on the cost of debt will initially be relatively low in countries where new borrowing needs are limited and the share of fixed-rate debt with long maturity is high. In terms of the investor base, a lower level of involvement of central banks as large buyers should lead to increased funding needs from other investors.
-
Over the past decade, the composition of government financing in the OECD area has tilted towards long-term fixed rate financing instruments, which has resulted in more resilient debt portfolios. Correspondingly, average-term-to-maturity of outstanding marketable debt has increased considerably in recent years, and reached almost 8 years in 2018, which implies a slower pass-through of changes in market interest rates to government interest costs.
-
Against the backdrop of less favourable funding conditions, sovereign debt management offices should maintain a close communication with investors and other policy making authorities, in particular by re-engaging with their traditional investor base, such as pension funds and insurance companies, and putting more emphasis on diversification of the investor base. Benefits can also be obtained from retaining flexibility in their funding programme with contingency funding tools such as liquidity buffers and Treasury Bills.
1.2. An upward movement in nominal government borrowing needs
After remaining steady in recent years, the gross and net borrowing requirements of OECD governments increased significantly in 2018, reflecting increasing budget deficits in some countries. The 2018 OECD Survey on Central Government Marketable Debt and Borrowing estimates a continuation of this upward movement in 2019, albeit at a slower pace. Specifically, the combined gross borrowings of OECD governments from the markets, which rose from USD 10.1 trillion in 2017 to USD 10.7 trillion in 2018, are projected to reach a record level of USD 11.3 trillion in 2019 (Figure 1.1).2
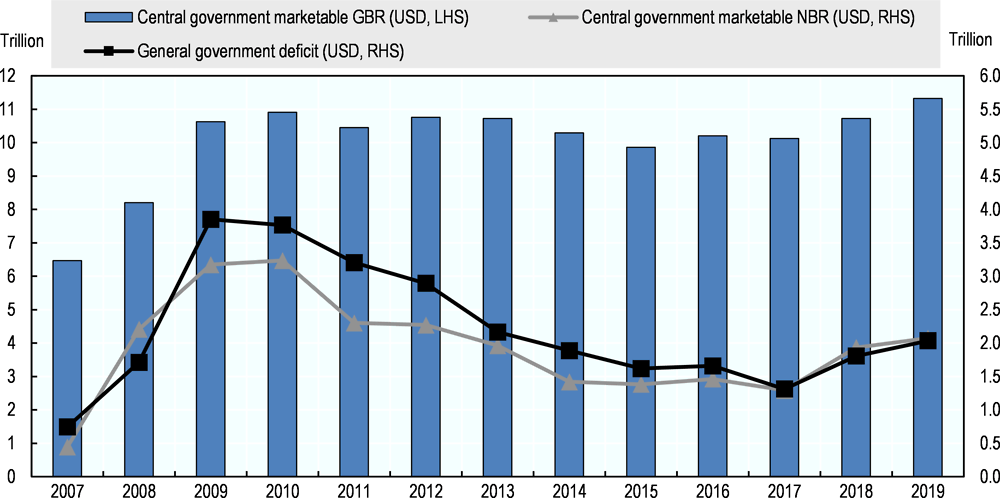
Notes: GBR = standardised gross borrowing requirement, NBR = net borrowing requirement. General government deficit is derived from general government net lending as published in the OECD Economic Outlook No. 104 for all OECD countries, except for Chile, Mexico and Turkey for which the source is the IMF World Economic Outlook (October 2018).
Source: 2018 Survey on Central Government Marketable Debt and Borrowing; OECD Economic Outlook No. 104; IMF World Economic Outlook (October 2018); Refinitiv, national authorities’ websites and OECD calculations.
Gross borrowing figures reflect the total amount required to finance budget deficits and debt redemptions, while net borrowing accounts for additional exposures in the market. That said, positive net borrowing requirements reflect the continued growth of central government marketable debt. Net borrowing requirements for the OECD area as a whole reached a peak point in 2010, reflecting fiscal stimulus and recession in the wake of the financial crisis and declined until 2017. However, they are estimated to rise from USD 1.3 trillion in 2017 to USD 1.9 trillion in 2018, and projected to slightly increase further to over USD 2 trillion in 2019.
Figure 1.2 illustrates the outstanding central government marketable debt and cumulative net borrowing requirements from 2007 to 2019. The sustained borrowing needs of OECD governments over the past decade doubled the outstanding government marketable debt in nominal terms. While cumulative net borrowing requirements reached USD 23 trillion between 2007 and 2018, the outstanding central government marketable debt increased from USD 22.5 trillion in 2007 to USD 45.2 trillion in 2018. Against the backdrop of expansionary fiscal policies underway in a few OECD countries, outstanding central government marketable debt for the OECD area as a whole is projected to rise further to USD 47.3 trillion in 2019 (Figure 1.2).
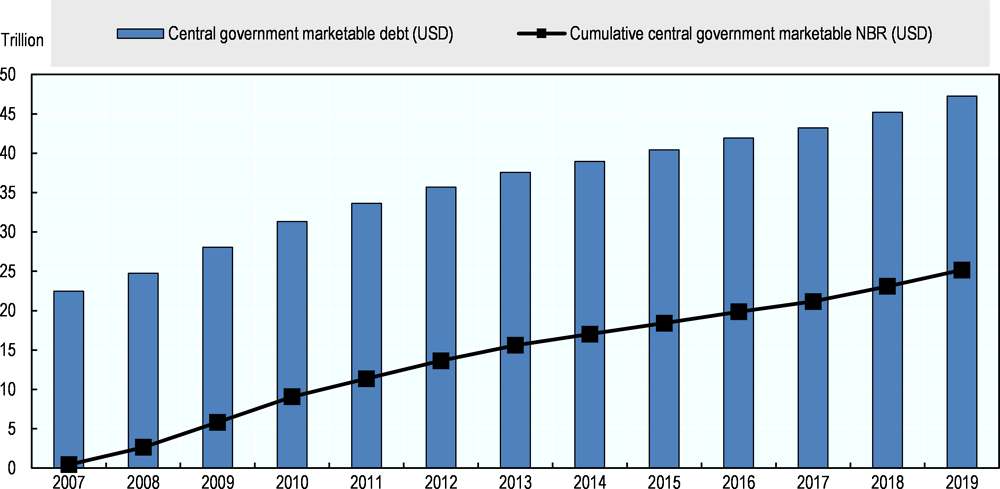
Notes: Using 2007 as base year for cumulative net borrowing requirement (NBR) calculations.
Source: 2018 Survey on Central Government Marketable Debt and Borrowing; OECD Economic Outlook No. 104; Refinitiv, national authorities’ websites and OECD calculations.
Figures 1.3 and 1.4 illustrate central government gross borrowing requirements and outstanding debt as a percentage of GDP – rather than in nominal amounts – for the OECD area as a whole and for selected OECD groupings respectively. Both of the indicators, growing in nominal terms, declined or stabilised in relation to GDP. The OECD estimates that the economic growth in the OECD area is set to ease gradually from around 2.5% in 2017-18 to 2.1% in 2019 amidst less accommodative macroeconomic policies, headwinds from trade tensions, tighter financial conditions (OECD, 2018b). In 2019, the gross borrowing is expected to be 17.4% of GDP and gross debt is to be 72.6% of GDP similar to previous two years. Nevertheless, trends in these indicators diverge across selected OECD groupings. Specifically, both ratios are expected to deteriorate further for the G7 countries where ratios are already relatively high, while they continue to improve for the other country groupings. Specifically, central government marketable debt-to-GDP ratio for the G7 countries is expected to increase from 86.1% in 2017 to 86.8% in 2018, and projected to reach its highest level of 87.6% in 2019.
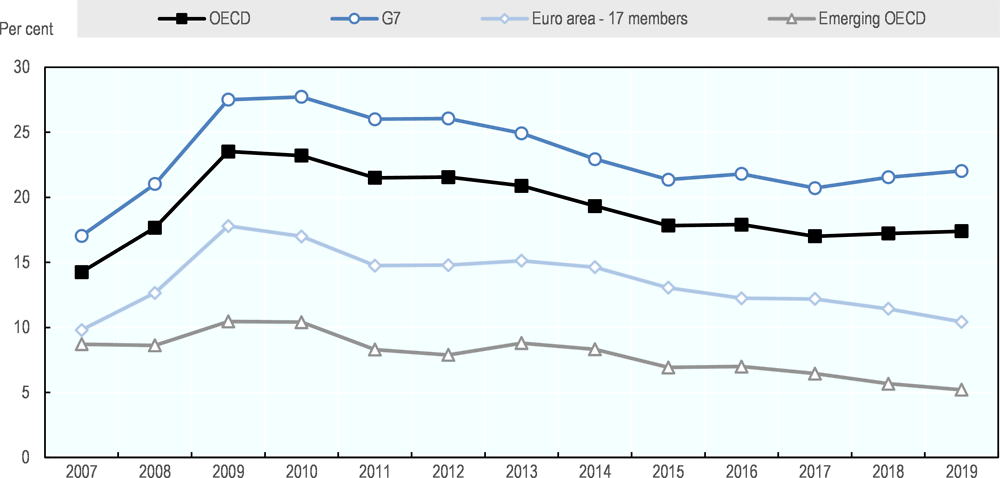
Notes: Standardised gross borrowing requirement. See Annex 1.A1 for a list of countries in each group.
Source: 2018 Survey on Central Government Marketable Debt and Borrowing; OECD Economic Outlook No. 104; Refinitiv, national authorities’ websites and OECD calculations.
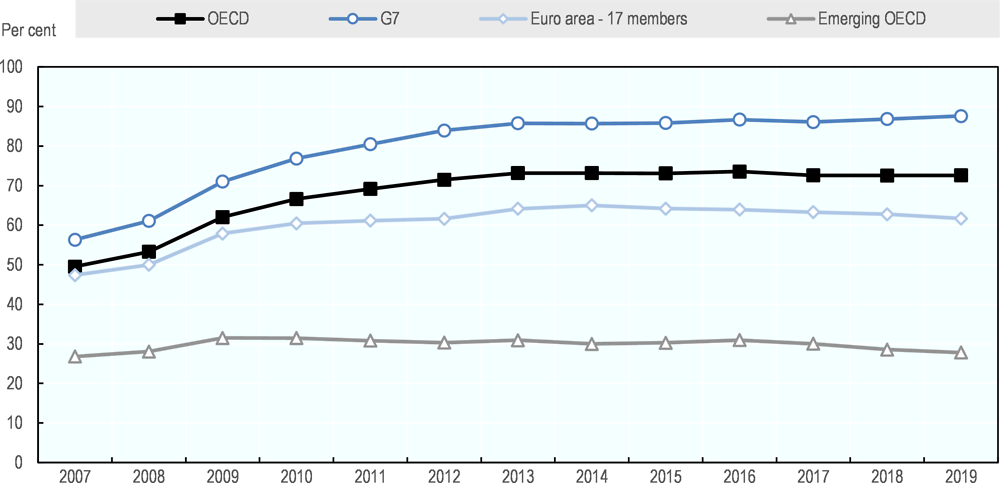
Notes: Debt stock without cash. See Annex 1.A1 for a list of countries in each group.
Source: 2018 Survey on Central Government Marketable Debt and Borrowing; OECD Economic Outlook No. 104; Refinitiv, national authorities’ websites and OECD calculations.
1.3. Sovereign debt accumulation varied widely across countries in the OECD area
Government funding needs, which are expected to reach USD 10.7 trillion in the OECD in 2018, varied widely across countries. While fiscal expansion in the wake of financial crisis was synchronised to a large extent across the OECD area, the recent rise in gross borrowing-to-GDP ratios has been confined to a few countries, particularly the United States.3 Government funding needs for the euro area and Emerging OECD countries have even improved in recent years (Figure 1.3), and the funding needs of some sovereigns (e.g. Denmark, Iceland, New Zealand and Sweden) have declined to very low levels.
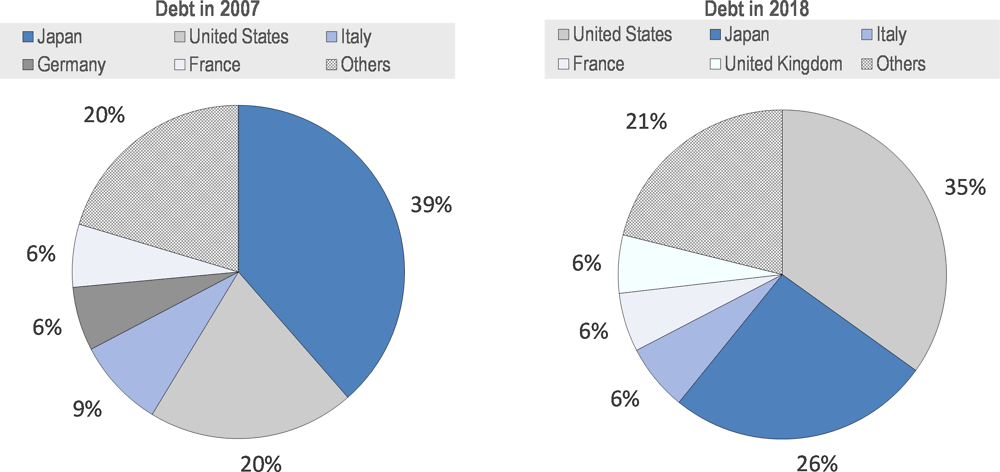
Divergence in gross borrowing requirements amongst OECD countries manifests itself in the countries’ percentage shares of total outstanding debt. Figure 1.5 compares the share of the top five countries in terms of their share in total outstanding government marketable debt for the OECD area in 2007 and in 2018. This comparison indicates that the United States now has the greatest share, surpassing Japan. Another interesting result of this comparison is that Germany has dropped out of the top five and Italy’s share has moderated, while the United Kingdom has moved up to fifth place.
Source: 2018 Survey on Central Government Marketable Debt and Borrowing; OECD Economic Outlook No. 104; Refinitiv, national authorities’ websites and OECD calculations.
1.4. The favourable interest-growth differential
Economic growth, government primary budget balance and interest rates on government debt are the key determinants of public gross debt trajectories. In the OECD area over the past decade, sovereign bond yields have been exceptionally low, even reaching negative levels, irrespective of the relative tightening of financial conditions over the past year (Figure 1.6). Some sovereigns including France, Germany and Japan, have issued negative-yielding debt and received premiums from these issues in recent years.4 These favourable funding conditions have had important implications for debt dynamics:
-
The majority of OECD governments have reduced their debt servicing costs in recent years, despite in many cases rising sovereign debt.
-
The composition of government financing has tilted towards long-term fixed rate financing instruments as a trade-off between expected costs and risks of short and long-term borrowing choices diminish. This has resulted in more resilient debt portfolios in terms of refinancing risk (see Section 1.5).
-
Interest rate have remained less than nominal GDP growth, which constrained the increase in the debt-to-GDP ratio.
Taken as a whole, it can therefore be concluded that a favourable financing environment over the last decade supported public debt dynamics and limited the debt sustainability concerns.
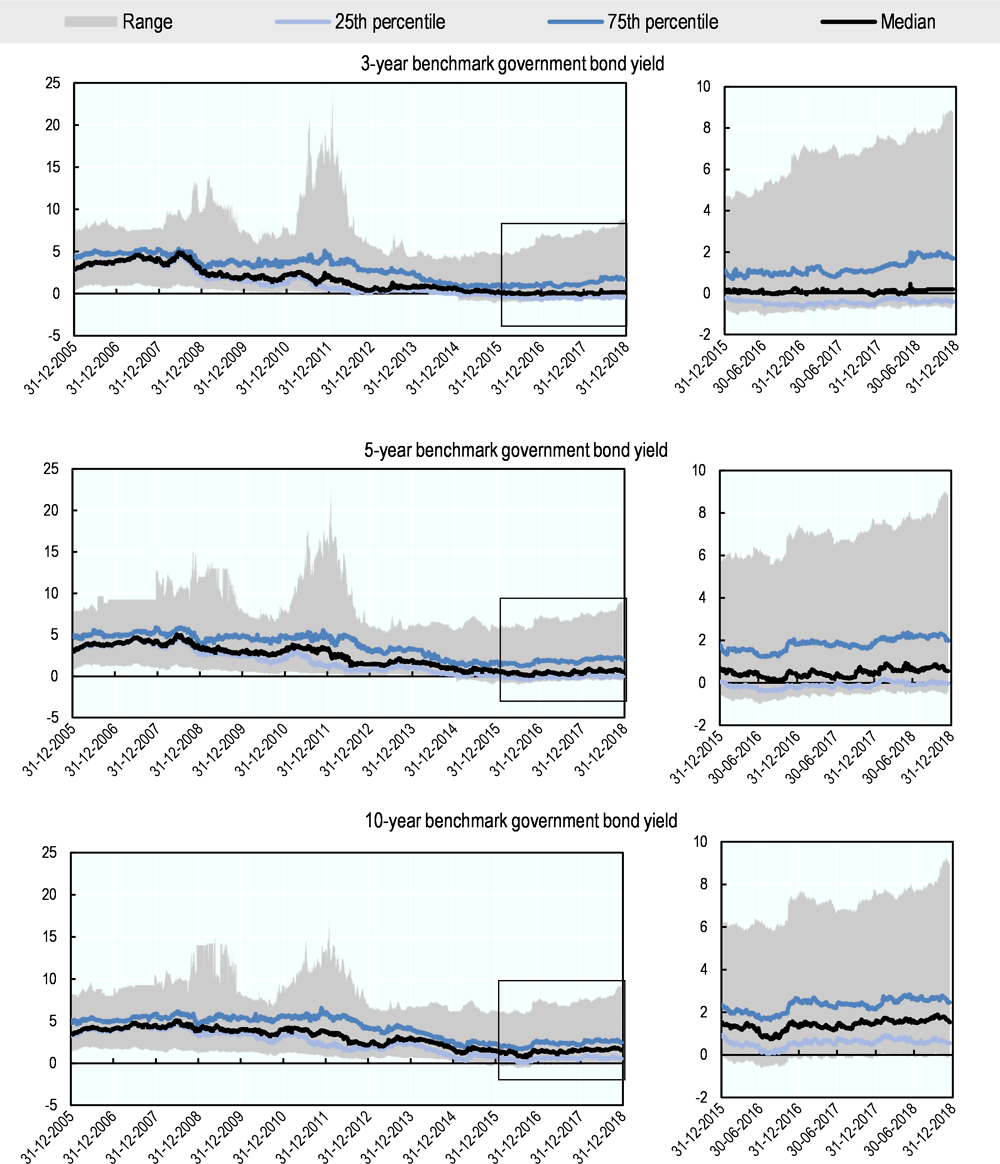
Notes: Interest rates in percentages. Charts show the evolution of several metrics (minimum, maximum, 25th percentile, 75th percentile, median) of 3-year, 5-year and 10-year benchmark government bond yields, calculated for a group of countries. See Annex 1.A1 for a list of countries that were included in these calculations.
Source: Refinitiv
The interest rate-growth differential is essential to assess public debt sustainability: Higher interest rates imply higher interest payments so adversely influencing debt dynamics, whereas higher GDP growth will tend to lower the debt-to-GDP ratio by increasing the denominator. That said, the positive differential increases the debt-to-GDP ratio, other things held constant. For highly indebted countries, a change in the differential of a couple of percentage points, if sustained, could mean the difference between an explosive and a declining path for the debt-to-GDP ratio (Turner et al, 2012).
Figure 1.7 compares the debt-to-GDP ratios along with interest rate-growth differentials in the G7 countries in 2007 and 2018. Results indicate that interest rate-growth differentials have improved in all G7 countries, but to different degrees. The improvement is more evident in Germany, Japan, the United Kingdom and the United States where the differential is in negative territory in 2018. At the same time, the debt burdens have been increasing in all G7 countries, except Germany. In Germany, it has declined gradually on the back of fiscal consolidation and a favourable interest rate-growth differential. Among these countries, the differential is still positive only in Italy. The interest rate paid on 10-year government bonds still exceeds the growth rate (by 0.1 basis points) in 2018, albeit a relative improvement compared to 2007.
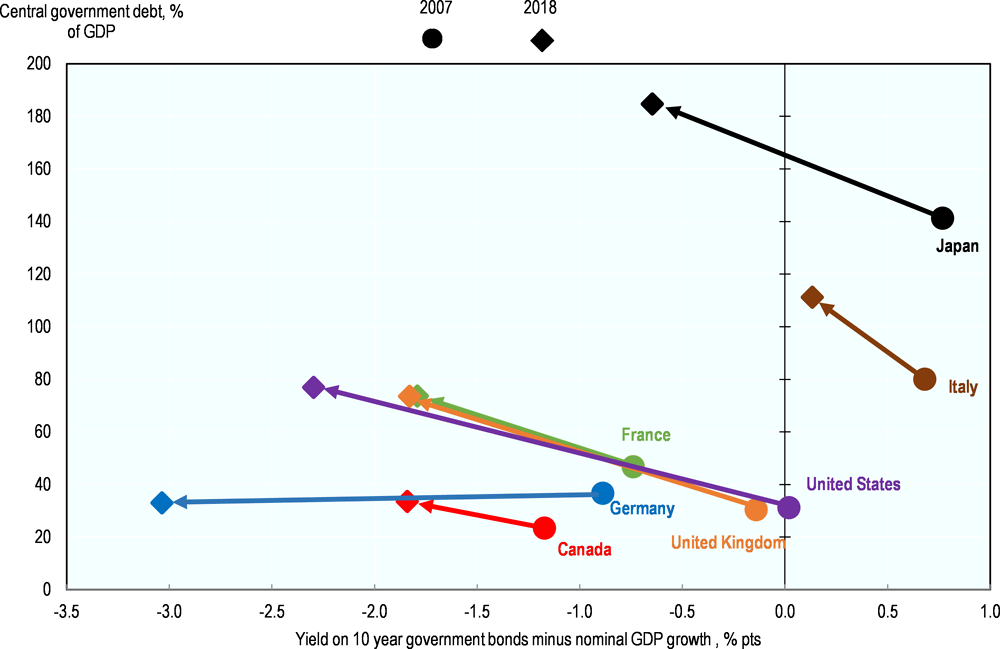
Notes: Debt stock without cash as percentage of GDP, GDP (volume, growth) and average annual yield on 10-year bond.
Source: 2018 Survey on Central Government Marketable Debt and Borrowing; OECD Economic Outlook No. 104; Refinitiv, national authorities’ websites and OECD calculations.
1.5. Composition of financing remains tilted towards long-term fixed-rate securities
A government financing plan is prepared in accordance with projected financing needs, macroeconomic forecasts, the situation in bond markets, and investors’ demand. In this framework, sovereign debt managers consider long-term impacts of potential strategies and a variety of potential risk factors (e.g. forthcoming elections, geo-political events and monetary policy decisions) when drawing up their funding plans. They aim for meeting the principles of openness, transparency and predictability of debt management. To this end, flexibility is often built into these financing plans to adjust to unexpected developments (e.g. a lower or higher financial requirement).
During the height of the financial crisis in 2008, the share of short-term issuance to total gross issuance for the OECD area as whole climbed to over 55%. At the same time, the share of fixed-rate debt declined to below 40% of gross issuance. Since then, the composition of governments’ funding has improved particularly in terms of maturity and interest rate composition (Table 1.1). Specifically, the share of fixed-rate long-term securities in total marketable gross borrowing needs rose by about 10 percentage points from 2007 to 2017, while T-bill issuance has been moderated. The recent survey results indicate a continuation of this trend in 2019, albeit a slight upward deviation in 2018.
It should be noted that the rise in short-term debt from 2017 to 2018 was confined to a few countries, namely Austria, Germany, the Netherlands and the US. Fiscal benefits of adjusting public debt maturity crucially depend on the future evolution of the yield curves and the current maturity structure of debt (Maravalle, A. and L. Rawdanowicz, 2018). Against this backdrop, some sovereigns, with better than average fiscal fundamentals, might benefit from shortening borrowing maturities in order to take advantage of very low short-term rates, without obstructing their refinancing risk exposure. In the US, the Treasury Borrowing Advisory Committee (TBAC) recommended that between one-quarter and one-third of the financing gap should be met with T-bill issuance for 2019 (US Treasury, October 2018). The main rationale behind this recommendation is the potential need to retain flexibility in Treasury’s issuance path to respond to any changes in funding needs and accommodate historically large auction sizes, given the uncertainty inherent in fiscal projections and the timing of the System Open Market Account (SOMA) portfolio normalisation. This strategy is projected to significantly increase T-bill auction sizes. In October 2018, the US Treasury launched inaugural issuance of 2-month T-Bill which settles and matures on Tuesdays.5
The share of index-linked issuance has moderated somewhat
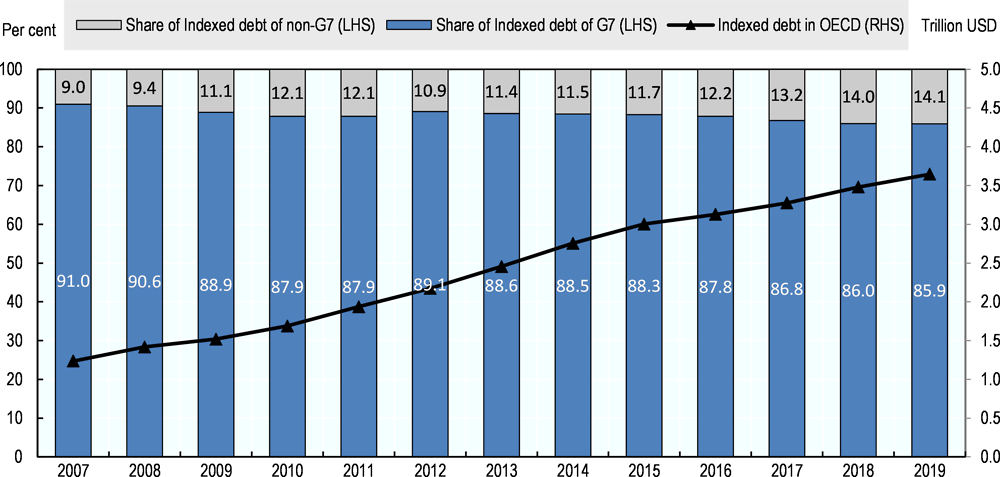
In terms of fixed-rate versus index-linked securities, the relative importance of inflation-linkers as part of a sovereign’s total financing increased from 3.3% in 2007 to 4% in 2014. The strong and sustainable demand from pension funds and insurance companies was the main driver of this development, as it underpinned the cost-effectiveness of issuing index-linked bonds (OECD, 2018a). The survey results indicate that the share of index-linked securities in total government borrowings has lessened since 2015, although a few countries have issued their first inflation-linked bonds in recent years (e.g. Belgium in 2015 and Ireland in 2017). The annual issuance of index-linked securities declined gradually from above USD 400 billion in 2014 to around USD 350 billion in 2018. Relatively low issuance of inflation-linked bonds in the United Kingdom, and the United States accounts for the most part of this drop. Despite the recent slowdown in new issuance, the outstanding amount of indexed-linked debt in the OECD area almost tripled since 2007 in nominal terms, reaching USD 3.5 trillion in 2018. Over the same period, the share of the G7 economies in the OECD area indexed-linked debt declined (Figure 1.8).
Furthermore, the United Kingdom, the second largest sovereign issuer of inflation-linked securities after the United States, is also acting to mitigate the government’s balance sheet exposure to inflation risk6 by moderating the issuance of index-linked gilts in the latest financing remit and reviewing the appropriate balance between index-linked and conventional gilts going forward (HM Treasury, 2018a). In addition, Iceland, a small issuer, launched an inflation swap programme in 2018 in order to alleviate inflation risk exposure of its debt portfolio. Specifically, the programme aims to reduce the share of index-linked debt in total marketable debt from its current level of 31% to 10-20% in the long-run.
Source: 2018 Survey on Central Government Marketable Debt and Borrowing; Refinitiv, national authorities’ websites and author calculations.
Sovereign green bond issuance has been gaining momentum in Europe
The main goal of adding a new instrument to financing securities is to attract a broader and more diversified investor base in line with long-term cost and risk minimisation objectives. Increased investors’ demand for a new instrument encourages potential issuers, especially when budget deficits are substantial. In the case of green bonds, the number of investors, such as large sovereign wealth funds (SWFs) and pension funds that are committed to responsible investment and integration of environmental, social and governance (ESG) factors into their investment strategy has increased quite rapidly in recent years.7 This, in turn, has supported the growth of green bond market in general. It should be noted that, within the ECB Public Sector Purchase Programme (PSPP), the Euro system has also purchased green bonds issued by sovereigns, which in turn, encouraged euro area governments to use this financing instrument.
The 2018 OECD survey on primary markets developments reveals that Belgium, Ireland and Lithuania issued their first green bonds in 2018. Sovereign green bond issuance by OECD governments has exceeded EUR 24 billion since Poland sold the first ever sovereign green bond in December 2016 (Figure 1.9).8 The French green Obligations Assimilables du Tresor (OATs) accounts for nearly two-thirds of all sovereign green bond volumes outstanding. In addition, the sovereign issuers of green bonds so far have employed syndication method for inaugural issuance as an attempt to mitigate potential difficulties that investors face during the price discovery process.
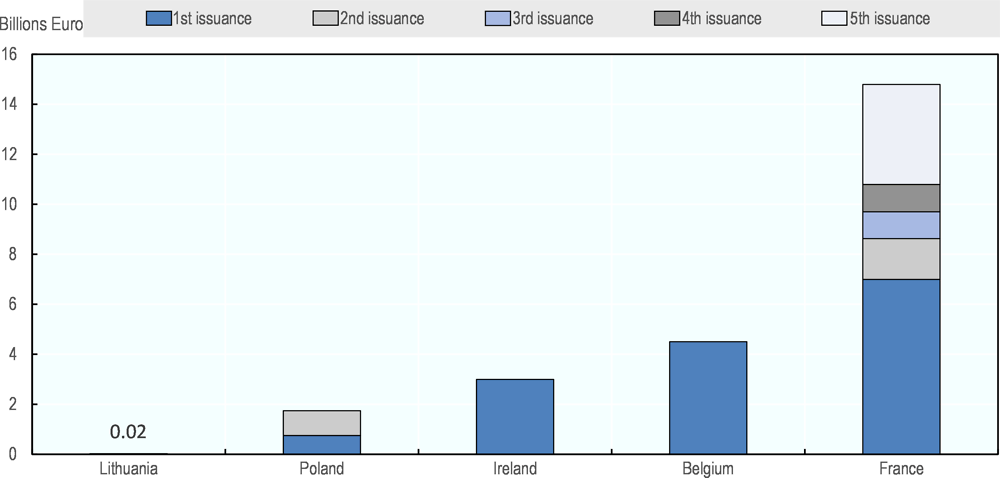
Source: National authorities’ websites and author calculations.
Against the background of successful issuance of sovereign green bonds in recent years, the sovereign green bonds market, still at a nascent stage, is expected to grow in coming years with additional offerings as well as debut selling. For example, the Dutch State Treasury Agency announced its plan to issue a green bond in 2019. From a government perspective, this is a way to demonstrate its commitment to the transition to a more environmentally friendly economy and, in particular, how it intends to raise capital to implement the Paris Agreement commitments. Sovereign issuance in green bond markets is also expected to contribute to the market’s growth by signalling and benchmarking roles.
From a debt management perspective, issuing green bonds may contribute to diversification of investor base as well as developing and deepening of the market for sustainable finance instruments. In addition, country experiences suggest that the issuance of green bonds brings about a positive market story with supportive news flows. However, green bonds require issuers to perform distinctive monitoring and reporting activities in order to respect green standards, along with additional marketing events to reach out to new investors. Also, lack of – or limited – green-eligible government expenditures can be a potential barrier to sovereign green bond issuance as issuing a new instrument requires a long-term commitment to create and maintain liquidity, and to lower issuance cost. Against this backdrop, the OECD Working Party on Public Debt Management (WPDM) elaborated existing practices and prospects for sovereign green bonds during its 2017 and 2018 annual meetings. Discussions revealed that issuers with limited funding requirements prefer to allocate their scarce activities in nominal bonds to secure their liquid sovereign curve. Some issuers, including Finland and Denmark, do not view earmarked project bonds as a perfect match to fund government budget. That said, issuing a green bond may create a fragmentation in sovereign issuance structures and increase funding costs due to illiquidity premium9, although their cash flows are similar to those of conventional bonds. With regard to country risk assessments, it was pointed out that institutional investors are applying ESG frameworks to provide further input into their sovereign risk scenario assessments and major credit rating agencies have already taken steps to incorporate ESG factors into country risk assessments. In this respect, some sovereign issuers see a need to be more proactive and transparent in providing information for investors on government initiatives and actions to promote ESG issues (State Treasury of Finland, 2019).
1.6. Achieving resilience to potential future shocks
The objective of public debt management is often defined as “to ensure that the government’s financing needs and its payment obligations are met at the lowest possible cost over the medium- to long-run, consistent with a prudent degree of risk”. Thus, specific decisions on annual funding must be taken in light of a long-term perspective10, given that many governments aim to enhance long-run fiscal resilience. These considerations are in many markets taken against the backdrop of elevated debt-to-GDP ratios and borrowing requirements today. Many OECD debt managers continue to make use of the risk-based debt management framework to achieve portfolios that are more resilient against to potential market risks, such as interest-rate volatility.
Lengthening the maturity structure of government debt, which helps to reduce roll-over risks, entailed relatively lower fiscal costs in recent years due to flattened yield curves. The share of long-term fixed interest rate debt in central government marketable debt for the OECD area as a whole increased from 75% in 2007 to 80% in 2018 and is projected to improve further in 2019 (Figure 1.10). Furthermore, in terms of the average maturity of outstanding debt, the weighted average term-to-maturity (ATM) figure for the OECD area has been rising and has coincided with larger issuance in recent years (Figure 1.14).
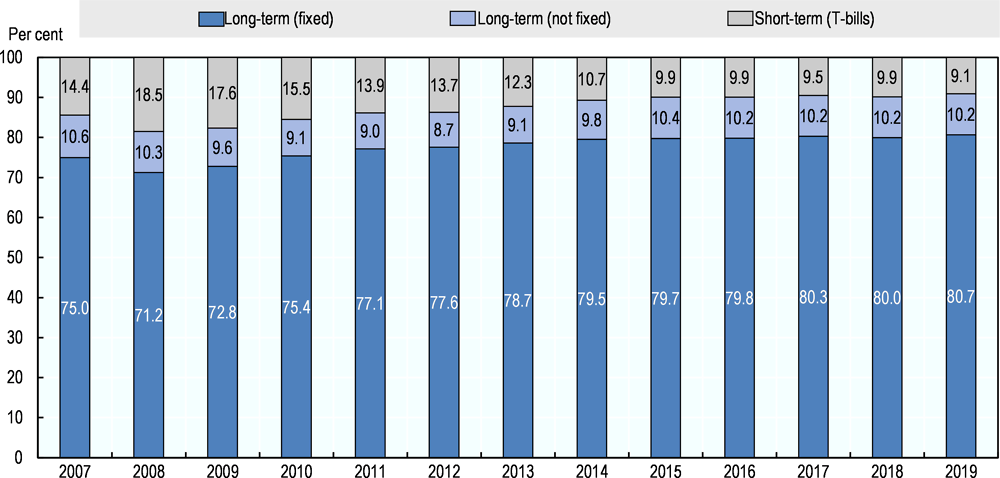
Source: 2018 Survey on Central Government Marketable Debt and Borrowing; Refinitiv, national authorities’ websites and author calculations.
Notes: See Annex 1.A1 for a list of countries in each country group.
Source: 2018 Survey on Central Government Marketable Debt and Borrowing; OECD Economic Outlook No. 104; Refinitiv, national authorities’ websites and OECD calculations.
The debt redemption profile in the OECD area deteriorated significantly in the post-crisis period notably for the G7 countries and the euro area, but it has been gradually improving in recent years. After reaching its highest level in 2016, medium- and long-term redemptions of marketable debt for the OECD area are estimated to have declined to 7.5% of GDP in 2018 and are projected to remain around that level in 2019 (Figure 1.11). The fall is mainly due to the prolonged low level of interest rates together with continued economic growth across the OECD area.
1.7. Implications of monetary policy developments for debt dynamics and government securities markets
Global financing conditions have recently tightened somewhat, as monetary policy in some regions have been reversing course from a very accommodative policy stance. The monetary policy normalisation in the major advanced economies is making an uneven progress, reflecting different stages of recovery from the financial crisis (OECD, 2018b). So far, the normalisation process has been calibrated diligently against the financial market response and the need to support growth along with inflation expectations. The Federal Reserve has begun unwinding its asset holdings by capping reinvestments since September 201711 and increased policy rates steadily since December 2015 on the back of solid economic growth and a strong labour market. As this publication goes to press, the Federal Reserve kept the target range for the federal funds rate on hold, and adopted a ‘patient’ stance for future adjustments to the target range in its January 2019 meeting. In terms of balance sheet normalisation, the Fed made no change to its current policy, but hinted at the possibility of some adjustments if needed in the future. In December 2018, the ECB has ended its vast asset purchasing programme and committed to reinvest the proceeds of maturing bonds that it already owns for an extended period of time – meaning that its portfolio will remain at about the current level. The ECB has kept benchmark interest rates on hold. Meanwhile, the Bank of Japan is continuing with its asset purchases to maintain 10-year government bond yields around 0% and has not communicated any plan for reducing stimulus.
The gradual exit from unconventional monetary policy has important implications for financial markets in general, and for government securities markets in particular, through a number of potential channels. These include, but are not confined to, changes in borrowing costs, investor base and liquidity risk. In this respect, sovereign debt managers face challenges stemming from monetary policy normalisation. The sensitivity of debt servicing costs to interest rate risk might be heightened in case of a sudden and sharp rises in market rates. In addition, due to the complications generated by sudden shifts in sentiment and perceptions of risk associated with certain sovereigns, rollover risk may emerge as a key policy concern for debt managers, in particular in countries with – perceived - debt sustainability problems.
The cost of sovereign borrowings, still at historically low levels, is on an upward trend in many countries. In several OECD countries, government bonds are still trading at low yields sometimes even at negative nominal yields (e.g. up to 3-year maturity in France, 7-year maturity in Germany and, 10-year maturity in Japan). Nevertheless, government bond yields have increased since the end of 2017 in the majority of OECD countries. Figure 1.12 presents the changes in 10-year government bonds yields between December 2017 and December 2018 average in OECD countries. The figures reflect a significant rise in borrowing costs in Hungary, Italy, Mexico and Turkey and to a moderate extent in the Czech Republic, Iceland, Israel and the United States over the review period. It should be noted that in some cases, political and geo-political factors (e.g. elections, the threat of protectionism and risks related to Brexit) have contributed to stressed market conditions, while investors became nervous in response to rising uncertainty. For example, concerns over Italy’s fiscal position and the news flow on the tensions between the Italian government and the European Commission about Italy’s budget proposals have adversely affected market sentiment for the most part of the second-half of 2018. Amidst political risk perceived as increasing and deterioration of country’s credit rating12, risk premiums on Italian government bonds rose to high levels. The spread between Italian and German 10-year bonds doubled between March 2018 and November 2018, climbed to above 300 basis points, and eventually declined to around 250 basis points by year end.
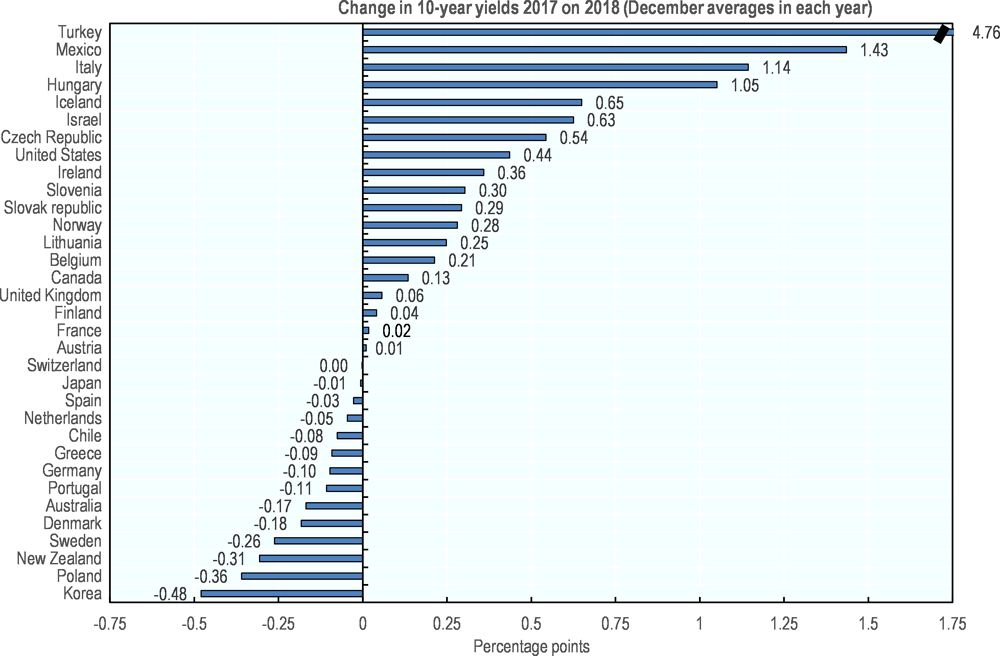
Notes: Percentage points difference between the average 10-year yields in December of each year.
Source: Refinitiv; OECD calculations.
The OECD Working Party on Public Debt Management (WPDM) discussed potential impacts of political events on the issuance environment on several occasions in the past. Political developments are often assessed to have only a temporary impact on sovereign yields, with limited effects on sovereign borrowing programmes (OECD, 2018a). 13 However, when political events are associated with growing fiscal deficits and take place in conjunction with monetary policy tightening, the adverse impact can be substantial depending on the size and the length of the market tensions. That said, the markets might suddenly perceive the debt of some sovereigns as “risky”.
Against this background, a transparent debt management framework and a predictable issuance strategy, a strong two-way communication policy – with policymaking authorities, investors and intermediaries such as primary dealers – are instrumental in reducing the type of market noise that can unnecessarily spur borrowing costs. In general, sovereign debt managers are in favour of transparency and predictability since the long-run benefits14 of predictability outweighs the disadvantages. However, more predictability means less flexibility. This may pose challenges when exposed to funding shocks. In this regard, some level of flexibility is necessary to provide issuers with room for manoeuvre. Country experiences suggest that the availability of contingency funding tools15, which provide flexibility for issuance plans, is critical for confronting challenges in periods of market stress. Today, the role of flexibility in issuance programmes has become more important given uncertainty associated with the monetary policy actions along with the uncertainty inherited in macroeconomic and fiscal projections. This is, in particular, relevant for the countries with high redemption profiles.
When flexibility is built into debt management policies, debt management offices (DMOs) can take a proactive approach on several fronts including i) addressing unexpected funding needs with low cost, ii) preventing possible threats to the government’s reputation and financing capacity due to failed auctions, and iii) easing market liquidity strains over certain bonds through buy-back or exchange operations. For example, keeping a liquidity buffer cushions events caused by market stress and increases financial flexibility, which in turn enhances market confidence (OECD, 2018a). Issuance of short-term instruments, such as T-Bills, are useful in absorbing shocks with at a relatively modest cost. For instance, in response to market volatility in June-July 2018, the Italian Treasury consulted with market participants, and held buy-back operations, exchange transactions through the Treasury cash buffer and tweaked some issuance to weather the storm.16
A sustained increase in interest rates pushes up debt servicing costs and, in turn, can put public finances and debt sustainability under sustained pressure. The impact assessment of higher interest rates and exchange rate movements on government interest expenditures through scenario analysis is quite important for policy makers to understand and assess future debt repayment capacity and fiscal resilience of an economy. Against this backdrop, DMOs often make use of stress tests to assess the impact of various shocks on debt dynamics and to project future interest expenses.
Overall, the impact of higher interest rates on interest costs of debt depends on the extent of the financing needs in the coming years and average maturity of existing debt. The transmission is expected to be relatively slow in countries where gross financing needs are limited and average-term-maturity is high. As discussed in previous sections, after being steady in recent years, net borrowing requirements of OECD governments increased in 2018 and are expected to rise further in 2019. Looking at country level data reveals significant differences in net financing needs. For example, net borrowing requirements of the G7 countries are significantly higher than the rest of OECD area.17 In contrast, smaller countries like Austria, Denmark, Sweden and Ireland have decreasing and/or limited net borrowing requirements. Nevertheless, a government needs to finance not only net borrowing needs, but also total redemptions - rolling-over existing debt -. When redemptions are sizeable, alongside high new borrowing requirements, the DMO may face considerable refinancing risk. Total redemptions of debt in the OECD area have soared in post-financial crisis period, and have remained high since then. Higher rollover risk is reflected in the challenging redemption profiles for the next three years (Figure 1.13). For the OECD area as a whole, governments will need to refinance around 40% of their outstanding marketable debt in the next three years. Among the G7 countries, the large volumes of scheduled redemptions in France and Italy following the one of the United States and Japan are the most challenging. Emerging OECD countries have also substantial refinancing needs in the next three years. That implies a high interest rate risk for sovereigns that might need to refinance existing debt at (much) higher interest rates. If rising interest rates coincide with exchange rate depreciations, Hungary, Mexico and Turkey would face higher debt servicing costs as they have relatively high foreign currency denominated liabilities.
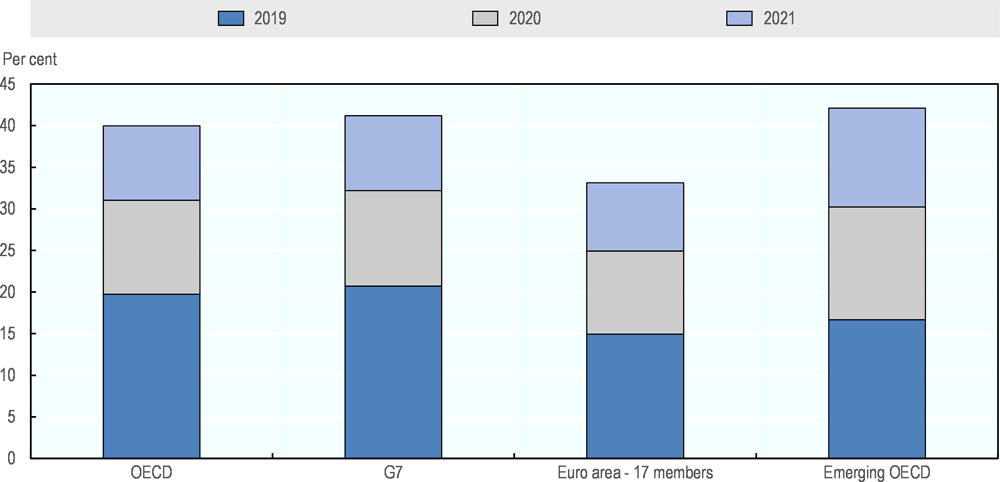
Notes: Cumulative percentage of debt maturing in the next 12, 24 and 36 months (i.e. in 2019, 2020 and 2021), as a percentage of total marketable debt stock (without cash) in 2018. Excludes Estonia, Latvia and Luxembourg.
Source: 2018 Survey on Central Government Marketable Debt and Borrowing; OECD Economic Outlook No. 104; Refinitiv, national authorities’ websites and OECD calculations.
The maturity structure of central government debt has improved significantly since the financial crisis, owing to lengthened borrowing maturities. The share of long-term debt in central government marketable debt reached 90% in 2015 and has hovered around that level since then (Figure 1.10). Another important indicator of long-term interest rate risk is the average term-to-maturity (ATM) ratio. Figure 1.14 displays the trend in ATM of outstanding marketable debt in selected OECD countries since 2007. The weighted ATM has been increased from 6.2 years in 2007 to almost 8 years in 2018, which implies a slower pass-through of changes in market interest rates to government interest costs. Among OECD countries, the United Kingdom has by far the highest ATM with 17.5 years, followed by Chile, Switzerland and Mexico. On the other hand, ATM for some countries such as the Czech Republic, Hungary and Poland is lower than the OECD average, which implies a relatively higher exposure to changes in market interest rates.
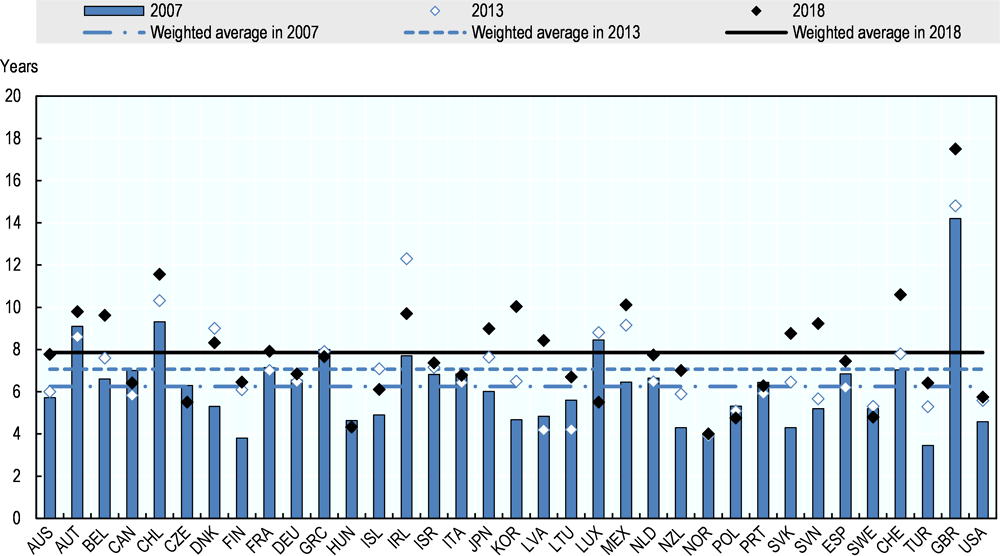
Notes: Data are collected from Debt Management Offices and national authorities’ websites. Data are not strictly comparable across countries, see Annex 1.A1 for further details. The weighted average was calculated using data from all countries for which ATM was available for 2007, 2013, and 2018.
Source: Surveys on central government marketable debt and borrowing; Debt Management Offices and national authorities’ websites and author calculations.
Taken as a whole, although several countries managed to strengthen their fiscal resilience to shocks during the post-crisis period, a number of countries where relevant indicators are still poor have significant exposure to hikes in interest rates and changes in market sentiment. Furthermore, the reduced credit quality of sovereign bond issuance in the OECD area, notably in the G7 countries, has not been reflected in the cost of sovereign borrowing over the past decade (OECD, 2018a). In times of market turbulence, while “safe havens”, such as Germany, Japan and the US, experience the “flight to safety” phenomenon, sovereigns with weak fundamentals are more vulnerable to changes in market sentiments and spikes in borrowing rates. Although the volumes of scheduled redemptions of some euro area countries, particularly France, Italy and Spain, are fairly substantial for the next few years, roll-over risk should be manageable under relatively “normal” market access conditions. However, funding conditions for governments can become difficult due to the complications generated by sudden shifts in market sentiment. If market sentiment turns negative, risk premiums may rise sharply, putting public debt sustainability in danger depending on the length of the stressed period.
It should be emphasized that having sustained market access can be much more important than paying higher interest rates on government financing under certain circumstances. Once access to the market is lost, it can take a long and painful period for a sovereign to regain a full market access. In this regard, history holds valuable lessons: For example, following the European sovereign debt crisis, Ireland and Portugal were able restore full market access in 2013 and in 2014, respectively. Further discussion of country experiences with regaining market access following the European debt crisis is provided in the Chapter 3 of this Outlook.
During the last decade, central banks have become one of the key investors of sovereign debt in several major OECD countries due to asset purchase programmes. For instance, central bank holds more than 40% of national government debt in Japan, above 20% in Germany, France and the United Kingdom and, 15% in the United States (as of December 2018). In this respect, the end of PSPP in the euro area and the reduction of asset holdings by the Federal Reserve will require gradually rising demand from other investors in the euro area and the United States. The gradual withdrawal of such large buyers may exert some upward pressure on bond yields. So far, policy steps regarding balance sheet normalisation have been well-communicated and explained in advance so that investors could account for these changes their investment decisions. Given the governments’ need for new debt is substantial, sovereign DMOs should benefit from re-engaging with their traditional investor base, such as pension funds and insurance companies, and putting more emphasis on regional diversification. With rising yields, a higher demand from ‘real money investors’ and foreign investors in search of high-quality assets with positive yields could be anticipated. In particular, the move away from sub-zero yields will be welcomed by the investors with self-imposed investment constraints regarding nominal positive returns. Chapter 2 looks at the evolving structure of investor base in addition to the role of investor base information in public debt management.
In times of heightened financial and political risks, advanced markets such as Germany, Japan and the United States with their highly liquid markets and rule of law are seen as “safe havens”. In the meantime, changes in monetary policies in advanced economies, particularly in the United States and the euro area, have spill over effects on emerging economies. Recent monetary policy tightening in the United States has contributed to repricing across many asset markets. This, together with macroeconomic vulnerabilities and political tensions, led to significant financial turbulence in a few emerging-market economies, involving sizeable currency depreciations against the US dollar (OECD 2018b). Central banks striving for long-run systematic policy framework, take various factors into account including prospect associated with slower global growth. Yet, the speed of monetary normalisation and ultimate size of the central bank’s balance sheets are unclear.
Borrowing conditions may become vulnerable to sudden shifts in investor sentiment and perceptions of sovereign risk. Thus, market liquidity, which is inherently delicate, will be a significant parameter to be watched going forward. Although it may look good now in some markets, it could be insufficient to handle large trades under stressed market conditions. Going forward, with monetary policy stance is expected to be less supportive, heightened financial and political risks could increase the probability and potential impact of adverse liquidity shocks to the financial system. Against this backdrop, the following part of this chapter discusses secondary market liquidity conditions of government securities through the lens of public debt managers.
1.8. Concerns over secondary market liquidity of government securities have been somewhat eased
Secondary market liquidity of government securities is important for support financial stability. When markets are illiquid, interest rates tend to be higher due to additional risk premium18, reflecting a higher probability of heightened volatility of price movements. From a public debt management perspective, reduced liquidity of government securities impairs primary market access and increases borrowing costs for sovereigns. In this respect, sovereign DMOs aiming at ensuring cost-effective financing encourage the development of a liquid and efficient government securities market and often play a key role in developing and securing well-functioning markets (OECD, 2018a).
Liquidity is a complex and subjective issue as there is no consensus on either the optimum level or the future course of market liquidity. For instance, although liquidity may look good now in some markets, it could be insufficient to handle large trades under stressed market conditions, especially with reduced involvement of central banks. Also, it is difficult to identify causes of changes in market liquidity as a wide range of factors are effective at the same time. In recent years, liquidity conditions in government securities markets have been constantly changing, reflecting combined influences of various factors including financial sector adjustments to post-crisis regulations; unconventional monetary policies; changes in composition of the investor base; and the proliferation of electronic trading venues and strategies.
The OECD survey of liquidity in secondary government bond markets aims to capture sovereign issuers’ assessments of liquidity conditions annually. Major factors affecting secondary market liquidity of bonds include monetary policy developments, political uncertainties, new financial regulations, new financial technologies, evolution of government funding requirements and issuance strategies. The 2018 survey revealed that 14 OECD countries indicated enhanced liquidity conditions (Figure 1.15). The improvements in market infrastructures and in primary dealer (PD) systems, transparency and predictability about government borrowing as well as diversification of the investor base are listed as the main driving factors of better conditions in domestic market liquidity in these countries. On the other hand, 13 countries including Finland, Iceland and Israel continued to perceive deterioration in liquidity conditions in their local currency debt market, in particular for off-the-run securities. This is reflecting a confluence of factors, including regulatory requirements, diminished financing requirements and increased presence of buy-and-hold type of investors (e.g. central banks).
Compared to the 2016 survey results, the share of sovereign debt managers observing “worse” market liquidity conditions has decreased considerably. In 2016, a majority of the respondents (61%) indicated ‘worse’ liquidity conditions in domestic sovereign bonds. In the following two years, the results revealed lower shares of respondents indicating ‘worse’ conditions (37% in 2017 and 2018), which implies an improvement in market liquidity conditions. However, caution is advisable when interpreting the results, given a significant number of respondents indicate ‘no change’ (i.e. 30% in 2017 and 23% in 2018), or ‘worse’ (i.e. 37% in 2017 and 2018) market liquidity conditions in recent years. Taken as a whole, it can be concluded that observations on market liquidity conditions, which are still worse than the pre-crisis environment, have relatively improved recently in several OECD countries.
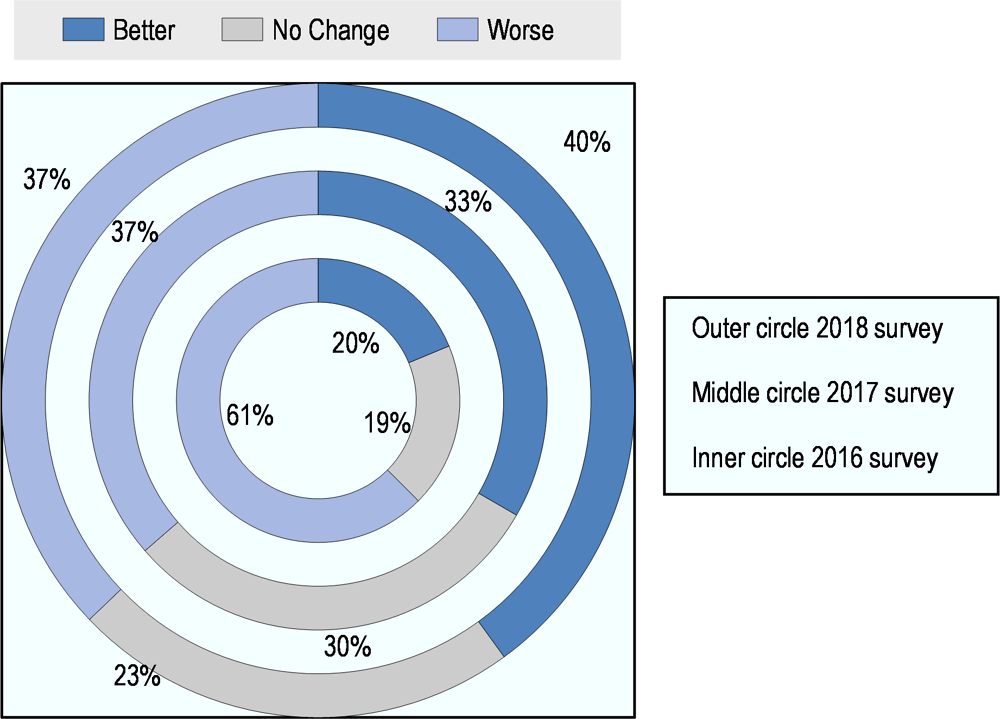
Source: OECD Surveys on liquidity in secondary government bond markets (2016, 2017 and 2018).
Liquidity is not easily defined and measured given the evolving market structure (e.g. rising role of exchange traded funds and high-frequency trading). For example, algo-trading platforms hold a lot of seamless trades in small sizes in great frequencies, especially for on-the-run securities (Brain et al., 2018b). Against this backdrop, PDs still have a predominant role in government securities markets in major OECD countries. During the 2018 annual meeting of the OECD Working Party on Public Debt Management (WPDM), members discussed the role of PDs in providing liquidity and implications of reduced warehouse capacities of PDs, as market makers. Anecdotes highlighted that holding sovereign bonds on a bank’s balance sheet and making that balance sheet available for trading of government bonds has become more costly for PDs following the financial regulation reforms. That said, it makes it harder for PDs to intermediate sovereign bonds due to higher warehouse costs. This is particularly relevant for the countries with low borrowing needs such as Denmark, Germany and Sweden. Against the backdrop of the reduced warehouse capacity of banks, members of the WPDM have repeatedly stressed that regulatory changes in the financial system should strike the right balance between reducing risks – hence improving financial stability – and allowing the market-making abilities of banks (OECD, 2013 and 2014).
In response to the perceived deterioration in liquidity conditions, many DMOs have implemented various measures in recent years. These include changes in frequency and size of auctions; obligations and privileges of primary dealership systems; secondary market activities such as buy-backs and switches and securities lending facilities. The survey results indicate that secondary market liquidity conditions are still a source of concern in many markets, albeit recent measures taken by many DMOs have paid-off with some signs of relative improvement (e.g. Denmark, Germany, Turkey and the United Kingdom).
With the aim of enhancing liquidity in the government bonds markets, some DMOs have modified obligations and privileges of PDs in recent years. For instance, DMOs in Denmark, Iceland and Sweden provide a compensation for PDs based on their performance in secondary market trading. Another commonly used tool is buy-back and switch operations that enables issuers to strategically increase the size of on-the-run bonds. In 2018, the Danish central government has purchased all government-guaranteed mortgage bonds issued for financing social housing. These purchases are expected to allow the central government to build up series of liquid government securities and maintain a broad range of on-the-run issues (Danmarks National bank, 2018). In addition, a few DMOs have adopted more frequent and smaller auctions. For large issuers (e.g. the United Kingdom), adopting frequent and smaller-sized auctions in sovereign borrowing programmes can promote market liquidity of government bonds. However, smaller issuers may find it difficult to attract the attention of investors if auctions are too frequent (OECD 2018a). In this regard, faced with shrinking borrowing requirements, several small issuers prefer to reduce the number of auctions to underpin auction size and offer multiple securities in each auction. Another tool to support PDs is to offer securities lending facilities (SLFs) to act as a lender of last resort and promote secondary market liquidity by helping market participants continuously quote prices and avoid delivery failures. A detailed set of policy and management information about security lending facility practices in OECD DMOs, in terms of their purpose, use and common features is provided in Box 1.1.
Lastly, availability of comprehensive trade data on a timely basis offers deeper insights into liquidity developments in different segments of the market (e.g. maturity segments, on-the-run versus off-the-run securities, and trading venues) and thus facilities monitoring and interpreting market dynamics, as anecdotal commentaries could sometimes be misleading.19 Therefore, DMOs attach special importance to improving collection of trade data in terms of its scope, quality and frequency. According to an OECD survey run amongst the DMOs in 2017, data collection on bond trade activities has improved in recent years in most OECD countries; however, there are still data gaps.20 For example, faced with major constraints in readily available micro-level data following the flash-crash in the US Treasury market in October 2014, the US authorities started to obtain such data through the Financial Industry Regulatory Authority by expanding the Trade Reporting and Compliance Engine (‘TRACE’). The TRACE data have allowed for a more granular analysis and view of interdealer broker (IDB), dealer-to-dealer (DTD), and dealer-to-client (DTC) trading in different segments of the Treasury market (Brain et al., 2018a and 2018b).
The purpose and the use of the securities lending facility
A securities lending facility (SLF), through which the owner of bonds transfers them temporarily to a borrower, is a well-known policy tool used by central banks for monetary policy for financial stability purposes. Nevertheless, it is also a common practice amongst public debt management offices, who act as the lenders of last resort for government securities. From public debt management perspective, the SLF is one of the most common policy tools for promoting market liquidity of government securities. Securities lending can make significant contributions to the functioning of bond markets, as it supports market participants to continuously quote prices and reduces the risk of shortages, avoids settlement problems and in turn, enhance liquidity in government debt markets. Particularly, it has been proven to be a valuable tool during episodes of market stress.
Discussions by the Working Party on Debt Management highlighted that these facilities played a paramount role during the financial crisis when many banks turned to debt management offices (DMOs) to meet funding needs as market liquidity dried up. Since then, there has been a renewed interest in the design of SLFs. In recent years, liquidity in government bond markets has deteriorated in several countries, reflecting a confluence of factors, including regulatory requirements, investor base flows and supply shortages. This has been particularly relevant in the case of less liquid – scarcer – securities. Against this backdrop, several DMOs have been temporarily providing securities to help avoiding settlement failures, facilitating market-making activities, compensating for reduced holdings – due to increased warehousing costs, thus, encouraging their activity in government securities market.
Experiences suggest that the facility is often used sporadically. For example, the DMOs of Australia, Canada and Portugal have employed this facility only occasionally to mitigate strains in the government securities market in recent years. In Canada, the facility was used very actively in 2015 during a temporary shortage of Canadian sovereign bonds, and assessed as an effective tool for closing the demand-supply gap for individual securities and prevented settlement fails to a large extent. In recent years, the facility has been used regularly as an integral part of the annual debt management programme in a few countries where government funding needs are limited and debt is declining (e.g. Denmark, Germany, Ireland and Sweden). For example, the Swedish DMO faced with a sustained reduction in government financing needs and mounting concerns over liquidity conditions, has increased its repo facility significantly since the start of its Quantitative Easing Programme in 2015.
In a few countries including Finland and Turkey, it was established, but has never been utilised. Some large issuers (e.g. Italy, Japan, and the United States) do not have a SLF in place. In these cases, other tools such as re-opening issues, buy-back and switch operations are found to be suitable or most consistent with a “regular and predictable” debt management framework.
Common features of SLFs
A recent OECD survey of SLFs indicates that this facility is in place in 20 DMOs. In many cases, it has existed for more than ten years (e.g. Australia, Belgium, Canada, Denmark, Hungary, Iceland, Israel, Mexico, Portugal and Sweden), while a few countries have adopted it during the last five years (e.g. Finland, France and Germany). The survey results also indicate that three DMOs are considering establishing a SLF.
In majority of the surveyed countries, the facility is offered exclusively to primary dealers (PDs) who must comply with quoting obligations and often engage in short positions as part of their daily market-making activity. However, there are certain limits applied to the extent of PDs’ borrowing securities through SLFs in terms of aggregate amount, per security and per firm. A vast majority of the SLFs designate O/N and T/N with same day settlement. In terms of managing counterparty risk, DMOs use cash and government securities as collaterals, and apply a fixed fee as well as monetary penalties at delivery failures.
Source: The information provided in this box is mainly drawn from the results of a survey conducted on Security Lending Programmes complied by the Swedish Debt Management Office for the annual meeting of the OECD Working Party on Debt Management on 6-7 November 2018.
References
Brain, Doug, Michiel De Pooter, Dobrislav Dobrev, Michael Fleming, Pete Johansson, Collin Jones, Michael Puglia, Frank Keane, Liza Reiderman, Tony Rodrigues, and Or Shachar (2018a); “Unlocking the Treasury Market through TRACE” FEDS Notes; Board of Governors of the Federal Reserve System, September 28, 2018; https://doi.org/10.17016/2380-7172.2251.
Brain, Doug, Michiel De Pooter, Dobrislav Dobrev, Michael Fleming, Pete Johansson, Frank Keane, Michael Puglia, Tony Rodrigues, and Or Shachar; (2018 b) “Breaking Down TRACE Volumes Further,” Federal Reserve Bank of New York Liberty Street Economics (blog), November 29, 2018; https://libertystreeteconomics.newyorkfed.org/2018/11/breaking-down-trace-volumes-further.html.
Danmarks Nationalbank (2018), “New financing of social housing strengthens the market for Danish government Securities”, December 2018 Analysis No. 14, Copenhagen; www.nationalbanken.dk/en/governmentdebt/publications/Pages/New-financing-of-social-housing-strengthens-the-market-for-Danish-government-securities.aspx
Dell’Ariccia, Giovanni, Pau Rabanal, and Damiano Sandri (2018), “Unconventional monetary policies in the euro area, Japan, and the United Kingdom”, Hutchins Center Working Paper 48, October 2018; https://www.brookings.edu/wp-content/uploads/2018/10/WP48-DellAriccia-et-al.pdf
Dutch State Treasury Agency (2019), “Outlook 2019”, December 2018; https://english.dsta.nl/documents/publication/2018/12/14/outlook-2019
Federal Reserve Bank of New York (2017), “Projections for the SOMA Portfolio and Net Income”, July 2017; www.newyorkfed.org/medialibrary/media/markets/omo/SOMAPortfolioandIncomeProjections_July2017Update.pdf
Federal Reserve Bank of New York (2018), “Monetary Policy Strategies for a Low-Neutral-Interest-Rate World”, November, 2018; Speech by John C. Williams Remarks at the 80th Plenary Meeting of the Group of Thirty, Federal Reserve Bank of New York, New York City; https://www.newyorkfed.org/newsevents/speeches/2018/wil181130
HM Treasury (2018a), “Debt Management Report 2018-19”, March 2018, https://dmo.gov.uk/media/15381/drmr1819.pdf
HM Treasury (2018b), “Managing fiscal risks: government response to the 2017”, July 2018; https://assets.publishing.service.gov.uk/government/uploads/system/uploads/attachment_data/file/725913/Managing_Fiscal_Risks_web.pdf
Sustainable Banking Network (2018), “Creating Green Bond Markets – Insights, Innovations, and Tools from Emerging Markets”, October 2018; www.ifc.org/wps/wcm/connect/2448e622-3e36-4098-b228-ffe52185af51/SBN+Creating+Green+Bond+Markets+Report+Toolkit.pdf?MOD=AJPERES
Koijen, R.S.J., F. Koulischer, B. Nguyen, and M. Yogo (2016), “Quantitative easing in the euro area: The dynamics of risk exposures and the impact on asset prices”, Banque de France, Document de Travail No. 601, September.
Kearns, J., A. Schrimpf and D. Xia (2018), “Explaining Monetary Spillovers: The Matrix Reloaded”, November 2018, BIS Working Papers No 757; https://www.bis.org/publ/work757.htm
Maravalle, A. and L. Rawdanowicz (2018), "To shorten or to lengthen? Public debt management in the low interest rate environment", OECD Economics Department Working Papers, No. 1483, OECD Publishing, Paris; https://doi.org/10.1787/192ef3ad-en
Mehrotra, N. R. (2017), “Debt Sustainability in a low interest rate world”, Hutchins Center Working Paper 32, June 2017; www.brookings.edu/wp-content/uploads/2017/06/wp32_mehrotra_debtsustainability.pdf
OECD (2013), OECD Sovereign Borrowing Outlook 2013, OECD Publishing, Paris; https://doi.org/10.1787/23060476
OECD (2014), OECD Sovereign Borrowing Outlook 2014, OECD Publishing, Paris; https://doi.org/10.1787/sov_b_outlk-2014-en
OECD (2017a), OECD Sovereign Borrowing Outlook 2017, OECD Publishing, Paris; https://doi.org/10.1787/sov_b_outlk-2017-en
OECD (2017b), Business and Finance Outlook Scoreboard, www.oecd.org/daf/oecd-business-and-finance-scoreboard.htm
OECD (2018a), OECD Sovereign Borrowing Outlook 2018, OECD Publishing, Paris; https://doi.org/10.1787/sov_b_outlk-2018-en
OECD (2018b), OECD Economic Outlook, Volume 2018 Issue 2, OECD Publishing, Paris; https://doi.org/10.1787/eco_outlook-v2018-2-en
State Treasury of Finland (2019), “Debt Management Annual Review 2018”; www.treasuryfinland.fi/en-US/News_and_publications/Publications/Annual_reviews
Turner, D. and F. Spinelli (2012), “Interest-rate-growth differentials and government debt dynamics”, OECD Journal: Economic Studies, Vol. 2012/1; https://doi.org/10.1787/eco_studies-2012-5k912k0zkhf8
US Treasury (2018), “Report to the Secretary of the Treasury from the Treasury Borrowing Advisory Committee of the Securities Industry and Financial Markets Association”, Presss release on 30 October 2018; https://home.treasury.gov/news/press-releases/sm539
Regional aggregates
-
Total OECD area denotes the following 36 countries: Australia, Austria, Belgium, Canada, Chile, Czech Republic, Denmark, Estonia, Finland, France, Germany, Greece, Hungary, Iceland, Ireland, Israel, Italy, Japan, Korea, Latvia, Lithuania, Luxembourg, Mexico, Netherlands, New Zealand, Norway, Poland, Portugal, Slovak Republic, Slovenia, Spain, Sweden, Switzerland, Turkey, the United Kingdom and the United States.
-
The G7 includes seven countries: Canada, France, Germany, Italy, Japan, United Kingdom and the United States.
-
The OECD euro area includes 17 members: Austria, Belgium, Estonia, Finland, France, Germany, Greece, Ireland, Italy, Latvia, Lithuania, Luxembourg, Netherlands, Portugal, Slovak Republic, Slovenia and Spain.
-
In this publication, the Emerging OECD group is defined as including five countries: Chile, Hungary, Mexico, Poland and Turkey.
-
The euro (€) is the official currency of 19 out of 28 EU member countries. These countries are collectively known as the Eurozone. The Eurozone countries are Austria, Belgium, Cyprus, Estonia, Finland, France, Germany, Greece, Ireland, Italy, Latvia, Lithuania, Luxembourg, Malta, the Netherlands, Portugal, Slovakia, Slovenia, and Spain.
-
In the case of figure 1.6. (Government benchmark interest rates in OECD countries) calculations for 3-year, 5-year and 10-year benchmark government bond yields, used the following group of countries: Australia, Austria, Belgium, Canada, Czech Republic, Denmark, Finland, France, Germany, Hungary, Iceland (5-year and 10-year yields only), Ireland (5-year and 10-year yields only), Israel, Italy, Japan, Korea, Lithuania, Mexico, Netherlands, New Zealand (5-year and 10-year yields only), Norway (5-year and 10-year yields only), Poland, Portugal, Slovak Republic (5-year yields only), Spain, Sweden, Switzerland, United Kingdom, United States.
Calculations, definitions and data sources
-
Standardised gross borrowing requirements (GBR) as a percentage of GDP are calculated using nominal GDP data from the OECD Economic Outlook No. 104, November 2018.
-
To facilitate comparisons with previous versions of the Outlook, figures are converted into US dollars using exchange rates from 1 December 2009, unless indicated otherwise. Where figures are converted into US dollars using flexible exchange rates, the main text refers explicitly to that approach. Source: Refinitiv. The effects of using alternative exchange rate assumptions (in particular, fixing the exchange rate versus using flexible exchange rates) are illustrated in Figures 1.3 and 1.4 of Chapter 1 of the Sovereign Borrowing Outlook, 2016.
-
All figures refer to calendar years unless specified otherwise.
-
Aggregate figures for gross borrowing requirements (GBR), net borrowing requirements (NBR), central government marketable debt, redemptions, and debt maturing are compiled from answers to the Borrowing Survey. The OECD Secretariat inserted its own estimates/projections in cases of missing information for 2018 and/or 2019, using publicly available official information on redemptions and central government budget balances.
-
The average term-to-maturity data in Figure 1.14 is not strictly comparable across countries. Some countries may exclude some securities (like short-term debt) whilst others may include them. The following notes were received from each country:
Notes
← 1. * This chapter was published online on 8 February 2019.
← 2. The cut-off date for data collected through the Survey on Central Government Marketable Debt and Borrowing conducted by the OECD Working Party on Debt Management and other data considered in this chapter was December 2018.
← 3. In the United States, the federal tax cut and the increase in federal spending at the beginning of 2018 substantially increased the government deficit, requiring a jump in the amount of Treasury securities needed to fund the gap.
← 4. Between 2014 and 2016, the volume of negative-yielding fixed-rate bond issues in 14 OECD countries stood at USD 1.25 trillion, total premiums received reached a substantial level, and the maturity of negative-yielding issues went out to 10 years in Germany, Japan, and Switzerland (OECD, 2017a).
← 5. The US Treasury moved the settlement and maturity of the US 1-month bill from Thursdays to Tuesdays to pair with the newly introduced 2-month bill (the settlement date for the 3-month, 6-month, and 1-year T-bills continue to settle and mature on Thursdays), to reduce settlement sizes, to smooth out cash balance, and to help dealers to digest issuance amounts.
← 6. As of 2017, index-linked gilts account for around 25 percent of the UK government’s annual debt issuance as well as its debt portfolio – the highest level among G7.
← 7. The term “green bond” refers to debt securities whose proceeds are used to finance governments’ projects with an environmental benefit (OECD, 2018a).
← 8. In terms of issuer type in green bond markets, development banks and financial corporates account for more than two thirds of the total green bond market while sovereigns, which constitute a large share of traditional bond issuance, are increasing market share in recent years (Sustainable Banking Network, 2018). In addition to OECD countries, Fiji (2017), Indonesia (green sukuk, 2018) and Nigeria (2017) are among countries that issued sovereign green bonds in recent years.
← 9. Liquidity premium is a risk premium demanded by investors to compensate for uncertainty of the ability to sell a security easily for its fair market value.
← 10. OECD DMOs consider a long-term impact of potential strategies through modelling exercises which optimises interest cost volatility relative to the cost that is paid over long periods (e.g. simulation horizon is 20 years for the US TBAC debt management model, 10 years in Canadian debt strategy model). Several DMOs share in depth information about the risk models/techniques that are used to help debt managers determine their optimal financing strategy (e.g. Canada, Denmark, Turkey and the US), via working papers and annual debt reports.
← 11. In September 2017, the Federal Reserve voted a plan to gradually scale back reinvestments of maturing securities: Principal payments from maturing securities were planned to be reinvested only if they exceed gradually rising caps (Federal Reserve Bank of New York, 2017). Hence, the US Treasury securities held by the Fed decreased from USD 2.5 trillion in September 2017 to USD 2.2 trillion in December 2018 (https://fred.stlouisfed.org/series/TREAST).
← 12. Pointing to the increased credit risk associated with potential fiscal loosening, Moody’s downgraded Italy’s credit rating in October 2018, Fitch and S&P lowered country’s outlook from stable to negative in August and October 2018.
← 13. For example, several political events including the Brexit referendum in June 2016, the presidential elections in the United States in November 2016 and in France in April 2017 have created brief market swings. In each cases, risk premium widened for a period, but narrowed back to earlier levels as risk appetite returned to markets.
← 14. A predictable issuance programme i) raises DMO’s credibility, accountability; ii) allows transparent allocation; iii) reduces uncertainty for investors; iv) facilitates better communication and marketing. This, in turn, – based on expert judgment and investors’ feedback– broadens the investor base, lowers risk premiums and decreases borrowing costs and fosters secondary market liquidity.
← 15. A detail discussion on contingency funding tools such as immediate access to asset portfolio/liquidity buffer; issuance of short-term instruments, such as liquidity buffers, T-Bills and commercial papers; overdraft facility arrangements with CBs, and credit lines with banks is available in the 2018 edition of the SBO.
← 16. A set of detailed information on announcements and results of special operations is available on the Italian Treasury’s website: http://www.dt.tesoro.it/en/debito_pubblico/altre_operazioni/
← 17. Between 2007 and 2018, net borrowing requirements as a percentage of GDP for the OECD area as a whole has risen from 1% to 3%. In the same period, the ratio for the G7 countries has surged from about 1% to 3.8%.
← 18. Investors charge risk premium (extra return) for various risks associated with investment in bonds including, but not limited to, duration risk, credit risk, inflation risk and liquidity risk. Liquidity risk premium is investors’ additional compensation demand for uncertainty about the ability to sell a security easily at its fair market value.
← 19. For example, although there are anecdotal commentaries indicating growing hedge-fund activity in government securities markets in the post-crisis environment, the lack of more granular investor base data is limiting the analytical test of these arguments.
← 20. A data gap is reported to be exist particularly in i) investor type and geographical distribution, regarding both holdings and flow data, and ii high-frequency transaction-level bond market data (OECD, 2018a).