
Circular economy - waste and materials
Issues at stake
Material resources form the physical foundation of the economy and are an important source of income and jobs. They differ in their physical and chemical characteristics, their abundance and their value to countries. Economic growth generally implies growing demand for raw materials, energy and other natural resources, and growing amounts of materials that end up as waste if not properly managed.
The use of raw materials from natural resources and the related production and consumption processes have environmental, economic and social consequences in countries and beyond national borders. The intensity and nature of these consequences depend on the kind and amounts of natural resources and materials used, the stage of the resource cycle at which they occur, the way the material resources are used and managed, and the type and location of the natural environment from where they originate. Main concerns relate to the pressures exerted on natural assets, the associated negative environmental impacts (upstream and downstream) from the extraction, processing and use of materials, and the potential impact from inappropriate waste management on human health and the environment such as soil and water pollution, air quality, climate change, degradation of natural habitats and ecosystems.
Policy challenges
The main challenge is to improve resource efficiency and productivity and ensure that materials are used efficiently at all stages of their lifecycle (extraction, transport, manufacturing, consumption, recovery and disposal) and throughout the supply chain. This requires:
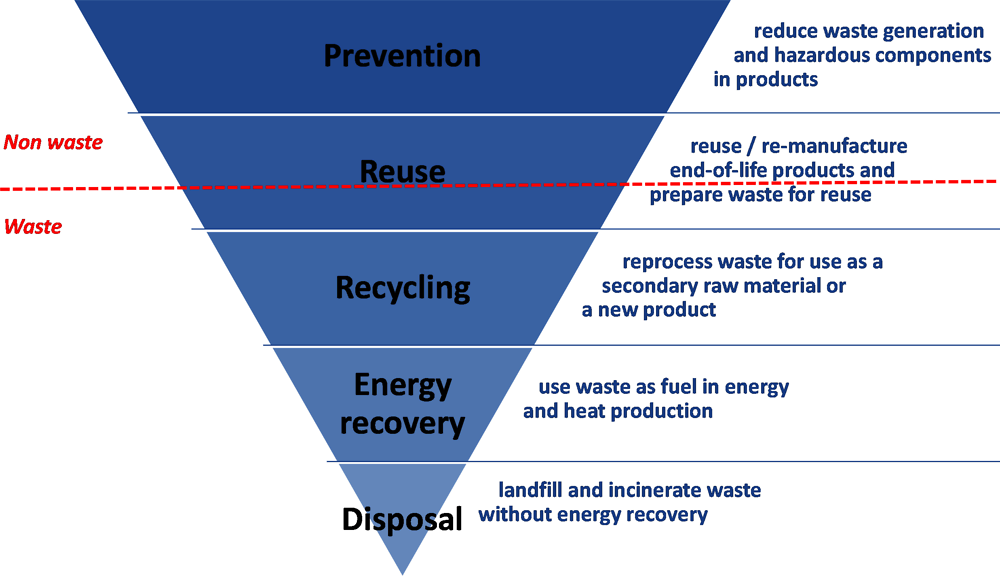
A broadening of the scope of waste management policies in line with the waste hierarchy, which ranks waste prevention as the most preferred option that can be encouraged through eco-design, reuse, repair, refurbishment, re-manufacturing, and extended producer responsibility schemes (see figure).
Integration of policies on materials, product and chemicals management, and use of life-cycle oriented waste and materials and product management and related policies.
Examples include 3R policies (reduce, reuse, recycle), sustainable materials management, sustainable manufacturing, resource efficiency and circular economy policies. Waste prevention can be encouraged through eco-design, reuse, repair, refurbishment, re-manufacturing, and extended producer responsibility (EPR) schemes.
Moving towards a resource efficient and circular economy is critical from both supply security and environmental perspectives and provides the basis for a sustainable and competitive economy. It is the way to ensure adequate supplies of materials; to manage the environmental impacts associated with their lifecycle and supply chain; and to make sure that natural resources are not degraded and remain available for future generations. Establishing a circular economy with improved waste and materials management further helps addressing the issue of microplastics in the environment and marine litter. Recovering materials from waste streams for recycling or reuse, using products longer and increasing the use intensity of goods through sharing economy approaches like car-sharing are some of the areas in which circular business models are operating. A circular economy seeks to:
maximise the value of the materials that circulate within the economy;
minimise material consumption, paying particular attention to virgin materials, hazardous substances, and waste streams that raise specific concerns (such as plastics, food, electric and electronic goods);
Source: OECD based on various other sources.
Measuring progress and performance
Environmental performance can be assessed against domestic objectives and international goals and commitments. Sustainable waste and materials management is part of the 2030 Agenda for Sustainable Development (New York, September 2015) under Goal 8 “Promote inclusive and sustainable economic growth, employment and decent work for all”, Goal 12 “Ensure sustainable consumption and production patterns” and Goal 14 “Conserve and sustainably use the oceans, seas and marine resources for sustainable development”. Absolute decoupling of materials use and environmental degradation from GDP growth is targeted in SDG 8.4. The sustainable management and efficient use of natural resources is targeted in SDG 12.2. The prevention and reduction of marine pollution, including marine debris is targeted in SDG 14.1.
Agreements and regulations on waste in general and transfrontier movements of hazardous waste in particular, include directives of the European Union, OECD Decisions and Recommendations and the Basel Convention that was amended in 2019 to cover plastic waste. G8 and G7 countries further adopted several plans and strategies related to the resource cycle, resource productivity and life-cycle based materials management. Resource efficiency was part of the G20 agenda in 2017.
Indicator groups
Waste management: total waste generation and intensities; municipal waste generation, intensities, recovery, recycling and disposal shares; electrical and electronic equipment put on the market, e-waste generated and collected intensities.
Use of material resources: material consumption mix and intensities, material productivity and material footprint intensities.
Key messages
Most countries continue to generate increasing amounts of waste; only a few have managed to decouple total waste generation (i.e. all sources of waste) from population and economic growth.
The developments for municipal solid waste are more positive as their growth rate appears to have peaked around the turn of the millennium. A person living in the OECD area generated about 534 kg of municipal waste in 2021; this is 39 kg more than in 1990, but 9 kg less than in 2000.
Waste is (slowly) increasingly being recovered for recycling, but landfilling remains the major disposal method in many OECD countries.
The amount of per capita electrical and electronic equipment put on the market, related e-waste generated and collected in the past decade, has been steadily increasing in almost all OECD countries. Only a fraction of the e-waste generated is collected, and an even lower fraction is recycled.
Main trends and recent developments
In most countries the amounts of total waste generated (i.e. all sources of waste) continue to increase generally in line with population and economic growth. Only a few countries (such as Hungary, Japan, Lithuania, the Netherlands, Sweden) have managed to relatively decouple their total waste generation from economic growth. The amounts of waste produced, their composition and their origin vary among countries; they relate to the structure of the economy and the level of investment in innovation and cleaner technologies.
During the 1990s, municipal solid waste generated in the OECD area has risen mostly in line with private consumption expenditure and GDP. As of the mid-2000s, this rise has been slowing down. The amount and composition of municipal waste vary widely among OECD countries; this is linked to levels and patterns of consumption, urbanisation rates, income levels, lifestyles, and national waste management practices.
In 2021, the quantity of municipal solid waste generated exceeded an estimated 730 million tonnes. A person living in the OECD area generates about 534 kg of municipal waste per year; this is 39 kg more than in 1990, but 9 kg less than in 2000. On average, Europeans generate less than people living in the Americas, but more than people living in the OECD Asia-Oceania region. It is estimated that worldwide, about 2 billion tonnes of municipal waste were generated in 2016 (about 270kg per person) and that this number will continue to grow (World Bank, 2019, What a Waste 2.0).
More and more waste is being diverted from landfills and incinerators and fed back into the economy through recovery and recycling. Mechanical and biological pre-treatment is increasingly used to facilitate recovery, enhance incineration efficiency, and reduce the amounts being landfilled. Manufacturers and importers are increasingly encouraged or required to accept responsibility for their products after the point of sale, through so-called “extended producer responsibility” or “product stewardship”. The European Union, Japan and other countries have introduced recycling targets and monitor progress through indicators.
The share of municipal solid waste landfilled in the OECD area has decreased from an estimated 53% to 40% between 2000 and 2021, with some countries no longer using landfills (Switzerland, Germany, Denmark, Finland, Sweden and Japan). Yet landfilling remains the main waste disposal method in several countries (e.g. in the OECD America region).
The recovery of waste through recycling, composting and incineration with energy recovery shows an encouraging increase since 2000 across the OECD area. Several countries now recycle more than one third of the municipal waste they manage (Belgium, Denmark, Germany, Korea, Latvia, , Slovenia).
Waste from electrical and electronic equipment (i.e. e-waste) is one of the fastest growing and most complex waste streams in the world, affecting both human health and the environment, and proliferating a loss of valuable raw materials. The amount of per capita electronic equipment put on the market, related e-waste generated, electrical and collected in the past decade, has been steadily increasing in almost all OECD countries. Per capita values for materials put on the market is particularly high (over 30 kg/capita) for countries such as Australia, Austria, Denmark, France, Germany, Iceland, the Netherlands and Norway. Only a fraction of the e-waste generated is collected. For example, while 27.6 kg/capita were put on the market in 2020 in the European Union, only 10.5 kg/capita were collected. Rates of recycling vary across countries and are only available for European countries in recent years. Rates of recycling in European countries vary between 62% and 92% of the per capita collected e-waste, resulting in low rates of recycling compared to the amounts generated. It is estimated that worldwide only 17.4% of 2019’s e-waste was collected and recycled (ITU, 2020).
Comparability and interpretation
Waste is generated at all stages of human activities. Its composition and amounts depend largely on consumption and production patterns. Data on waste are available for most OECD countries, but their quality varies significantly across countries.
Municipal solid waste is only a small share of total waste generated (about 10%), but its management and treatment often represents more than one-third of public sector financial efforts to abate and control pollution.
The definition of municipal waste, the types of waste covered and the surveying methods used to collect information vary from country to country and over time. The main problems in terms of data comparability relate to the coverage of household-like waste from commerce and trade, and of separate waste collections that may include hazardous waste from households such as waste batteries or waste electric and electronic equipment (WEEE) and waste collected by the private sector in the framework of extended producer responsibility schemes.
Electronic waste, or e-waste, refers to all items of electrical and electronic equipment (EEE) and its parts that have been discarded by its owner as waste without the intent of re-use. E-waste is also referred to as WEEE (Waste Electrical and Electronic Equipment), electronic waste or e-scrap in different regions and under different circumstances in the world. It includes a wide range of products - almost any household or business item with circuitry or electrical components with power or battery supply.
For further details see the metadata in the source databases listed under Sources below.
Key messages
The general trend in OECD countries is towards higher material productivity and lower per capita consumption of materials. But levels of material consumption per capita remain higher compared to other world regions.
Productivity gains are more modest once indirect flows of materials needed to satisfy final demand are considered. The material footprint, including materials extracted abroad and embodied in international trade, has increased in many OECD countries.
Main trends and recent developments
The amounts of materials consumed in OECD countries, in terms of domestic material consumption (DMC), and their per capita levels increased along with economic growth in the 1990s, and at a slower pace in the 2000s. Material consumption in the OECD area is about 19 Gt per year; almost half of this amount is consumed in the OECD America region. The material mix is dominated by non-metallic minerals, mostly for construction, followed by fossil energy carriers and biomass; metals represent less than 15% of the total on average.
DMC per capita decreased in most OECD countries since 2000. In some countries, such as the Baltic countries, per capita material consumption increased driven by economic growth and infrastructure development associated with a declining population. Overall, the levels of material consumption per capita remain higher in the OECD area (about 15 tonnes per person per year) compared to other world regions. However, in the coming decades growing populations with higher incomes and living standards will drive a strong increase in global demand for goods and services. Material consumption per capita in emerging and developing economies is thus expected to grow faster than in the OECD region.
Since 2000, the vast majority of OECD countries experienced improvements in material productivity (expressed as the amount of economic value generated per unit of materials used). OECD countries generated USD 2.9 per kg of materials consumed in 2017, compared to USD 2 per kg in 2006 (USD in 2015 constant PPP). This progress reflects efficiency gains in production processes, as well as changes in the materials mix and substitution of domestic production by imports. It also reflects a decreasing demand for materials following the 2008 financial crisis. In many countries, domestic material consumption decreased following the 2008 financial crisis and remained relatively stable afterwards while economic growth resumed.
When accounting for all materials needed to satisfy final demand in OECD countries, i.e. including materials extracted abroad and embodied in imported goods (i.e. a demand-based measure), progress is more modest. The per capita material footprint, is generally higher than DMC per capita. Countries with high import rates and high-income levels show higher material footprints.
Comparability and interpretation
Indicators presented are estimates. Their interpretation should take into account the properties and composition of material groups (materials are measured in weight), as well as countries’ endowments in natural resources and the structure of their economy. It should also consider commodity prices, waste management practices and consumption levels and patterns.
The data presented here refer to the mass of materials or substances produced from renewable and non-renewable natural resource stocks, used as inputs into human activities, and the products that embody them. Data coverage and completeness vary by variable and by country. In general, caution needs to be exercised when drawing conclusions based on country-level data. Although considerable progress has been made in the past decade to set up material flow accounts, missing information, including on physical flows of international trade and on secondary (recycled) raw materials, and a lack of consensus on conversion factors limit the calculation of some material flow indicators at the international level.
For further details see the metadata in the source databases listed under Sources below.
Domestic material consumption: Refers to the amount of materials directly used in an economy, or the apparent consumption of materials. DMC is computed as domestic extraction used minus exports plus imports.
Domestic material consumption mix: DMC of non-metallic minerals includes domestic extraction and trade of minerals used in industry and construction, plus trade of derived processed products; biomass includes domestic production from agriculture, forestry and fisheries, plus trade of raw and processed products from these sectors; fossil fuels include coal, crude oil, natural gas, peat and traded-derived products; and metals include domestic extraction of metal ores, plus trade of metal ores, metal concentrates, refined metals, products mainly made of metals, and scrap.
E-waste: Electronic waste, or e-waste, refers to all items of electrical and electronic equipment (EEE) and its parts that have been discarded by its owner as waste without the intent of re-use. E-waste is also referred to as WEEE (Waste Electrical and Electronic Equipment), electronic waste or e-scrap in different regions and under different circumstances in the world. It includes a wide range of products - almost any household or business item with circuitry or electrical components with power or battery supply. The definition of e-waste is very broad and covers six waste categories: (1) Temperature exchange equipment; (2) Screen, monitors; (3) Lamps; (4) Large equipment; (5) Small equipment; (6) Small IT and telecommunication equipment.
Material footprint per capita: Expressed in tonnes per capita; the material footprint is the global allocation of used raw material extracted to meet the final demand of an economy, thus including raw materials used in the production of imported products.
Material productivity: Expressed in USD/Kg; material productivity is the effectiveness with which an economy uses materials extracted from natural resources (physical inputs) to generate economic value (monetary outputs).
Municipal waste: Waste collected by or on behalf of municipalities. It includes household waste originating from households (i.e. waste generated by the domestic activity of households) and similar waste from small commercial activities, office buildings, institutions such as schools and government buildings, and small businesses that treat or dispose of waste at the same facilities used for municipally collected waste.
Municipal waste recovery rates: percentage of waste that is recuperated via recycling, composting or incineration with energy recuperation.
Municipal waste disposal rates: percentage of waste that is sent to final disposal (landfill or incineration without energy recovery).
Total waste generated: Primary waste (i.e. excluding residues from treatment operations) produced by the various sectors of economic activity (agriculture, mining and quarrying, manufacturing industry, energy production, water purification and distribution, construction, etc.).
OECD, "Waste: Municipal waste", OECD Environment Statistics (database), https://doi.org/10.1787/data-00601-en.
OECD, "Waste: Waste generation by sector", OECD Environment Statistics (database), https://doi.org/10.1787/data-00674-en.
OECD, "Waste: Waste from electrical and electronic equipment", OECD Environment Statistics (database), https://stats.oecd.org/Index.aspx?DataSetCode=EWASTE
OECD, "Material resources: Material resources", OECD Environment Statistics (database), https://doi.org/10.1787/data-00695-en.
References and further reading
OECD Data Portal, https://data.oecd.org/environment.htm.
ITU, UNU, UNITAR, ISWA (2020). The Global E-waste Monitor – 2020, United Nations University (UNU), International Telecommunication Union (ITU), United Nations Institute for Training and Research (UNITAR) & International Solid Waste Association (ISWA), Bonn/Geneva/Vienna, https://www.itu.int/en/ITU-D/Environment/Pages/Spotlight/Global-Ewaste-Monitor-2020.aspx
OECD (2019), Global Material Resources Outlook to 2060: Economic Drivers and Environmental Consequences, OECD Publishing, Paris, https://doi.org/10.1787/9789264307452-en.