
4. Water use and irrigation in agriculture
This chapter reports recent trends in water use indicators in the agricultural sector of OECD countries and illustrates some of the main drivers such as market developments, water infrastructure, irrigation technologies, and water policies. Case studies of France, Turkey and the United States highlight the relevance of these drivers
The statistical data for Israel are supplied by and under the responsibility of the relevant Israeli authorities. The use of such data by the OECD is without prejudice to the status of the Golan Heights, East Jerusalem and Israeli settlements in the West Bank under the terms of international law.
Agricultural water abstraction has decreased in most OECD countries since 2005, confirming a trend observed since the early 2000s. This trend is particularly evident in countries where the irrigation sector is large relative to the agriculture sector. For some countries, the decrease is significant and often associated with deep policy reforms (e.g. in agriculture and water regulation) and the capacity of farmers to adapt to new climate and policy environments. The decrease in water use for irrigation explains most of the decreasing trends of agricultural water use in OECD countries.
As agriculture accounts for a large proportion of total water use, reductions in water abstraction contributed significantly to lowering total water abstraction in most OECD countries. These reductions have also contributed to the observed decrease in water stress in a majority of OECD countries, especially those with high initial levels of water stress.
A few OECD countries, such as Mexico and Turkey, continue to expand irrigation, contributing to increased water stress. When expansion of irrigation areas are coupled with more efficient irrigation techniques, water use efficiency improves. Nevertheless, the expansion of the irrigation sector may have led to the observed increase in water stress since 2005 in these countries.
Many OECD countries rely increasingly on ground rather than surface water for agriculture use, confirming a trend observed since the mid-1990s. Such reliance raises serious sustainability issues because in certain regions these withdrawals exceed the recharge rates, leading to a drop in water tables with potentially negative impacts on the environment and on the future resilience of such production systems. In addition, the environmental impact of groundwater irrigation is generally long lasting, if not irremediable.
Water application rates (e.g. quantity of irrigation water) have decreased in OECD countries having large irrigation sectors. This suggests significant gains in water use efficiency and changes in crop mixes towards less water-intensive crops.
The country focus on France, the United States and Turkey illustrates that the irrigation sector appears to adjust to evolving policy, market and climatic conditions.
In view of the projected increases in drought and flood risks, improving the monitoring of water and the availability and reliability of water statistics is necessary to formulate sound water management policies.
Water management is a major political issue in many countries and agriculture plays a fundamental role in this area. Population growth, urbanisation and rising demand for food will increase pressure on water resources. Yet the availability of water resources is increasingly at risk due to climate change, which in turn has resulted in a rising frequency of extreme water events such as droughts and floods. Agriculture is affected by these events because it relies heavily on water and, in most countries, constitutes the largest sector in terms of water use.
To tackle these challenges, management policy of water resources must address the trade-offs between economic, social, and environmental goals, using a combination of regulatory and economic incentives. All OECD countries have developed institutions and laws governing water access, allocation and pricing, as well as a set of policy strategies and instruments to address broad water management goals covering water resources, its quality, and ecosystems protection. In terms of the more specific objectives to manage water resources in agriculture, OECD countries largely share a common strategic vision to (OECD, 2010[1]):
“establish a long term plan for the sustainable management of water resources in agriculture taking into account climate change impacts, including protection from flood and drought risks;
contribute to raising agricultural incomes and achieving broader rural development goals;
protect ecosystems on agricultural land or those affected by farming activities;
balance agricultural water withdrawals with environmental needs, especially by maintaining minimum flow levels in rivers and lakes and ensuring sustainable use of groundwater resources (i.e. both shallow wells and deep aquifers); and
improve the efficiency of water resource withdrawal, management, technologies and ensure the financing to maintain and upgrade the infrastructure supplying water to farms (and other water consumers).”
Agricultural water resource management covers a wide range of agricultural systems and climatic conditions across OECD countries. In many countries, rain-fed agriculture dominates, but in areas susceptible to variable precipitation or having water deficits, irrigation is used to supplement periodic shortfalls. In arid areas, crop production may be largely dependent on irrigation.1 Irrigation water draws mainly on fresh surface water and groundwater, and to a lesser extent on recycled wastewater and desalinated water. The proportions by which these water sources are used vary across countries. Water resource management in agriculture also operates in a highly diverse set of political, cultural, legal and institutional contexts, encompassing a wide range of public policy domains: agriculture, water, environment, energy, fiscal, economic, social, and regional.
This section describes the trends in the main indicators related to water use in agriculture. Annex 4.A. describes the indicators used.
The degree of water stress, an indicator reflecting water resources availability, varies a great deal among OECD countries from very low (e.g. Canada, Latvia, New Zealand, Slovak Republic, Sweden) to high levels (e.g. Israel, Italy, Korea, Spain, Belgium), reflecting the diversity of conditions in terms of water withdrawals and resources in the OECD area (Figure 4.1). National water stress refers to the indicator intensity of freshwater use, which is measured as the ratio of total freshwater abstractions (all sectors included) to total renewable water resources in the country. A ratio below 10% is typically considered to be low water stress; moderate when between 10% and 20%; medium-high when between 20% and 40%; and high when above 40%.
The water stress indicator has trended slightly downwards in the majority of OECD countries since 2005 due to reductions in total water abstraction. Decreases in water stress are more notable for several countries with medium and high initial levels of water stress – Israel (7 percentage points), Korea (1 percentage points), Belgium (2 percentage points) (Figure 4.1) – and for countries with moderate water stress such as France and Germany (both 2 percentage points). However, water stress increased in some OECD countries facing medium water stress levels such as Turkey (from 19% in 2005 to 22% in 2013), Mexico (from 16% to 18%), and the United States (from 19% to 20%). The OECD average shows stable to slightly increasing water stress, due to the importance of the latter countries in total water abstraction.
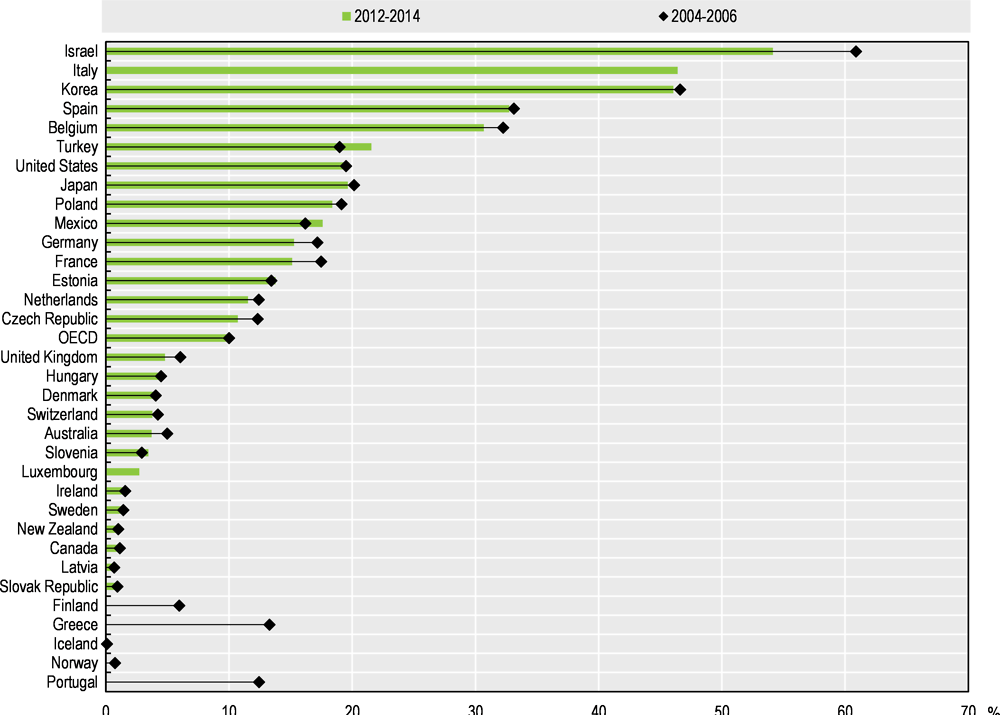
Notes: The intensity of use of freshwater resources (or water stress) refers to gross abstractions of freshwater taken from ground or surface waters expressed as a percentage of total available renewable freshwater resources (including water inflows from neighbouring countries). For some countries, when data for 2004-06 and 2012-14 were not available, closest available data were used.
Sources: (OECD, 2016[2]; OECD, 2016[3]).
Agriculture significantly contributes to national water stress in several OECD countries, particularly those with a relatively large irrigated sector (Figure 4.2). The relatively large weight of agriculture on water stress in OECD countries reflects the important contribution of agriculture on total water abstraction and the role of the irrigation sector. Interestingly, the weight of agriculture in water stress tends to be high in countries having high levels of water stress (e.g. Israel, Italy,2 Korea, Spain, Turkey, Japan, and Mexico).
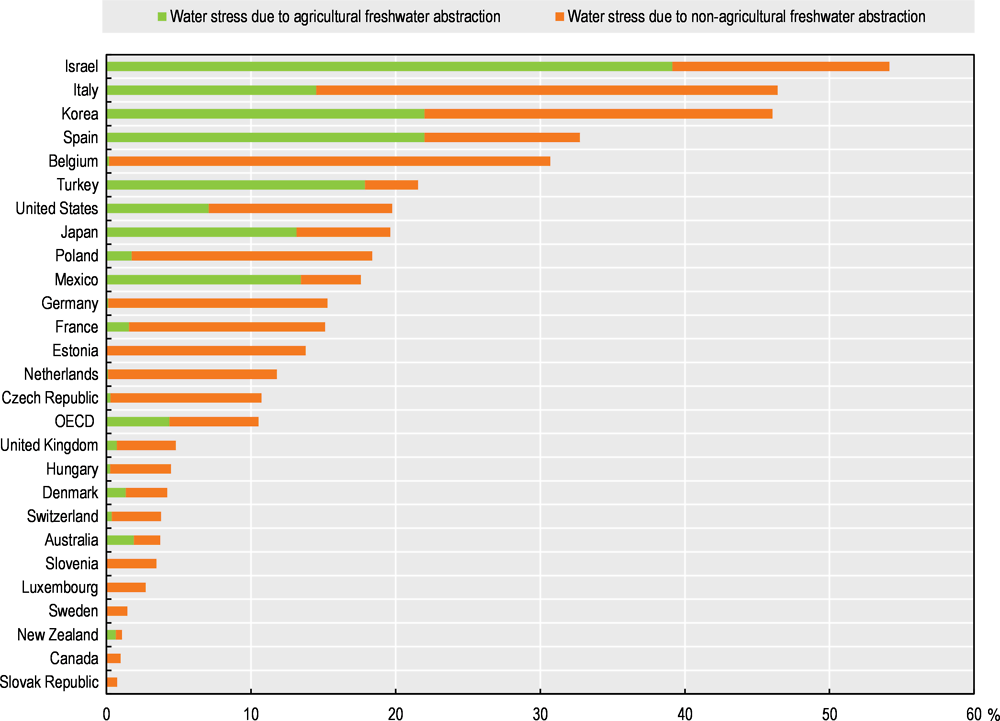
Notes: The intensity of use of freshwater resources (or water stress) refers to gross abstractions of freshwater taken from ground or surface waters expressed as a percentage of total available renewable freshwater resources (including water inflows from neighbouring countries). For some countries where data for 2004-06 and 2012-14 were not available, closest available data were used.
Sources: (OECD, 2016[2]; OECD, 2016[3]).
Since 2005, agricultural water abstraction has declined in about two-thirds of OECD countries, and agricultural water abstraction in the OECD area declined by 0.4% annually (Figure 4.3). The stronger declines are observed in Australia (-9.4%), France (-7.8%), United Kingdom (-5.4%), United States (-1.9%), and Greece (-1.4%). By contrast, agricultural water abstraction increased by about 1% or more in New Zealand, Turkey and Mexico, while countries such as Germany and the Czech Republic had large increases, 13.6% and 8.5%, respectively. Overall, reductions of agricultural water use contributed to reduce water stress; agriculture freshwater abstractions accounted for 42% of total freshwater abstractions in the OECD area in 2012-14, against 43% in 2004-06.
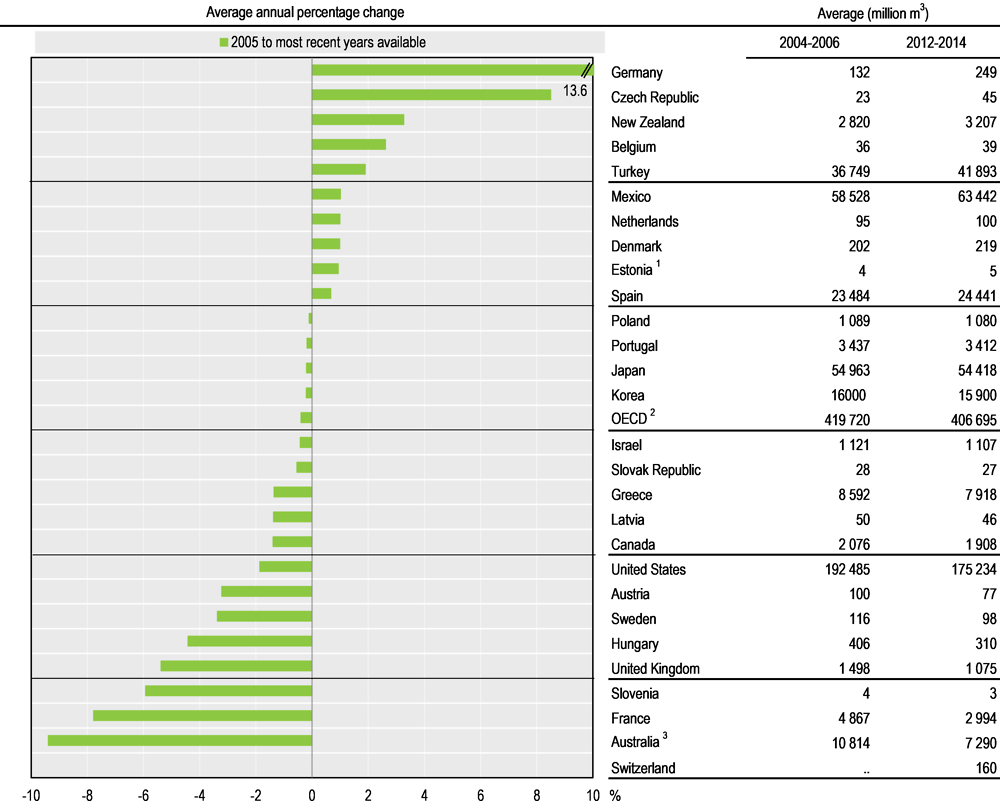
1. For Estonia, data represent water use in agriculture.
2. The OECD total does not include Switzerland in the average annual percentage change.
3. For Australia, 2004-06 is replaced by 2005-06 and 2012-14 by 2009-11.
Sources: (OECD, 2016[2]; OECD, 2016[3]).
While agricultural water use is decreasing, the share of agricultural water abstraction from groundwater continues to increase in several OECD countries (Figure 4.4), particularly in France, Germany, Greece, and the Netherlands. In many areas, recharge rates of groundwater resources are lower than abstraction rates, endangering the sustainability of this resource in the medium and long run. In addition, irrigation not only impacts the availability of water via withdrawals, but can also affect water quality (e.g. salinisation and land subsidence). The sustainability of water use is a particularly significant issue in the case of fossil aquifers, which are not renewable.

This increasing pressure on groundwater resources is due primarily to the scarcity and instability of surface water resources. In the longer term, factors such as higher food demand due to demographic and income growth, as well as a higher occurrence of extreme weather events propelled by climate change are likely to put more pressure on this resource, which in turn would affect the future resilience of agriculture to respond to water-supply shortfalls. This problem is accentuated in several countries due to the relative weakness of groundwater regulations; groundwater is also more difficult to measure and monitor in practice than surface water. As indicated in OECD (2015[4]), better groundwater management policy combining regulatory instruments and economic and collective action is needed to overcome water stress challenges in agriculture.
Agricultural water abstraction is decreasing due to a decline in irrigated land area, improvements in water use efficiency, and changes in crop mixes
Trends in agricultural water abstraction have several possible causes and reflect different phenomena among OECD countries. Before considering the more fundamental drivers of change (e.g. commodity prices, agricultural policies, environmental regulations, and climate change), an intermediate but necessary first step is to break down the changes in agricultural water abstraction into main drivers. In practice, changes in agricultural water abstraction are the result of a combination of factors such as: i) changes in irrigated areas; ii) changes in crop mix with different water needs; iii) variation of meteorological factors; iv) improvements in water use efficiency; and v) availability, state and management of water storage resources, including changes in water abstraction charges (Box 4.1).
Breaking down the changes in agricultural water abstraction is useful for policy analysis and guidance, but lack of data continues to be a concern for policy assessment. For example, a reduction in agricultural water use in a given country can be due to either improvement of water use efficiency (through modernised irrigation techniques) or to a change in the crop mix, or a combination of the two. These very different situations would need different responses from policy makers.
Size effect: Ceteris paribus, trends in agricultural water abstractions can reflect changes in the size of either the agricultural or irrigation sector (irrigated land areas).
Composition effect: Ceteris paribus, variations can be due to changes in the relative shares of agricultural activities or crops that differ in their water needs. For example, substituting irrigated agriculture by livestock farming can lead to a reduction in total agricultural water abstraction. Changes in the crop mix can also affect agricultural water abstraction due to different crop water needs (e.g. corn is usually more water demanding than beans).
Meteorological effect: Depending on the country context, irrigation water abstractions can be complementary to net precipitation; in these cases irrigation water abstractions are generally negatively correlated with net precipitation. More precipitation can reduce both water use per hectare within the growing season and the area devoted to irrigation. In arid regions, irrigation is the major source of water for crop needs, and so less likely to vary negatively with net precipitation.
Water use efficiency effect: Improvements in water use efficiency due to, for example, upgrades of irrigation material (reducing water leakages) or better management through more advanced use of weather information systems can explain some variations in agricultural water abstraction.
Water resource effect: Accessibility of water resources via wells, dams and other forms of water infrastructure play a critical role in farmers’ decision to irrigate. This effect relates to meteorological conditions, since water resources typically depend on cumulative precipitation over a certain period of time (e.g. recharge of dams during the winter season), but also on the water storage infrastructure and its management.
Irrigation is a driving force of agricultural water use in most OECD countries, accounting for more than 60% of agricultural water use in most OECD countries, and over 90% in countries such as France, Israel, Mexico, Spain, Turkey, and the United States (Figure 4.5). In countries with less or no irrigation, agriculture water abstraction is mainly used for livestock. Irrigation intensity (ratio of irrigated area to cropping area) is typically high in southern Europe, but also in countries such as the United Kingdom, Denmark, and the Netherlands (BIO Intelligence Service, 2012[5]).
Trends in agricultural water abstraction closely follow those of irrigation water use, implying that irrigation plays an important role in OECD countries in sustainable water resource management. Where there is a large irrigation sector, irrigation water use dictates the overall trend. However, even in countries with relatively small irrigation sectors, irrigation water abstraction tends to decrease in conjunction with other forms of agricultural water uses (e.g. livestock) and closely follow the same trends. This indicates that water use in the livestock sector has experienced significant reductions.
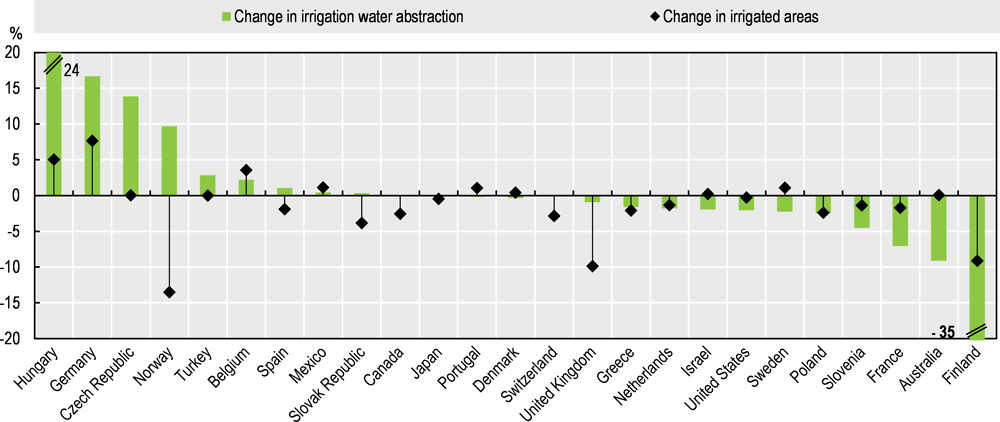
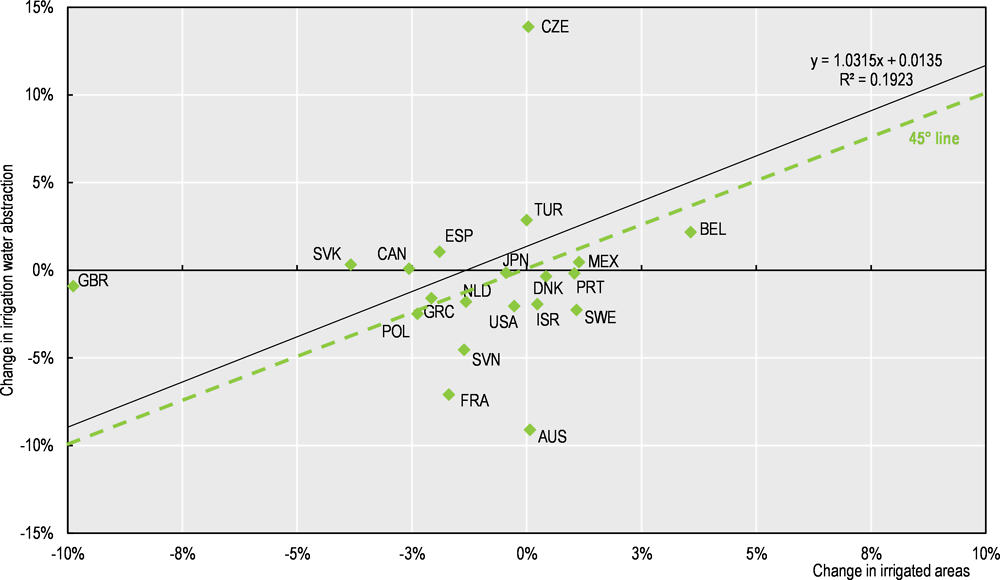
Changes in irrigation water abstraction generally follow the same direction as changes in irrigated areas, although not proportionally (Figure 4.6). Changes in irrigated areas explain about 20% of changes in irrigation water withdrawals (Annex Figure 4.B.1). In some OECD countries – such as Australia, France, Israel and the United States3 – use of irrigation water decreased faster than irrigated areas, indicating significant decreases in water application rates (i.e. the national average quantity of irrigation water applied per hectare of agricultural land). In countries with an expanding irrigation sector, such as Mexico and Turkey, use of irrigation water is increasing, although more or less rapidly than changes in irrigated areas.
These contrasting trends of water application rates in OECD countries suggest very different water use efficiency landscapes. Even in countries where irrigation is expanding, it seems that water use efficiency remains relatively stable. However, water data (volumes and surfaces) are subject to considerable fluctuations, particularly when related to weather. In the absence of additional elements, it is not possible to further disentangle the relative role of technical progress (increased application efficiency and improved water productivity) from adaptation strategies, such as changing the crop mix.
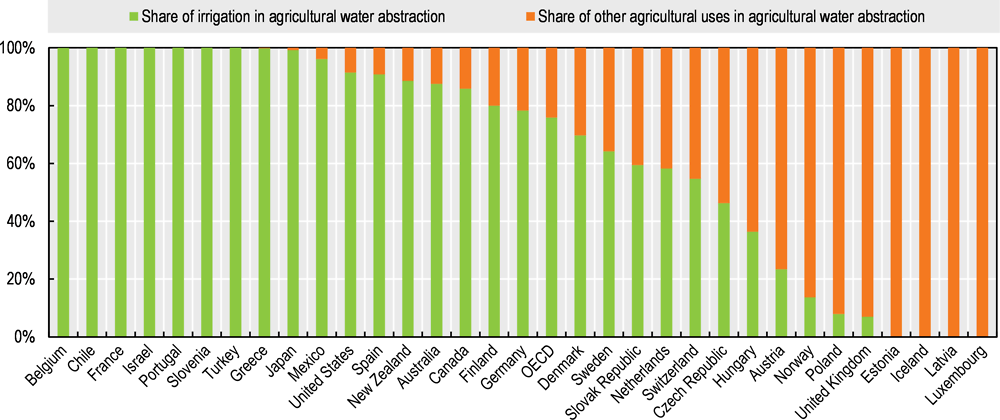
Sources: (OECD, 2016[2]; OECD, 2016[3])
Sources: (OECD, 2016[2]; OECD, 2016[3]).
What drives changes in agricultural water use?
Decoupling agriculture support policies from production decisions and water policy reforms has played an important role, but market drivers are increasing in importance.
Fundamental drivers of changes in agricultural water use include changes in global agricultural markets (e.g. relative prices) and policy drivers (e.g. farm support), but also water regulations including water allocation regimes, water pricing and institutional settings (e.g. governance). Changes in the relative prices of agricultural commodities can lead farmers to change their farming activities (e.g. relative shares of crops and livestock; crop mix). By providing farmers signals of water scarcity, water policies can also motivate them to reconsider their decisions regarding their water use, choice of irrigated areas and freshwater abstraction in the short run, investment decisions in irrigable areas, and equipment modernisation in the long run.
Regarding agricultural policy, the general trend in favour of reduced and decoupled farm support is seen as a positive factor for the proper allocation of resources, including water resources. Prices artificially inflated through government support tend to encourage additional production, and therefore the expansion of irrigation in both area and volume. In several countries, other barriers can limit the influence of decoupling and market prices. Essentially, irrigation requires large-scale investment and specialisation, and can sometimes involve expensive collective hydraulic works that will be recovered only over a long period of time. This may be a source of inertia and limit the extent of agricultural policy reforms.
Several OECD countries have implemented major policy reforms to foster a more efficient and sustainable use of water by agriculture. This is the case of Australia, well known for its water market system. More recently, France has decentralised the management of water rights to local collective management organisms (Unique Organisation of Collective Management), in an effort to improve the efficiency and sharing of water. In Italy, the Italian Association of Local Agencies for the Management of Irrigation Water (ANBI) has developed a web-based irrigation advisory service named “Irriframe” which provides water users with information to improve the efficiency of water use.4 More generally, over the last ten years the European Union has focused increasingly on the problem of water scarcity, as well as the challenge to integrate water concerns into agricultural policies.
Several challenges remain, however. Agricultural water pricing in the late 2000s remained well below its full cost,5 and even below operational and maintenance cost recovery in the majority of OECD countries. In some cases, irrigation continues to enjoy substantial public support for, by example, building new hydrological infrastructures. Regulatory approaches are important but not sufficient to provide incentives to use water more efficiently. A growing concern is the lack of efficient groundwater regulations in several OECD countries.
Focus on selected OECD countries
France: Structural changes in the irrigation sector contributed to reducing the use of water in the agricultural sector
France ranks high among OECD countries in terms of reducing irrigation water abstraction over the last decade, with an average annual reduction of about 8%, which was partly due to a decrease in both irrigated areas and water application rates. It is therefore relevant to look at the mechanisms behind these changes.
Weather conditions played a significant role in the decline of irrigation water abstraction. Over the past decade, the national average of rainfall has been relatively higher than usual. Considering that irrigation in France is related to rainfall levels (Commissariat Général au Développement Durable, 2012[6]), higher precipitation may explain in part the decrease in water abstraction. This weather effect may have been more or less pronounced across regions due to different meteorological conditions.
The crop mix in the irrigation sector has evolved significantly. Fifteen years ago, irrigated corn largely dominated other types of irrigated crops, but this area decreased by 17%, from 780 923 ha in 2000 to 645 995 ha in 2010 (Loubier, Campardon and Morardet, 2013[7]). France also witnessed during this period, although to a lesser extent, a reduction in irrigated forages, permanent pastures, potatoes, and protein crops. At the same time, irrigated areas of cereals (wheat, rice, sorghum), notably spring cereals, expanded considerably from 96 351 ha in 2000 to 273 298 ha in 2010 (Loubier, Campardon and Morardet, 2013[7]) (Figure 4.7).
Such important changes in irrigated crop mix have likely contributed to reducing agricultural water abstraction. Indeed, corn typically consumes more water per hectare than other cereals on average, and irrigation of spring cereals comes at a time when rainfall is more abundant and soil moisture is significant. Hence, irrigation essentially complements water needs when net precipitation is not sufficient.
Several drivers simultaneously pushed this change in the irrigated sector in the same direction: reform of the Common Agricultural Policy (CAP), market prices, and environmental regulations. The important switch from corn to spring cereals is probably due to the evolution of the relative prices of corn and other cereals, which have declined for corn since 2005. The CAP reform reduced distortive forms of support that incentivised irrigated maize production. In addition to these market and policy drivers, more frequent water restrictions by water management authorities have probably incited farmers to switch to spring cereals, as these are irrigated during a time period which is less prone to water restrictions imposed by French authorities.
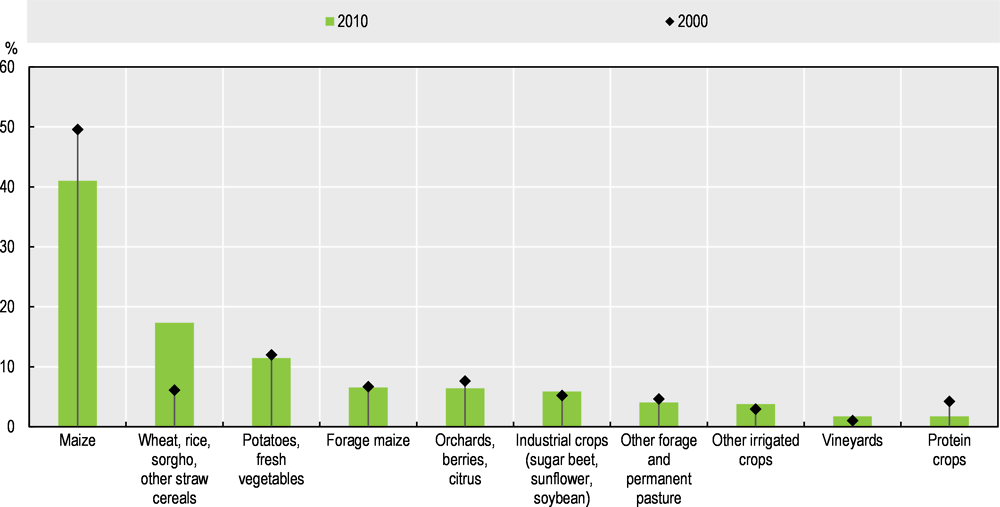
Source: (Loubier, Campardon and Morardet, 2013[7]).
United States: Water use efficiency has improved rapidly, but water scarcity, droughts, groundwater, and competing water use remain significant challenges
In the United States, irrigated farms account for almost 40% of the value of US agricultural production (Schaible and Aillery, 2012[8]). Although irrigation is concentrated in a limited number of states, mainly in the western part of the United States (Nebraska, California, Texas, Idaho, and Colorado), it also plays a large role in several eastern and southern states (Arkansas and Florida). The main irrigated crops include corn (for grain), forage, wheat, rice, and cotton (Schaible and Aillery, 2012[8]). Water rights play a major role in regulating the use of water in the country.
At the national level, water stress has changed little due to the relative stabilisation of total water withdrawals. However, a series of droughts in recent years has highlighted water scarcity issues and the vulnerability of certain agricultural systems to extreme weather events. In California, the reduced availability of groundwater resources during a multiyear drought triggered a major reform (OECD, 2017[9]).
Over the last 20 years, the United States has significantly modernised its irrigation equipment, resulting in increased water use efficiency. Indeed, in the Western United States, the share of irrigated areas using efficient sprinkler and drip or trickle equipment almost doubled between 1994 and 2008, while the area using less efficient irrigation technologies decreased (Figure 4.8).
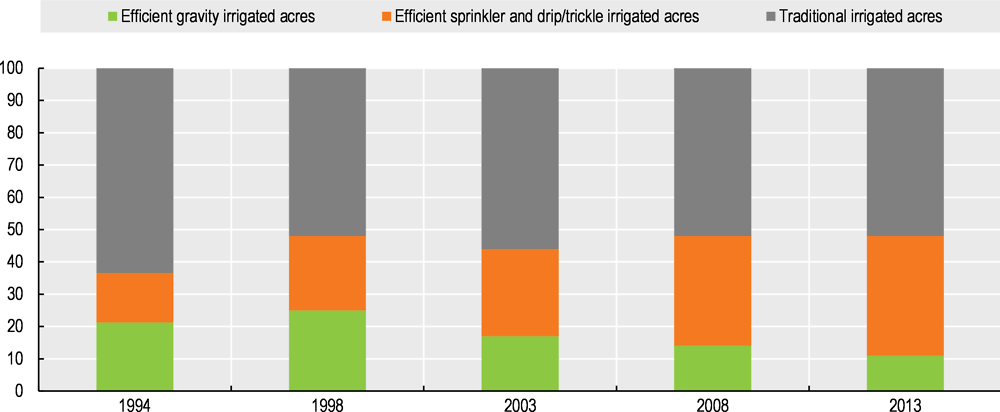
Source: (Schaible and Aillery, 2012[8]).
Investment in irrigation technologies, as well as more frequent extreme weather events such as droughts are the driving forces to greater water use efficiency. Investment in irrigation infrastructure is growing strongly: from USD 2.15 billion in 2008 to USD 2.64 billion in 2013, an increase of 22%. This could also induce additional gains in water use efficiency in the future (Schaible and Aillery, 2012[8]). Several support programmes have played a role in increasing this investment, particularly the Environmental Quality Incentives Program (EQIP). However, although government support can have a leveraging effect, the share of private investment remains dominant (Schaible and Aillery, 2012[8]). Recent droughts may have encouraged farmers to revise their beliefs on the possibility of facing water shortages and prompted tighter legislation on water allocation in some states. These factors could contribute to accelerating the uptake of more efficient irrigation technologies, while avoiding the “rebound effect”6 that can arise with more efficient water use.
Turkey: Expanding irrigated areas and improving irrigation water use efficiency
Irrigation is an important part of the agricultural sector in Turkey, both historically and economically. Water stress has been increasing (Figure 4.1) due mainly to an increase in water abstraction for agriculture and a proactive policy objective to expand irrigated areas. Climate change is likely to increase further water stress, especially in the southern provinces. Irrigation is at the crossroads of productivity and sustainability issues in Turkey. On the one hand, it is estimated that irrigation could significantly increase yields in areas where it is expanding, but on the other, increased water stress, climate change and increasing competition between industrial and urban uses constitute rising risks for sustainable water allocation (Cakmak, 2010[10]; Özerol and Bressers, 2015[11]; Sen, 2013[12]).
The expansion of irrigated areas is likely to increase pressure on water resources, but there are initiatives to improve and modernise water management. Reforms to decentralise water management from the central administration to local irrigation users have had positive, though limited, impact in improving water management. The uptake of more efficient irrigation techniques has also accelerated over the last decade (OECD, 2015[4]).
However, incentives related to agricultural policies might partly offset these water policy improvements. Turkey uses the most distorting form of support to the agricultural sector. In the period 2013-15, market price support and payments based on outputs and inputs represented 88% of the producer support estimate in the country.7 The interaction between these various drivers of change will determine the county’s path towards sustainable agricultural water management (OECD, 2016[13]).
Better information is necessary to confront future water challenges. Agriculture in many countries is expected to face more variable surface water supplies, and there will be an increasing demand for water from other sectors (OECD, 2017[9]). Analysing trends in water use and irrigation requires harmonised data that are sufficiently extended in time to disentangle long-term from short-term changes. There are, however, significant data gaps in OECD countries regarding water resources. Improving the quality and coverage of the dataset, as well as expanding data sources will be important to improve the usefulness of indicators in terms of policy diagnosis and policy guidance. Several recent and on-going initiatives have been undertaken to develop water use indicators. Methodological developments (e.g. modelling, composite indicators) could also be worth exploring. The need to ensure consistency over time is critical to analysing medium- and long-term trends.
Developing water balances could improve our understanding of water scarcity problems and the tailoring of policy remedies. The water stress indicator has limitations and it would be valuable to improve the measurement of water resource pressures through, for example, a better understanding of the drivers of change in surface and groundwater abstractions and water supply stocks, improving the measurement of water volumes, having basin-scale measurements, and improving consistency across reporting measures by countries. A way to move forward would be to develop water balance accounts, i.e. a comprehensive and consistent account of water stocks and flows in a given water system. The European Commission is attempting to achieve this through its recently released Guidance Document on the application of water balances for supporting the implementation of the Water Framework Directive. Progress in this area could help disentangle policy, market and environmental drivers of change to improve policy guidance for sustainable water management.
Regionalised and geo-localised water data could also be useful for policy makers. Appropriate spatial scale is an important issue for sound analysis of water resources and uses. National averages provide interesting insights about the state and trends of water use in agriculture, but situations vary a great deal across regions and watersheds. Efforts to regionalise water statistics, such as the ones undertaken by Eurostat, could help refine policy analysis and help to better respond to critical water risks (OECD, 2017[9]). For example, the Italian Ministry of Agriculture has a reference WebGIS database for the irrigation sector (National Information System for Water Management in Agriculture – SIGRIAN) that is used to address water management policies.
Big data and satellite images could help to improve water management and monitoring. In recent years there has been an impressive surge in the development and adoption of the last wave of New Technologies of Information and Communication (NTIC) in numerous economic sectors, and agriculture is projected to be an important market in this regard (Kooistra, Van der Wal and Poppe, 2015[14]). The use of big data in agriculture could play an important role in reducing yield gaps (the difference between actual and potential yields), improve environmental performances and the monitoring of water use.
References
[20] Amigues, J. et al. (2006), Sécheresse et agriculture : Réduire la vulnérabilité de l’agriculture à un risque accru de manque d’eau, Expertise scientifique collective, Rapport, INRA (France), http://inra.dam.front.pad.wedia-group.com/ressources/afile/234277-0c2de-resource-expertise-secheresse-sommaire.html.
[5] BIO Intelligence Service (2012), Water Saving Potential in Agriculture in Europe: Findings from the Existing Studies and Application to Case Studies, European Commission DG Env, https://ec.europa.eu/environment/water/quantity/pdf/BIO_Water%20savings%20in%20agiculture_Final%20report.pdf.
[10] Cakmak, E. (2010), Agricultural Water Pricing: Turkey, OECD Publishing, Paris, https://doi.org/10.1787/787034266022.
[6] Commissariat Général au Développement Durable (2012), “Les prélèvements d’eau en France en 2009 et leurs évolutions depuis dix ans”, Observation et statistiques 290, https://www.eaufrance.fr/sites/default/files/2018-06/prelevements_2009_201202.pdf.
[16] Kenny, J. et al. (2009), “Estimated Use of Water in the United States in 2005”, U.S. Geological Survey Circular, Vol. 1344, p. 52, https://pubs.usgs.gov/circ/1344/.
[14] Kooistra, L., T. Van der Wal and K. Poppe (2015), “The Role of New Data Sources in Greening Growth: The Case of Drones”, OECD Green Growth and Sustainable Development Forum Session 3, https://issuu.com/oecd.publishing/docs/ggsd_2015_issuepaper3_final.
[7] Loubier, S., M. Campardon and S. Morardet (2013), “L’irrigation diminue-t-elle en France ? Premiers enseignements du recensement agricole de 2010”, Sciences, Eaux et Territoires, Vol. 2/11, https://www.cairn.info/revue-sciences-eaux-et-territoires-2013-2-page-12.htm#.
[21] Mekonnen, M. and A. Hoekstra (2016), “Four Billion People Facing Severe Water Scarcity”, Science Advances, Vol. 2/2, https://advances.sciencemag.org/content/2/2/e1500323.
[9] OECD (2017), Water Risk Hotspots for Agriculture, OECD Studies on Water, OECD Publishing, Paris, https://dx.doi.org/10.1787/9789264279551-en.
[2] OECD (2016), “Environment Statistics: Water”, OECD Agriculture Statistics, https://doi.org/10.1787/agr-data-en.
[3] OECD (2016), “Environmental Performance of Agriculture”, OECD Agriculture Statistics (database), https://doi.org/10.1787/data-00660-en.
[13] OECD (2016), Innovation, Agricultural Productivity and Sustainability in Turkey, OECD Food and Agricultural Reviews, OECD Publishing, Paris, https://dx.doi.org/10.1787/9789264261198-en.
[4] OECD (2015), Drying Wells, Rising Stakes: Towards Sustainable Agricultural Groundwater Use, OECD Studies on Water, OECD Publishing, Paris, https://dx.doi.org/10.1787/9789264238701-en.
[18] OECD (2013), OECD Compendium of Agri-environmental Indicators, OECD Publishing, Paris, https://dx.doi.org/10.1787/9789264186217-en.
[19] OECD (2010), OECD Review of Agricultural Policies: Israel 2010, OECD Review of Agricultural Policies, OECD Publishing, Paris, https://dx.doi.org/10.1787/9789264079397-en.
[1] OECD (2010), Sustainable Management of Water Resources in Agriculture, OECD Studies on Water, OECD Publishing, Paris, https://dx.doi.org/10.1787/9789264083578-en.
[15] OECD (2008), Environmental Performance of Agriculture in OECD Countries Since 1990, OECD Publishing, Paris, https://dx.doi.org/10.1787/9789264040854-en.
[11] Özerol, G. and H. Bressers (2015), “Scalar alignment and sustainable water governance: The case of irrigated agriculture in Turkey”, Enviromental Science and Policy, Vol. 45, pp. 1-10.
[17] Rijsberman, F. (2006), “Water scarcity: Fact or fiction?”, Agricultural Water Management, Vol. 80/1-3, pp. 5-22, https://doi.org/10.1016/j.agwat.2005.07.001.
[8] Schaible, G. and M. Aillery (2012), “Water Conservation in Irrigated Agriculture: Trends and Challenges in the Face of Emerging Demands”, Economic Information Bulletin, Vol. No. (EIB-99), p. 67, https://www.ers.usda.gov/publications/pub-details/?pubid=44699.
[12] Sen, Ö. (2013), A Holistic View of Climate Change and its Impact in Turkey, Sabanci University, https://ipc.sabanciuniv.edu/wp-content/uploads/2012/11/A-Holistic-View-of-Climate-Change-and-Its-Impacts-in-Turkey.pdf.
The indicators used in this Chapter are the following:
Agricultural water withdrawals: groundwater, surface water, and total (million m3)
Irrigation water withdrawals: groundwater, surface water, and total (million m3)
Water stress, defined as the ratio of total freshwater abstractions (all sectors included) to total renewable water resources in the country (%)
The term “agricultural water abstraction” as used here refers to irrigation and other agricultural abstractions (e.g. for livestock) from rivers, lakes, reservoirs and groundwater (shallow wells and deep aquifers), but excludes precipitation directly onto agricultural land. “Water abstraction” is different from “water consumption” in that the latter refers to water depleted and not available for re-use.8
For most countries, irrigation freshwater abstraction usually includes water that is applied by an irrigation system to sustain plant growth, including arable, horticultural crops and pasture. Irrigation also includes water that is applied for other beneficial uses — pre-irrigation, frost protection, application of chemicals, weed control, field preparation, crop cooling, harvesting, dust suppression, leaching salts from the root zone — as well as water lost in conveyance (OECD, 2008[15]; Kenny et al., 2009[16]). For some countries, irrigation may cover golf courses, parks, and other non-agricultural uses, and include self-supplied withdrawals and deliveries from private or government companies, districts, and co-operatives.
The indicators related to agriculture water use and irrigation have several limitations which need to be taken into account when examining absolute levels, trends, and comparing countries. The main limitations are: i) cross-country methodological variations in terms of data collection and estimation; ii) cross-country differences in scope (e.g. inclusion of recycled wastewater or not); iii) challenges in monitoring water abstraction, especially for groundwater; and iv) incomplete series of data.
The indicator of water stress is defined as the ratio of total freshwater abstractions (all sectors included) to total renewable water resources in the country. While the indicator is widely used to monitor water resources pressures it has limitations since it does not consider how much water is actually used and not returned to the environment (Rijsberman, 2006[17]). Hence, it may be an imperfect indicator of water scarcity. For this analysis, OECD developed a water stress indicator by combining OECD agri-environmental indicators on water withdrawals by agriculture and estimated renewable freshwater resources from the OECD environmental indicators.
It is important to note that national water indicators may be less meaningful in the case of large countries characterised by a high diversity of climatic zones, hydrologic regimes, and water demands. A country-scale indicator may mask serious water-stress conditions at the basin-level scale.9
In this chapter, the trends for the indicators are calculated for the periods 2004-06 to 2012-14. This is to smooth out year-to-year variations. Where needed, other approaches are used to observe the trends in order to ensure a sound interpretation of data. Water withdrawals data vary widely due to meteorological conditions, so trends should be interpreted with caution. When data were not available for 2004-06 or 2012-14, the closest available data were used.
Methods to collect and calculate the data vary across and within countries, and are subject to measurement errors. Sources of data for irrigation include sample surveys of irrigators, and are sometimes estimated using information on irrigated crop acreages along with specific crop water-consumption coefficients or irrigation-system application rates. In other cases, irrigation water withdrawal data may reflect water allocations, which may differ substantially from actual withdrawals depending on annual climatic conditions. These estimates may or may not include adjustments for climatic variables, system efficiencies, conveyance losses, and other irrigation practices such as pre-irrigation (Kenny et al., 2009[16]). The reliability of surveys is also subject to sampling errors, because not all farms are included in the surveys. In many cases, water withdrawals and water used are not closely metered, and farmers may not know themselves precisely how much irrigation water they withdraw.
Data coverage can vary between countries. It is assumed in this chapter that water withdrawals are only from freshwater sources – although recycled wastewater and desalinated water is also used by agriculture in some regions – despite comprising a relatively small proportion of total agriculture withdrawals. For example, saline water use in the United States represented 15% of total water withdrawals in 2005, but nearly all of this was used by the power sector (Kenny et al., 2009[16]). Israel is a notable exception; in 2008, 54% of water resources allocated to agriculture derived from recycled effluent and desalinated water in 2008 (OECD, 2015[4]).
There are practical difficulties in accurately measuring agricultural water withdrawals, especially for groundwater. Groundwater withdrawals on farms, either from shallow wells or deep aquifers, can be difficult to monitor since in most cases groundwater withdrawals are not metered.
Most OECD countries have incomplete series of data for total and agricultural water abstraction and irrigated and irrigable areas (see https://stats.oecd.org/BrandedView.aspx?oecd_bv_id=env-data-en&doi=data-00602-en). In part, this is because these data are usually not calculated annually but obtained from surveys conducted every five or even ten years
Source: (OECD, 2013[18]).
Sources: (OECD, 2016[2]; OECD, 2016[3]).
Notes
← 1. In the case of France, for example, Amigues et al. (2006[20]) distinguish four irrigation categories: necessary input for production; yield securing in case of drought; yield smoothing over time; and ensuring the quality of crop production.
← 2. In several countries, a significant share of agricultural water abstraction is returned to the natural water system (surface and groundwater) as “return flows”. This is the case, for example, of the Po Valley in northern Italy.
← 3. While the decrease in water application rates observed in the United States is mainly due to improved efficiency and shifts in crop patterns, it should be noted that this trend reflects a shift in regional acreage, with generally less irrigable land in the arid West and acreage expansion in the more humid Eastern states, with lower water application rates.
← 4. After four years of activity, Irriframe covers most of the Italian irrigable areas (more than 7 million ha).
← 5. The full cost recovery of water includes operating and maintenance and investment costs (capital costs), as well as the cost of water scarcity and externalities (water pollution).
← 6. The rebound effect is an economic mechanism initially described by William S. Jevons. It provides that an increase in the efficiency of the use of a resource — through technological progress — could increase the consumption of this resource, rather than decrease it. For example, increasing water use efficiency could increase crop yields, incentivising farmers to use more water by expanding irrigated areas.
← 7. Since August 2017, the Turkish government no longer provides market price support to maize in sub-provinces experiencing groundwater deficiency or water scarcity, with the exception of drip irrigated maize. Investment in drip irrigation systems receive support.
← 8. Water abstraction in Canada provides an illustrative example of the application of these terms, where it is estimated that 70-80% of the water withdrawn is consumed (OECD, 2010[1]).
← 9. Having water data and measuring water stress at the basin-level and aggregating at the national level would constitute an improvement. However, this would require common methodologies for the aggregation phase to ensure comparability across countries.