copy the linklink copied!Self-rated health
How individuals assess their own health provides a holistic overview of both physical and mental health. By adding such a perspective on quality of life, it complements life expectancy and mortality indicators that only measure survival. Further, despite its subjective nature, self-rated health has proved to be a good predictor of future health care needs and mortality (Palladino et al., 2016[1]).
Most OECD countries conduct regular health surveys that include asking respondents how, in general, they would rate their health. For international comparisons, socio-cultural differences across countries may complicate cross-country comparisons of self-assessed health. Differences in the formulation of survey questions, notably in the survey scale, can also affect comparability of responses. Finally, since older people generally report poorer health and more chronic diseases than younger people do, countries with a larger proportion of elderly people are likely to have a lower proportion of people reporting that they are in good health.
With these limitations in mind, almost 9% of adults consider themselves to be in poor health, on average across OECD countries (Figure 3.23). This ranges from over 15% in Korea, Lithuania, Latvia and Portugal to under 4% in New Zealand, the United States, Canada, Ireland and Australia. However, the response categories used in OECD countries outside Europe and Asia are asymmetrical on the positive side, which introduces a comparative bias to a more positive self-assessment of health (see the box on “Definition and comparability”). Korea, Japan and Portugal stand out as countries with high life expectancy, but relatively poor self-rated health.
People with lower incomes are generally less positive about their health than people on higher incomes, in all OECD countries (Figure 3.24). Almost 80% of adults in the highest income quintile rate their health as good or very good, compared with just under 60% of adults in the lowest income quintile, on average across the OECD. Socio-economic disparities are particularly marked in Latvia, Estonia, the Czech Republic and Lithuania, with a percentage point gap of 40 or more between adults on low and high incomes. Differences in smoking, harmful alcohol use and other risk factors are likely to explain much of this disparity in these countries. Socio-economic disparities are relatively low in New Zealand, Greece, Italy, Australia and France, at less than 10 percentage points.
Self-rated health tends to decline with age. In many countries, there is a particularly marked decline in how people rate their health when they reach their mid-forties, with a further decline after reaching retirement age. Men are also more likely than women to rate their health as good.
Self-rated health reflects an individual’s overall perception of his or her health. Survey respondents are typically asked a question such as: “How is your health in general?”. Caution is required in making cross-country comparisons of self-rated health for at least three reasons. First, self-rated health is subjective, and responses may be systematically different across and within countries because of socio-cultural differences. Second, as self-rated health generally worsens with age, countries with a greater share of older people are likely to have fewer people reporting that they are in good health. Third, there are variations in the question and answer categories used in survey questions across countries. In particular, the response scale used in the United States, Canada, New Zealand, Australia and Chile is asymmetrical (skewed on the positive side), including the response categories: “excellent, very good, good, fair, poor”. In most other OECD countries, the response scale is symmetrical, with response categories: “very good, good, fair, poor, very poor”. This difference in response categories may introduce a comparative bias to a more positive self-assessment of health in those countries that use an asymmetrical scale.
Self-rated health by income level is reported for the first quintile (lowest 20% of income group) and the fifth quintile (highest 20%). Depending on the surveys, the income may relate to either the individual or the household (in which case the income is equivalised to take into account the number of people in the household).
References
[2] Lumsdaine, R. and A. Exterkate (2013), “How survey design affects self-assessed health responses in the survey of health, ageing and retirement in Europe”, European Economic Review, Vol. 63, pp. 299-307.
[1] Palladino, R. et al. (2016), “Associations between multimorbidity, healthcare utilisation and health status: evidence from 16 European countries”, Age and Ageing, Vol. 45, pp. 431-435.
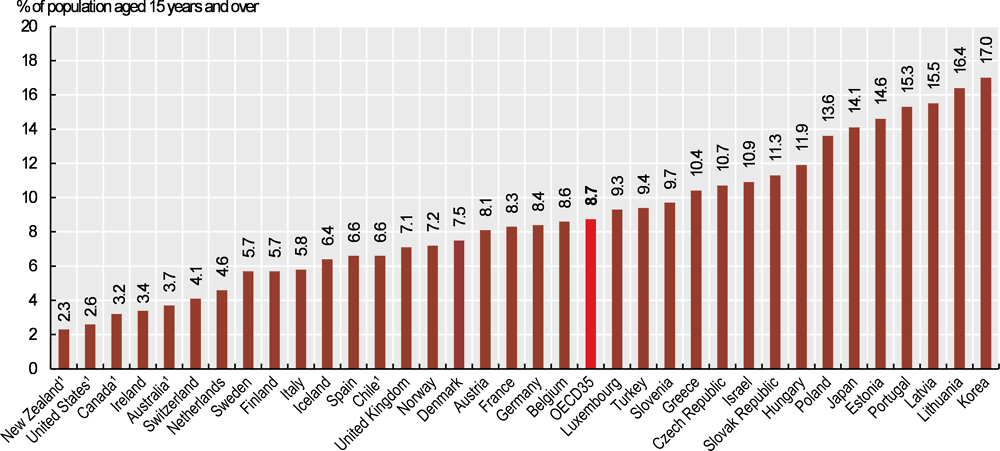
1. Results for these countries are not directly comparable with those for other countries, due to methodological differences in the survey questionnaire resulting in a bias towards a more positive self-assessment of health.
Source: OECD Health Statistics 2019 (EU-SILC for European countries).
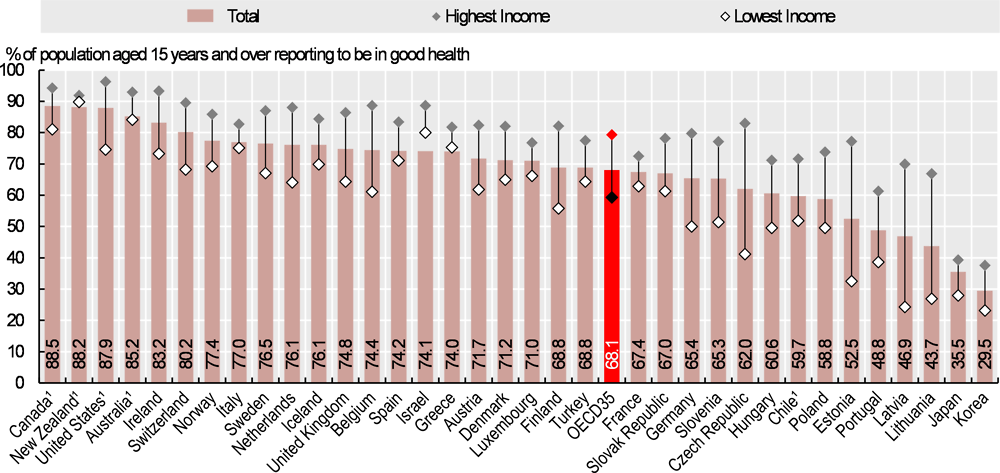
1. Results for these countries are not directly comparable with those for other countries, due to methodological differences in the survey questionnaire resulting in a bias towards a more positive self-assessment of health.
Source: OECD Health Statistics 2019 (EU-SILC for European countries).
Metadata, Legal and Rights
https://doi.org/10.1787/4dd50c09-en
© OECD 2019
The use of this work, whether digital or print, is governed by the Terms and Conditions to be found at http://www.oecd.org/termsandconditions.