
3. Private climate finance mobilised
As further detailed in Annex B, the OECD has developed an international standard for measuring the amounts mobilised from the private sector by official development finance interventions, including for climate. Work has been carried out over multiple years and successive rounds of research, stakeholder consultations, surveys, methodological developments, and implementation. On that basis, this chapter analyses private-sector finance (typically in the form of market-term loans or equity) mobilised by bilateral or multilateral public finance interventions, e.g. by means of de-risking instruments. The measure of private finance mobilisation does not capture private finance invested in the absence of public finance interventions, e.g. private investment that may have been catalysed by domestic norms and fiscal policies or by upstream capacity building, or finance provided by private philanthropies (see Box 3.1).
The chapter analyses private climate finance mobilised by developed countries according to mechanisms, climate focus, sector, region and recipient countries’ income groups. The chapter also offers insights on how such private climate finance compares to private finance mobilised for non-climate activities. The latter corresponds to private finance mobilised by bilateral and multilateral development finance providers that was reported to the OECD DAC without being marked as climate-related. For reasons explained earlier in this report, the analysis of mobilised private climate finance is limited to 2016-18.
Total private finance mobilised attributed to developed countries (including climate and non-climate finance) remained stable in 2016 (USD 32.4 billion) and 2017 (USD 33.1 billion) and increased significantly to reach USD 42.6 billion in 2018 (a year-on-year increase of 29%).
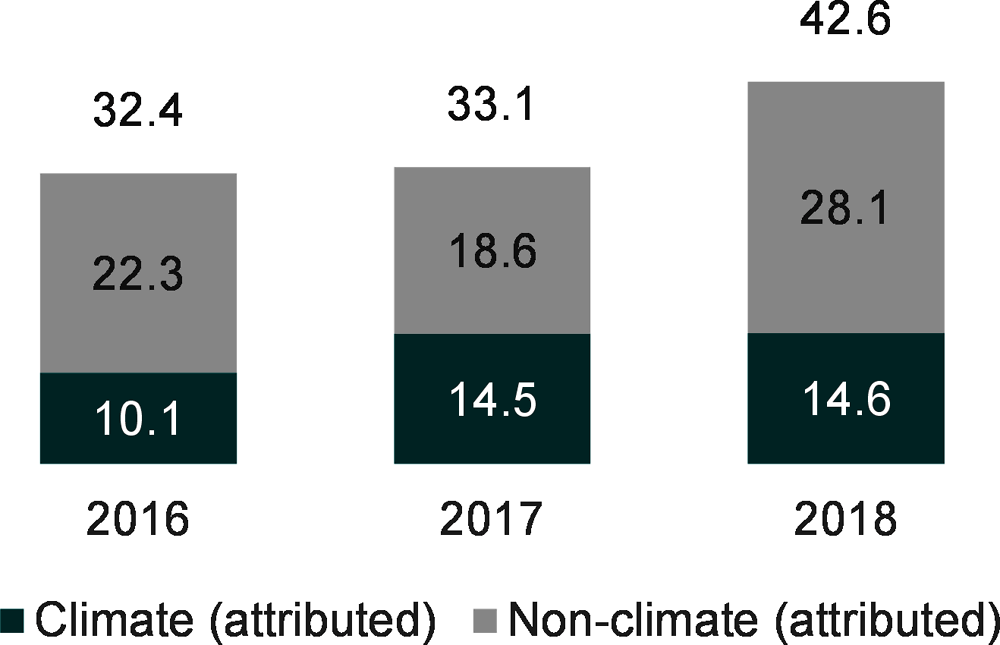
Note: For a limited number of providers, the data reported to the OECD did not include non-climate mobilised private finance. Consequently, total private finance mobilised by developed countries and, within that non-climate mobilised private finance may be partly underestimated.
Source: OECD Development Assistance Committee statistics as well as complementary reporting to the OECD.
As a subset of this total, private climate finance mobilised followed a different trend: it first grew from USD 10.1 billion in 2016 to USD 14.5 billion in 2017 (a year-on-year increase of 43%) and then remained stable in 2018 (USD 14.6 billion).
Activity-level data collected by the OECD on amounts mobilised from the private sector enable to distinguish between financial mechanisms used by official development finance providers to mobilise private finance. The OECD methodology for measuring mobilised private finance follows a mechanism approach. As such, it distinguishes between guarantees, syndicated loans, shares in collective investment vehicles (CIVs), direct investment in companies or special purpose vehicles (SPVs), credits lines and simple co-financing arrangements (see Annex B, as well as (OECD DAC, 2020[6]) and (OECD, 2019[1]) for further details). For confidentiality reasons, such data neither include information about the financial instrument used by the private sector, nor the financial terms relating to the private investment.
Over 2016-18, the majority of private climate finance was mobilised through direct investment in companies or SPVs (43%) guarantees (23%), syndicated loans (14%). The share of private climate finance mobilised through guarantees and syndicated more than doubled from 2016 to 2018 (from 15% to 31% and 7% to 19%, respectively). On the contrary, the share of private climate finance mobilised through direct investment in companies or SPVs dropped from 54% in 2016 to 33% in 2018. Further, the share of private climate finance mobilised through shares in CIVs, and simple co-financing remained relatively modest over the three-year period (4% and 6% respectively). Credit lines, which represented 13% in both 2016 and 2017, dropped significantly in 2018, accounting for 6% only.
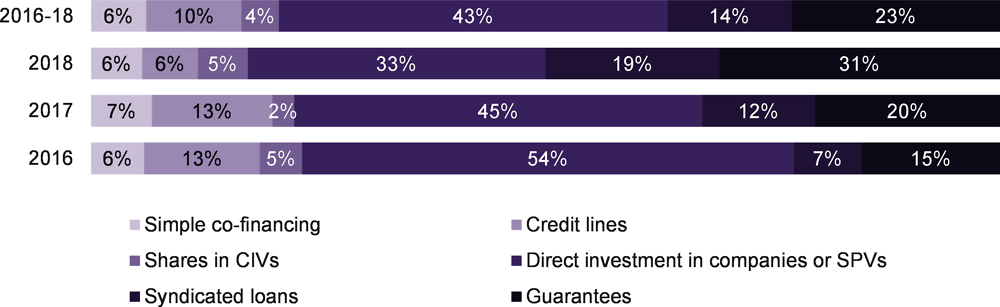
Source: OECD Development Assistance Committee statistics as well as complementary reporting to the OECD.
Figure 3.3 displays the share represented respectively by climate and non-climate private finance mobilised for each mobilisation mechanism. Over half (54%) of total private finance mobilised by developed countries in 2016-18 through direct investment in companies or SPVs were for climate. The share of climate in total private finance mobilisation through simple co-financing was 41% and syndicated loans 37%. These relatively high shares may relate to the fact that syndicated loans and direct investment in companies or SPVs are frequently used in the context of large infrastructure projects that often aim at climate objectives. In contrast, the share of private climate finance mobilised by developed countries in total private finance mobilised through credit lines, guarantees and shares in CIVs was significantly lower (27%, 26% and 20% respectively).
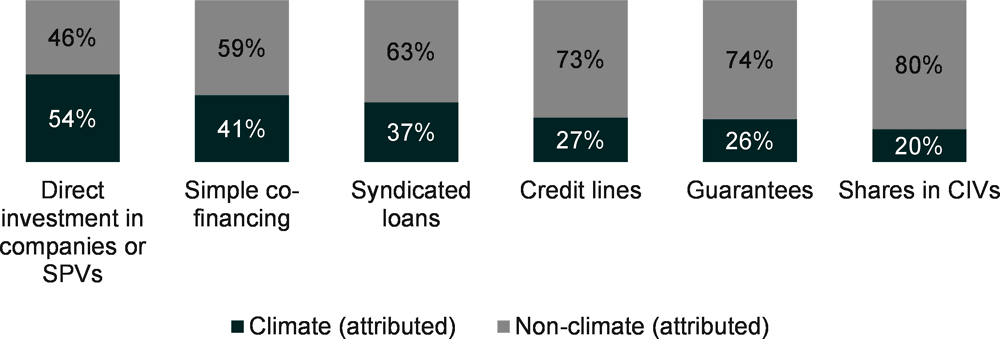
Note: For a limited number of providers, the data reported to the OECD did not include non-climate mobilised private finance. Consequently, total private finance mobilised by developed countries and, within that non-climate mobilised private finance may be partly underestimated.
Source: OECD Development Assistance Committee statistics as well as complementary reporting to the OECD.
The relatively lower shares represented by climate in total private finance mobilised through credit lines, guarantees and shares in CIVs may in part be due to difficulties in tracking climate-relevance. These instruments often target small and medium-sized enterprises via financial intermediaries (portfolio guarantees and credit lines) or pooling and other collective investment vehicles. Assessing the climate focus or relevance of downstream investments can be challenging due to the limited availability of information available at the point of the public finance intervention on the actual downstream use of the finance (also see sectoral analysis in Section 3.4).
In contrast, information on the climate focus of activities without an intermediary, such as direct investment in companies and SPVs, investment guarantees, syndicated loans for infrastructure projects, or simple co-financing arrangements, is typically available at the commitment stage of the public finance intervention.
Over 93% of private climate finance mobilised by developed countries over 2016-18 benefited mitigation (Figure 3.4). In contrast, adaptation and cross-cutting each accounted for 3% to 4%. The respective relative shares of mitigation, adaptation and cross-cutting were almost identical in each of the three years.
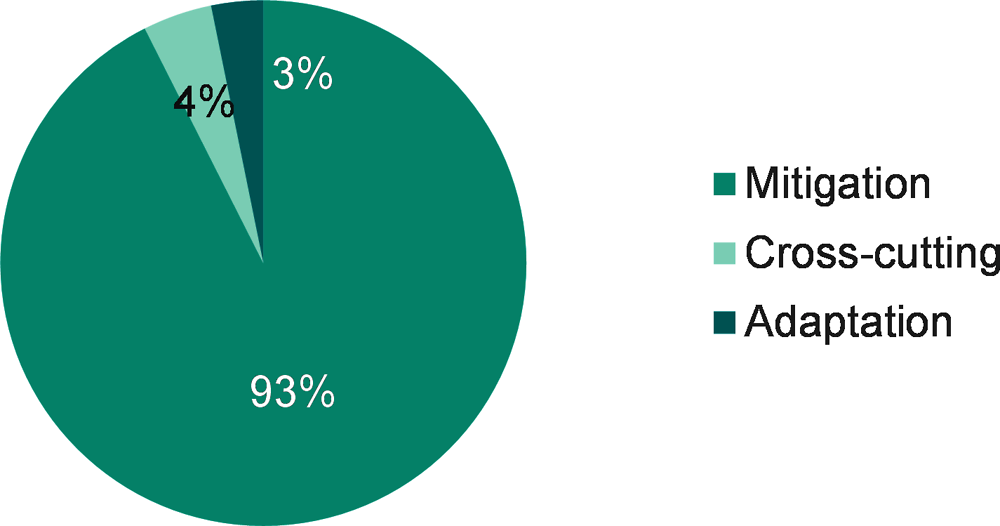
Source: OECD Development Assistance Committee statistics as well as complementary reporting to the OECD.
As highlighted in Box 1.1, methodologies to track adaptation finance differ from those to track mitigation finance. When it comes to mobilised private finance specifically, there likely remains room for improvement in identifying adaptation-relevant activities, for instance, in cases where climate resilience is mainstreamed into investments and business decisions.
Private climate finance mobilised by developed countries during 2016-18 mainly focused on the energy sector (USD 7.8 billion (60%) per year on average). Only USD 1 billion (6%) of private climate finance was mobilised in the industry, mining and construction sectors, followed by banking and business services (USD 0.9 billion; 7%), agriculture, forestry and fishing, and transport and storage (USD 0.4 billion; 3% each). In contrast, banking and business services was the main sector benefitting from non-climate private finance mobilised, with an annual average of USD 9.9 billion (42% of private non-climate finance mobilised by developing countries). These figures confirm the observation in Section 3.2 that a large share of non-climate mobilisation is mobilised via financial intermediaries, which may sometimes make it more difficult to assign private mobilisation to a specific sector or assess its potential climate relevance.
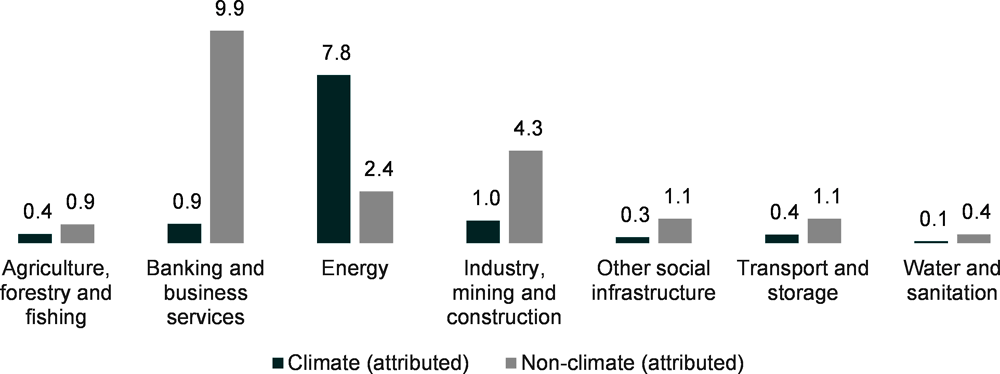
Note: For a limited number of providers, the data reported to the OECD did not include non-climate mobilised private finance. Consequently, total private finance mobilised by developed countries and, within that non-climate mobilised private finance may be partly underestimated.
Source: OECD Development Assistance Committee statistics as well as complementary reporting to the OECD.
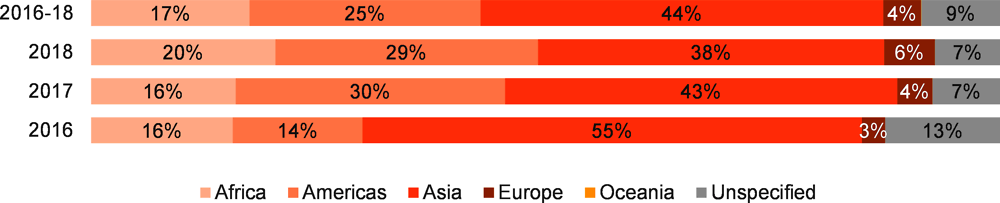
During 2016-18, as displayed in Figure 3.6, developed countries predominantly mobilised private climate finance for projects in Asia and the Americas (44% and 25% respectively). Africa represented 17% and Europe 4%. Private climate finance mobilised for Oceania represented 0.01% of total climate finance mobilised by developed countries (Figure 3.6). The remaining 9% was unspecified by region. In the context of non-climate private finance mobilised during 2016-18, Asia was also the main beneficiary region, although to a lesser extent than for climate private finance mobilised (32% of total non-climate private finance mobilised).
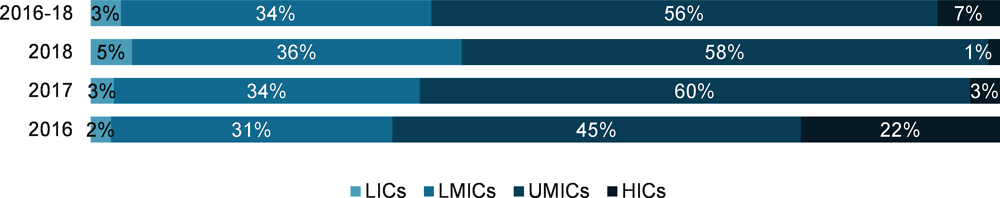
Over 2016-18, 90% of country-allocable (i.e. excluding regional activities) private climate finance mobilised by developed countries benefitted MICs, with a strong focus on UMICs (56%) (Figure 3.7). HICs benefitted from 7% of private climate finance mobilised per year on average, LICs only 3%. Moreover, only 5% of total private climate finance mobilised by developed countries during 2016-18 was for the LDCs and 1% for the SIDS (Figure 3.7). These trends are very similar to those observed for private finance mobilised reported as non-climate.
Private philanthropic foundations constitute an emerging source of finance for climate action in developing countries. Since these organisations are funded from private sources (e.g. donations by high-net-worth individuals and companies, investment returns, royalties, or lottery subscriptions), the climate finance they provide is not accounted for in volumes of public climate finance presented in this report. As the financing activities of such foundations is typically not associated with public climate finance interventions, they are also unlikely to be captured as part of the mobilised private finance component.
The information presented here offers insights on the allocation of climate-related finance from philanthropic foundations headquartered in developed countries, based on new OECD DAC statistics on private philanthropy for development. In 2018, thirty-three of the largest foundations active in developing countries provided USD 0.6 billion of climate-related finance (8% of the foundations development-related commitments, which totalled USD 6.9 billion) (OECD, 2020[17]). The data, available since 2017 and collected based on the Rio marker methodology (OECD, 2016[18]), suggest that in 2017-18 foundations focused more on mitigation (53%) than on adaptation (13%), with a 34% share for cross-cutting activities targeting both objectives.

Source: OECD Development Assistance Committee statistics.
These funds mainly related to grants supporting projects and programmes implemented by NGOs, research institutes and other channels (46%) and general support to civil society organisations working on climate (46%). Technical assistance and capacity building represented approximately 2% of the yearly average and programme-related investments less than 1%. In terms of sectors, support by foundations to climate action focused primarily on clean energy and sustainable agriculture as well as on broader environmental policy, including climate governance.