Gender differences in self-employment rates
Key findings
-
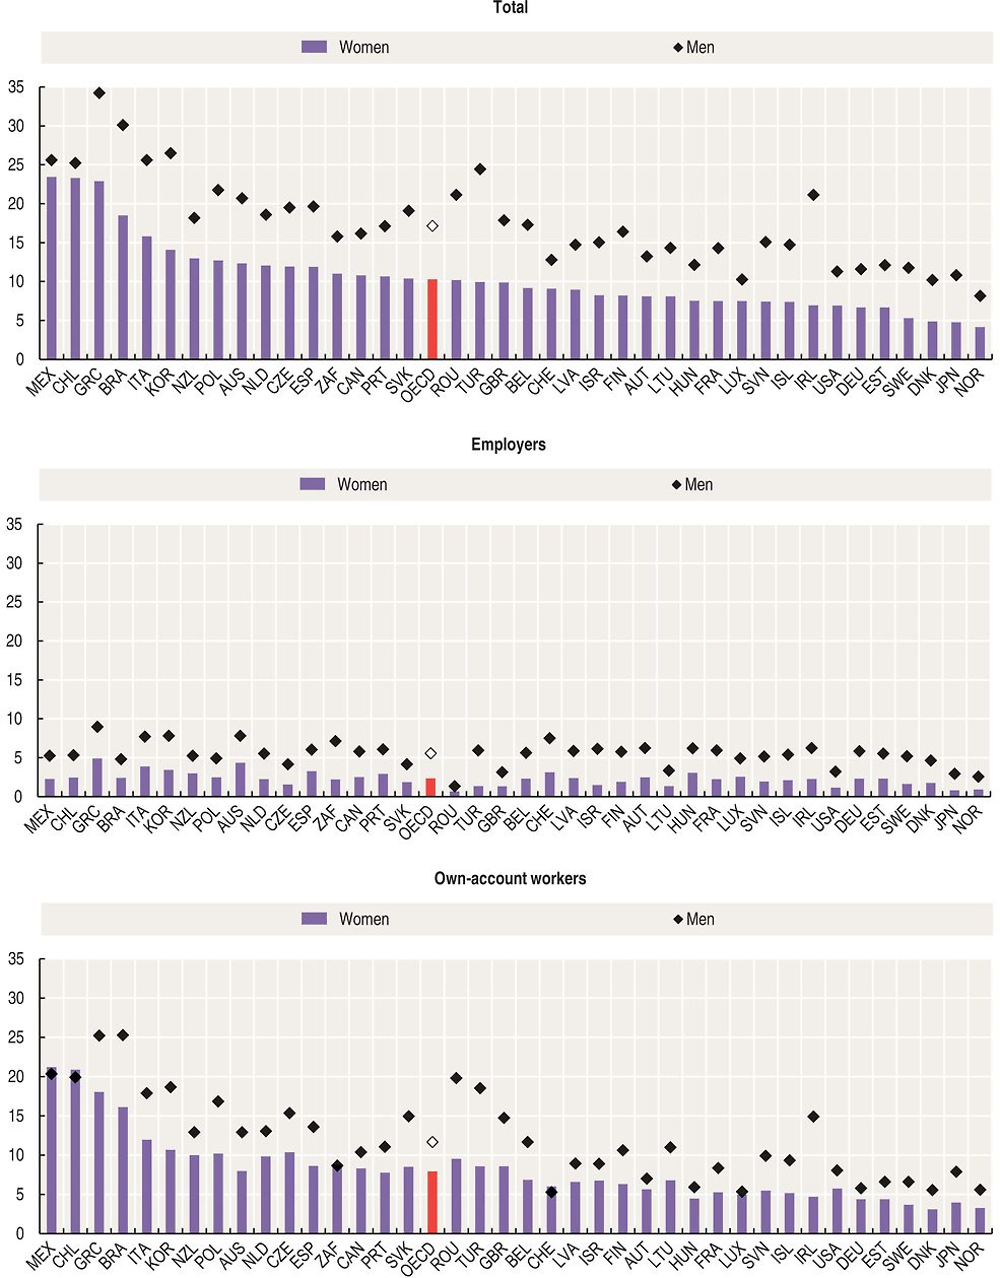
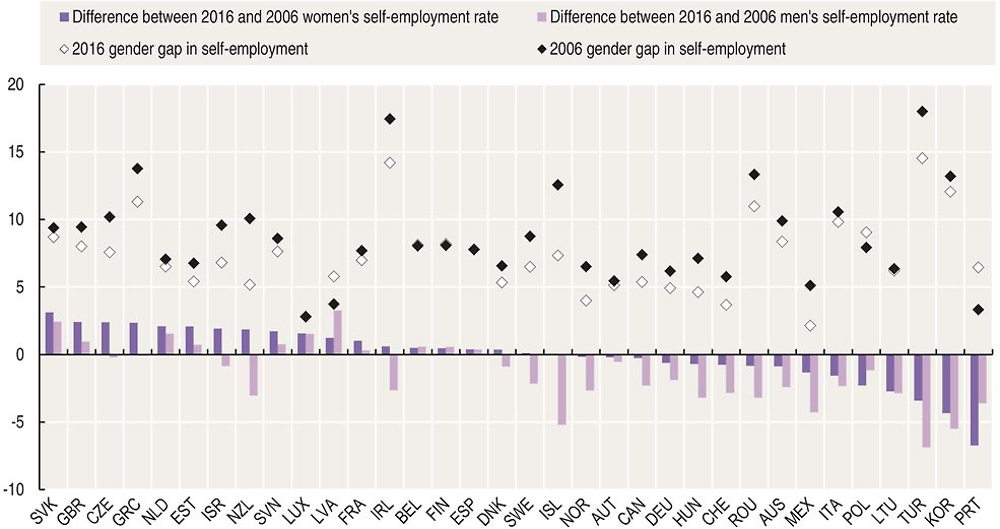
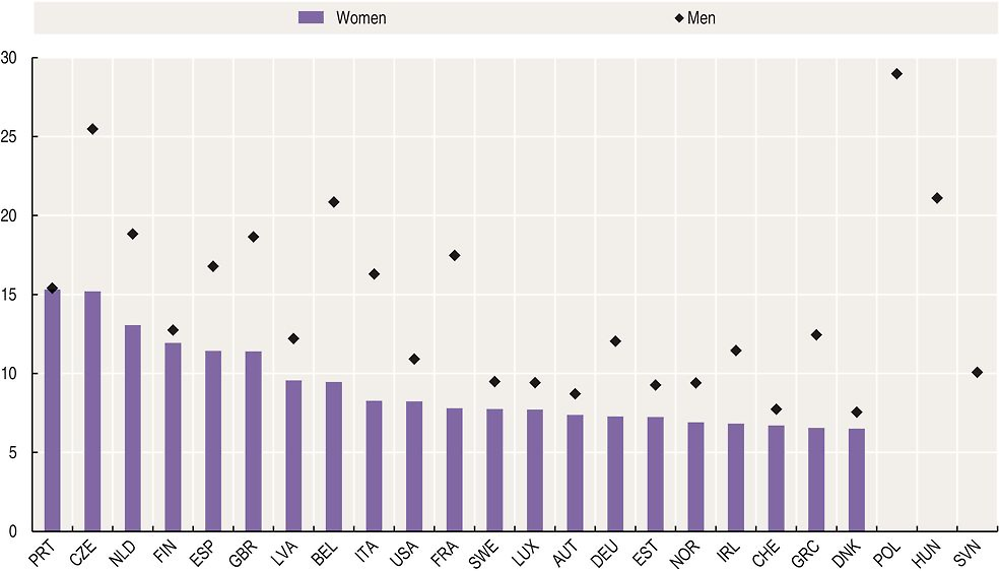
In OECD economies, one in ten employed women is self-employed, almost half the rate of self-employed men (17%). During the past ten years, however, the gap between male and female self-employment rates has closed in almost every country, and particularly so in Iceland, New Zealand and Turkey.
-
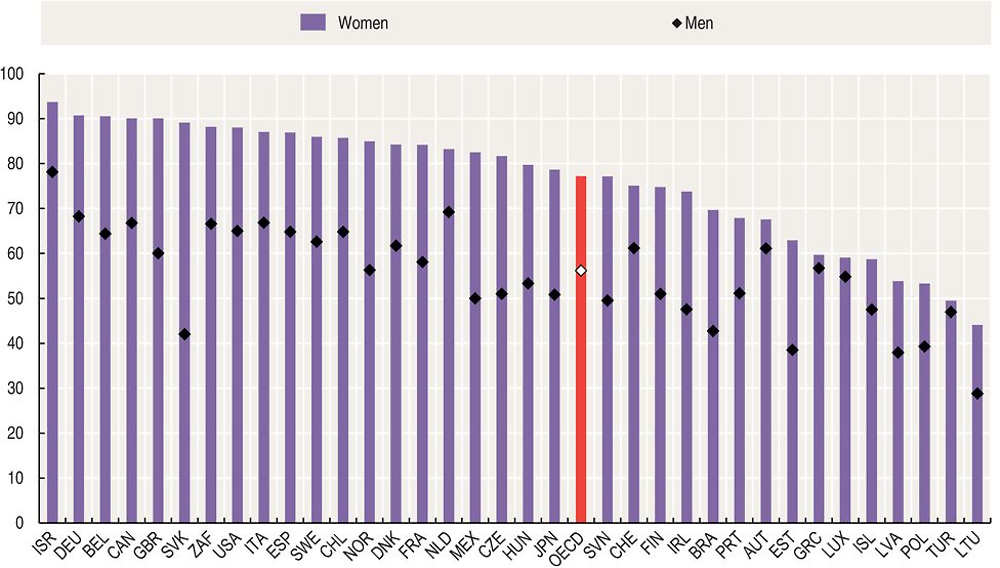
In a majority of countries, women self-employed work predominantly in the services sector (70% or more), and mostly as own-account workers rather than employers. The patterns for men are different, with a large share of self-employed men working in manufacturing and, generally, two and a half times more likely to employ others than self-employed women.
-
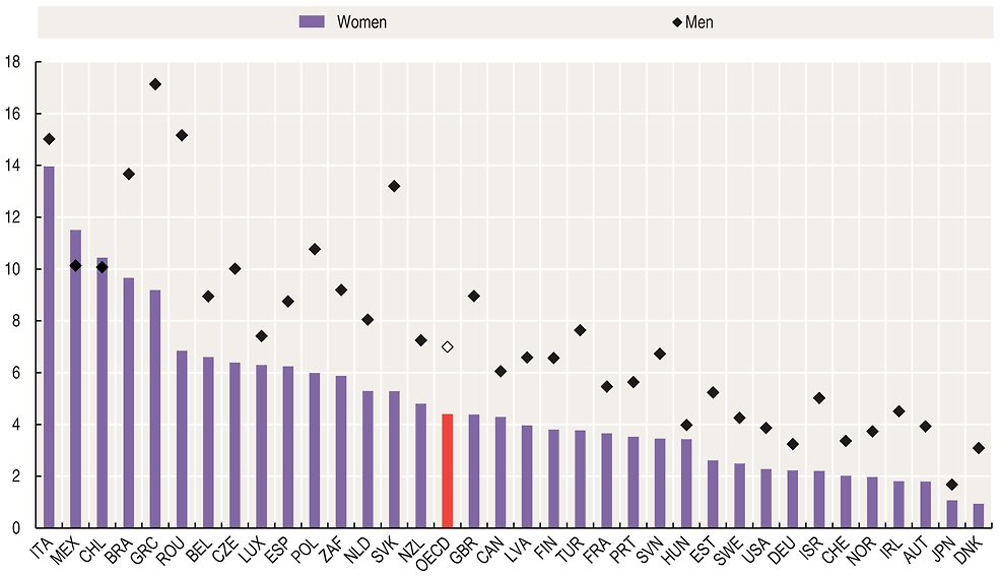
A gender gap is observed in all countries also among young self-employed, i.e. individuals less than 30 years old. In 2016, only in Chile and Mexico the self-employment rate of women was slightly higher than that of men.
-
The share of employees having a second job as self-employed increased in 2016 compared to 2007 in most countries, to around 2% and 1% respectively for men and women employees.
Relevance
Entrepreneurship is an important source of employment creation and innovation. It is also a vehicle for addressing inequalities, particularly across genders where significant differences remain, despite the scope that self-employment provides to manage work-home balances.
The self-employed are defined as those who own and work in their own business, including unincorporated businesses and own-account workers, and declare themselves as “self-employed” in population or labour force surveys. Self-employed category consists therefore of the sum of employers and own-account workers.
The number of women (men) employers is given by the number of women (men) who report their status as “self-employed with employees” in population surveys. The number of women (men) own-account workers is given by the number of women (men) who report their status as “self-employed without employees”. The share of women (men) employers (own-account workers) is given in relation to the total number of women (men) in employment.
The gender gap in self-employment rate for the year t corresponds to the difference between male and female self-employment rates in t. Contribution of female (male) self-employment rate change is calculated as the difference between t and t-n female (male) self-employment rates.
The share of self-employed in the population of young employed is calculated by dividing the number of self-employed women (men) between 15 and 29 years old by the number of all employed women (men) between 15 and 29 years old.
The share of self-employed in the population of employed with foreign citizenship is calculated by dividing the number of self-employed women (men) with foreign citizenship by the number of all employed women (men) with foreign citizenship.
The share of women (men) employees having a second job as self-employed is calculated by dividing the number of women (men) employees who declare that they have a second job as self-employed by the total number of women (men) employees.
Information on data for Israel: https://doi.org/10.1787/888932315602.
Comparability
The main comparability issue relates to the classification of “self-employed” owners of incorporated businesses. Some countries, notably Japan, New Zealand and Norway include only the self-employed owners of unincorporated businesses, following the 2008 SNA, which is likely to create a downward bias in the contribution of self-employed owners with employees in these countries.
In Figure 6.6, services include sectors 45-96 of ISIC Rev. 4. In Figure 6.7, data refer to self-employed with foreign citizenship for all countries with exception of the United States, where data refer to foreign-born.
Not all the self-employed are necessarily entrepreneurs in the purest sense, as defined in the OECD Entrepreneurship Indicators Programme. Self-employment statistics include, for example, craft-workers engaging in low level activity, often for leisure purposes. Care is thus needed in interpreting the data in analyses of entrepreneurship.
Source
Canada: Labour Force Survey, www.statcan.gc.ca/imdb-bmdi/3701-eng.htm.
Chile: Encuesta Nacional del Empleo, http://www.ine.cl/estadisticas/laborales/ene.
Eurostat: EU Labour Force Survey, http://ec.europa.eu/eurostat/web/microdata/european-union-labour-force-survey.
Israel: Labour Force Survey, http://www.cbs.gov.il/ts/databank/databank_main_func_e.html?i=21&ti=11&r=0&f=3&o=0.
Japan: Labour Force Survey, http://www.e-stat.go.jp/SG1/estat/eStatTopPortalE.do.
Mexico: Encuesta National de Empleo, http://www.inegi.org.mx/est/contenidos/proyectos/encuestas/hogares/default.aspx.
United States: Current Population Survey, www.census.gov/cps/.
Brazil: National Household Sample Survey, http://www.ibge.gov.br/english/estatistica/populacao/trabalhoerendimento/pnad2008/default.shtm#brasil.
South Africa: Labour Force Survey, http://www.statssa.gov.za/?page_id=1854&PPN=P0211.
Further reading
OECD (2017), Report on the implementation of the OECD Gender Recommendations, Meeting of the OECD Council at Ministerial Level Paris, 7-8 June 2017, http://www.oecd.org/mcm/documents/C-MIN-2017-7-EN.pdf.