Venture capital investments by investee company
Key facts
-
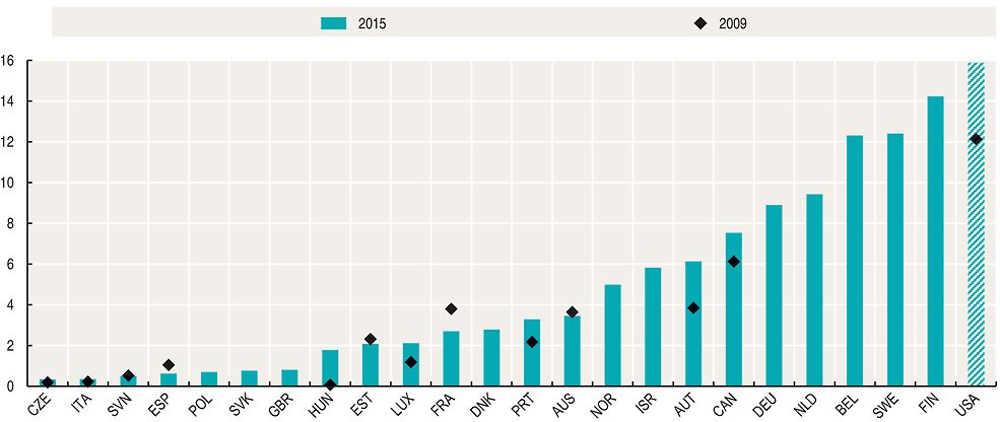
Only a very small number of companies are backed by venture capital. Only in Belgium, Finland, Sweden and the United States do venture capital-backed companies represent over 1% of total enterprise births.
-
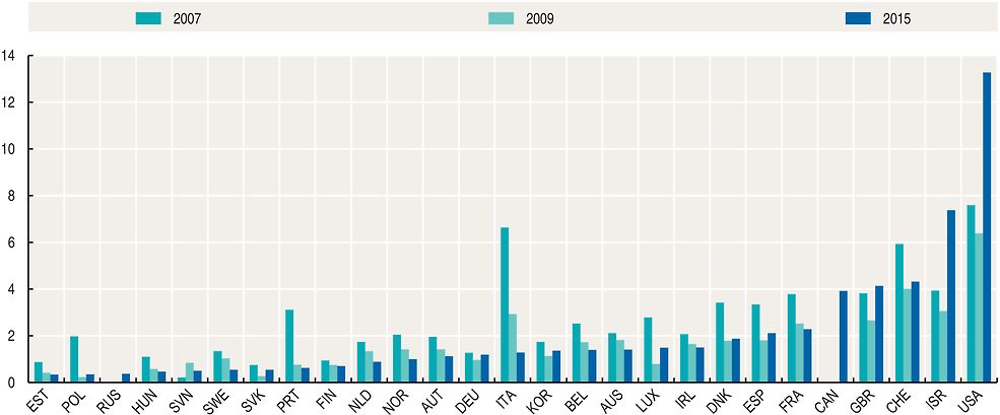
In the majority of countries, the average investment per company has declined compared to the level in 2007. But in Israel and the United States, the average investment per company in 2015 was significantly above the 2007 average, and the highest among OECD countries.
-
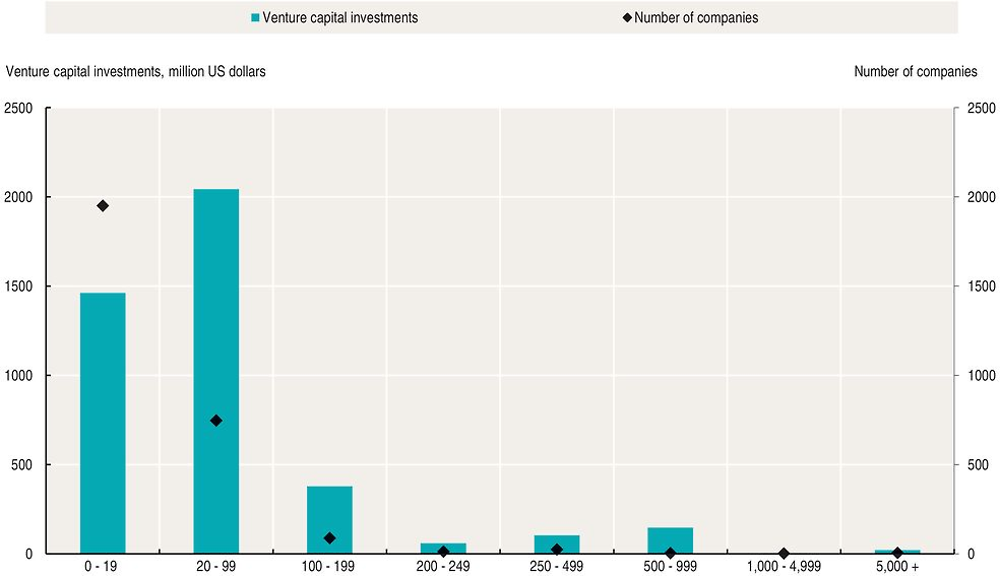
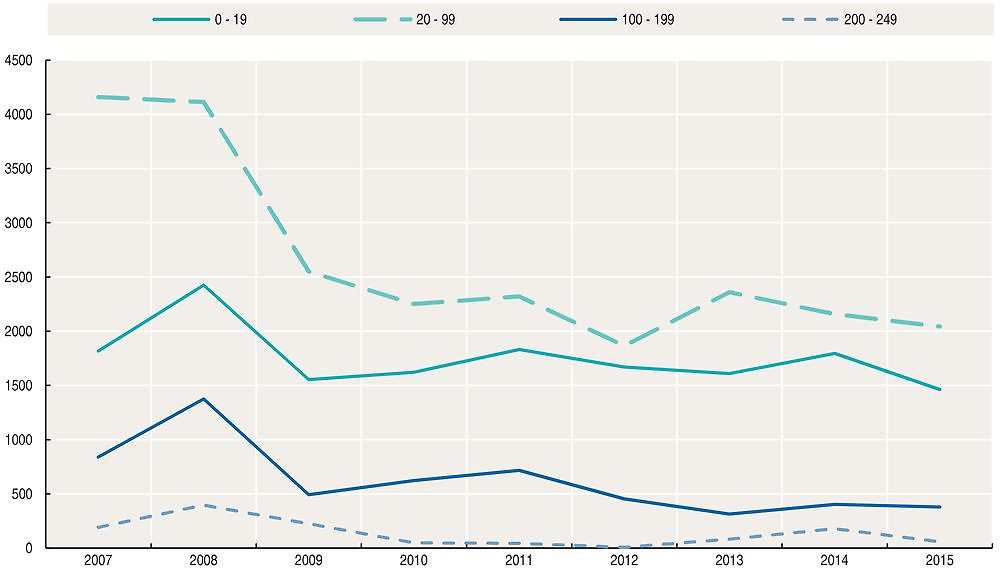
In Europe, companies with 20 to 99 employees attracted the highest amount of venture capital investments, around USD 2 billion.
-
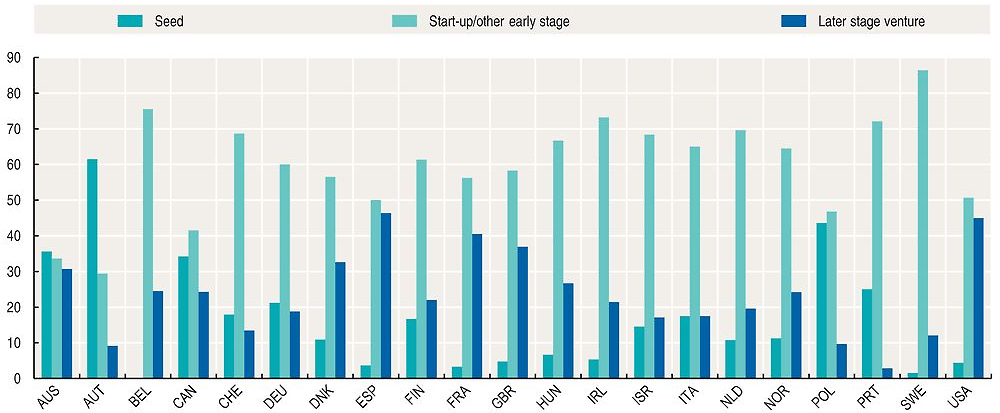
In 2015, in the United States a significant percentage (45%) of venture-backed deals related to later stage financing. This was similarly the case in Spain, France and the United Kingdom, where respectively 48%, 40% and 37% of all investee companies attracted later stage financing. In contrast, in Sweden almost 90% of venture-backed companies received start-up and early stage financing, and in Austria more than 60% of investee companies attracted seed financing.
Venture capital-backed companies (portfolio companies or investee companies) are new or young enterprises that are (partially or totally) financed by venture capital.
Venture capital-backed companies by development stage refers to the percentage share of venture-capital backed companies according to their development stage as harmonised by OECD (Pre-seed/Seed; Start-up/Other early stage; Later stage venture. Table C.2, Annex C, presents the breakdown of venture capital by stage from selected Venture Capital associations and OECD).
The average venture capital investment per company is the ratio between the total venture capital investments in a country and the number of venture capital-backed companies in the country.
The venture capital-backed companies rate is computed as the number of enterprises that received venture capital over 1000 employer enterprise births.
The trend-cycle reflects the combined long-term (trend) and medium-to-long-term (cycle) movements in the original series (see http://stats.oecd.org/glossary/detail.asp?ID=6693).
Information on data for Israel: https://doi.org/10.1787/888932315602.
Relevance
Venture capital is a form of equity financing particularly important for young companies with innovation and growth potential but untested business models and no track record; it replaces and/or complements traditional bank finance. The development of the venture capital industry is considered an important framework condition to stimulate innovative entrepreneurship.
Comparability
There are no standard international definitions of either venture capital or the breakdown of venture capital investments by stage of development. In addition the methodology for data collection differs across countries.
Data on venture capital are drawn mainly from national or regional venture capital associations that produce them, in some cases with the support of commercial data providers, except for Australia, where the Australian Bureau of Statistics collects and publishes statistics on venture capital.
The statistics presented correspond to the aggregation of investment data according to the location of the portfolio companies, regardless of the location of the private equity firms. Exceptions are Australia, Korea and Japan where data refer to the location of the investing venture capital firms.
Data for the United States refer to the number of deals instead of the number of investee companies. Data for Israel refer only to venture capital-backed high-tech companies. Data for Australia and New Zealand refer to the fiscal year.
In the OECD Entrepreneurship Financing Database venture capital is made up of the sum of early stage (including pre-seed, seed, start-up and other early stage) and later stage venture capital. As there are no harmonised definitions of venture capital stages across venture capital associations and other data providers, original data have been re-aggregated to fit the OECD classification of venture capital by stages. Korea, New Zealand, the Russian Federation and South Africa do not provide breakdowns of venture capital by stage that would allow meaningful international comparisons.
Table C.2 (Annex C) shows the correspondence between original data and OECD harmonised data for venture capital investments by stage.
Source
OECD Entrepreneurship Financing Database.
Further reading
OECD (2016), Financing SMEs and Entrepreneurs 2016: An OECD Scoreboard, OECD Publishing, Paris, https://doi.org/10.1787/fin_sme_ent-2016-en.
OECD (2015), New Approaches to SME and Entrepreneurship Financing: Broadening the Range of Instruments, OECD Publishing, Paris, https://doi.org/10.1787/9789264240957-en.