Birth rate of enterprises
Key facts
-
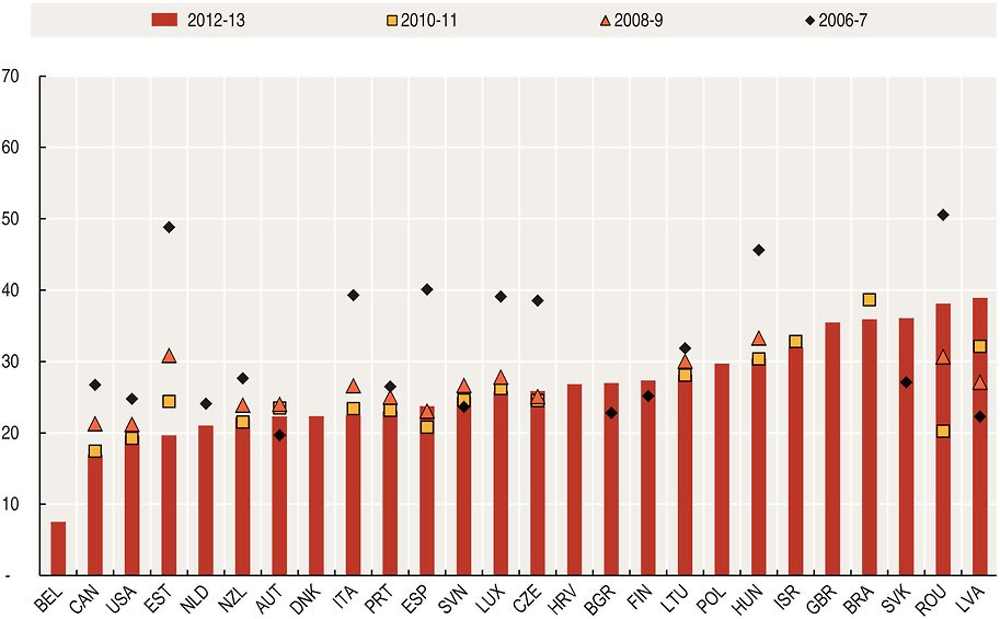
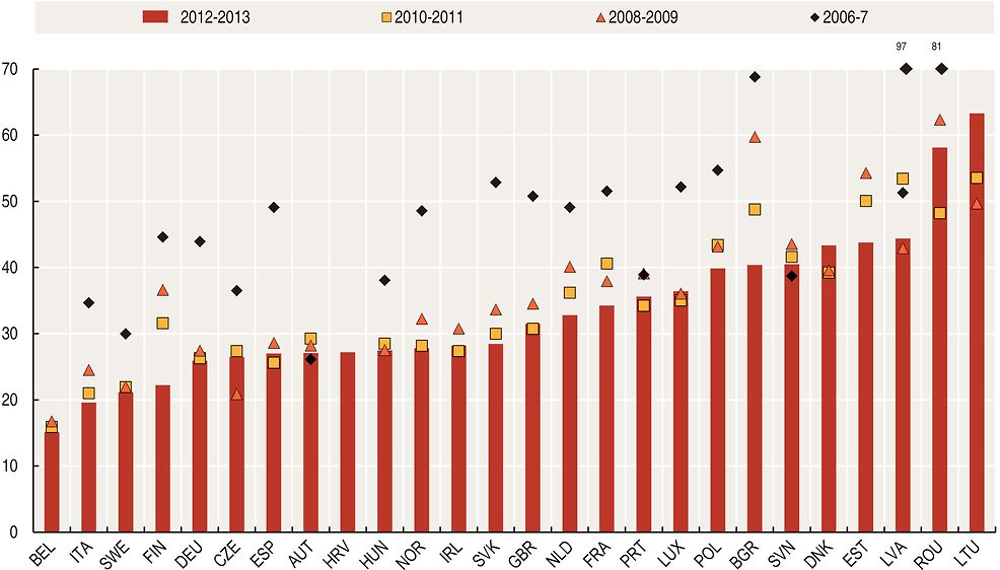
Start-ups with employees, i.e. the group of employer enterprises that are up to two years old, represent between 20% and 35% of all employing firms in the OECD area. In a majority of countries, this proportion decreased significantly between 2006 and 2013, and particularly so in the Czech Republic, Hungary, Italy, Luxembourg and Spain. The falling share of start-ups was mainly due to the decline in birth rates rather than to the decrease in survival rates of enterprises in their first two years of life.
-
Between 2006 and 2013, the share of non-employer start-ups also declined, and often more dramatically than the share of employer start-ups, e.g. by 20 percentage points in several countries.
-
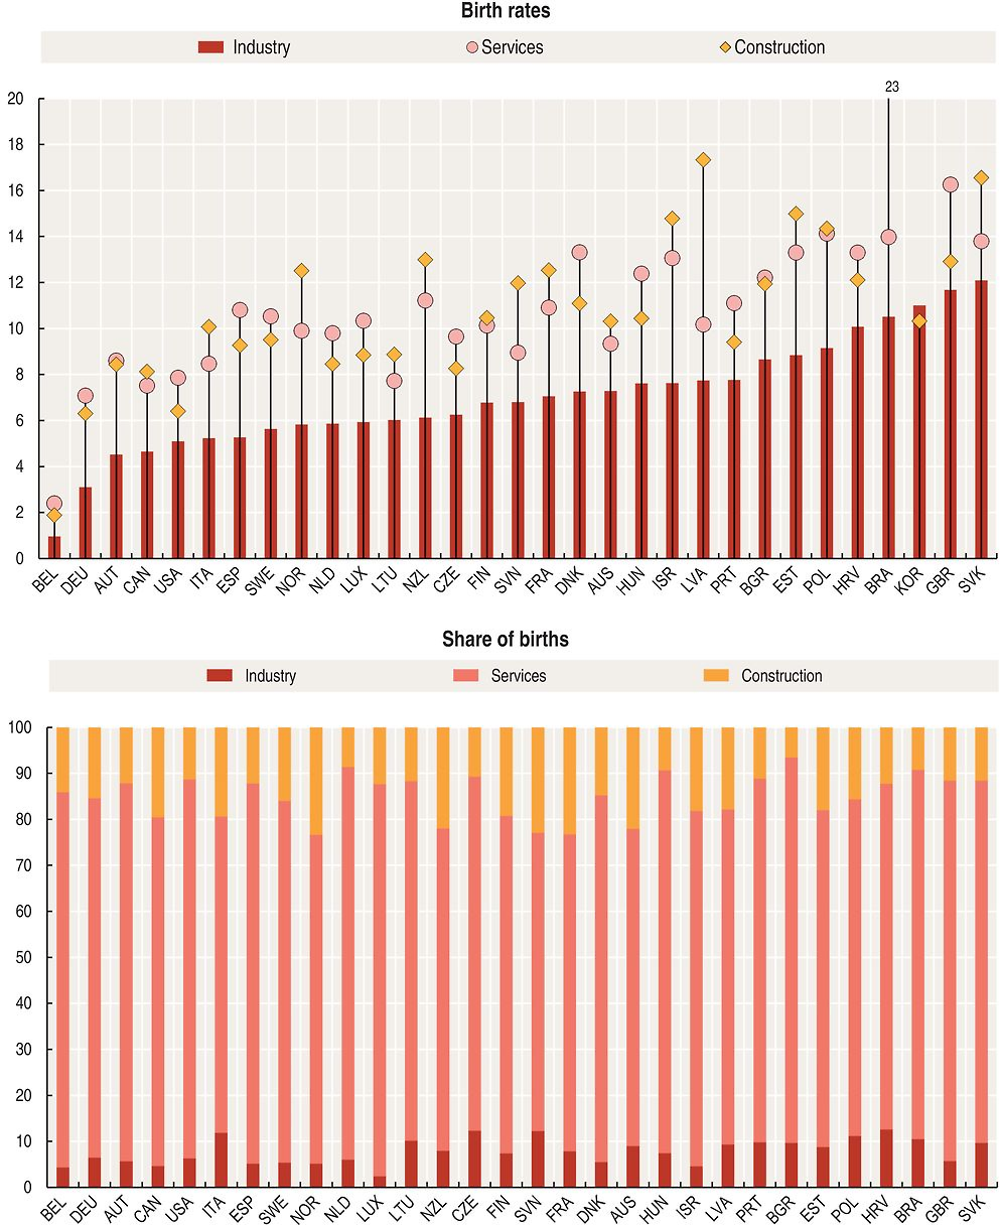
In nearly all countries, birth rates are higher in the construction and services sectors than in industry, partly reflecting the lower fixed capital entry costs.
-
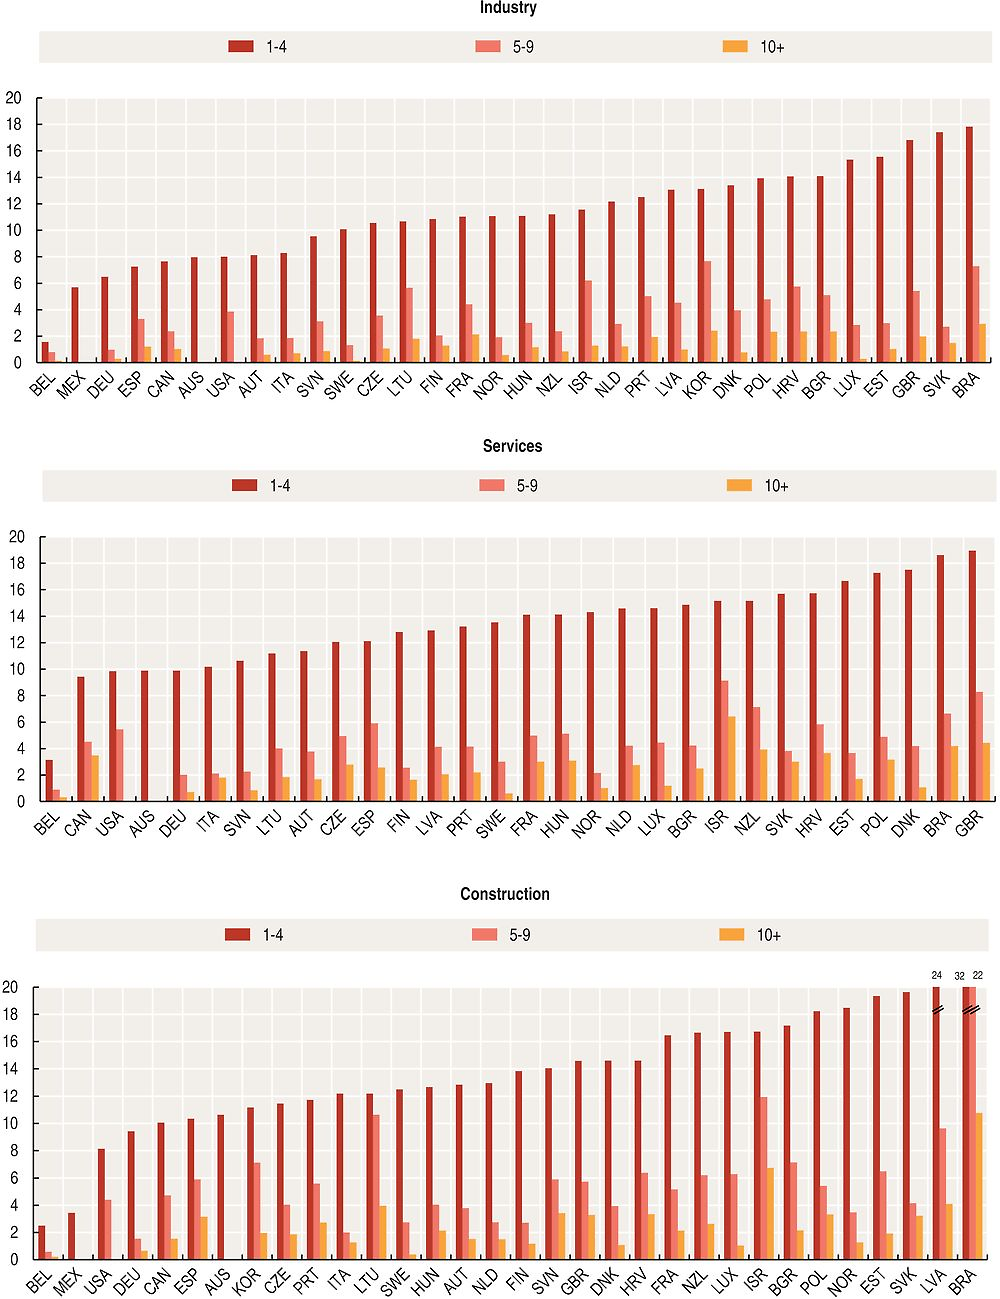
Across all sectors and countries, most new enterprises are created with between one and four employees.
Start-ups, as defined in this publication, include all enterprises that are up to two years old, i.e. the newly-born enterprises plus those that are one year old and two years old. The start-up rate is the number of employer (non-employer) start-ups as a percentage of the number of active employer (non-employer) enterprises.
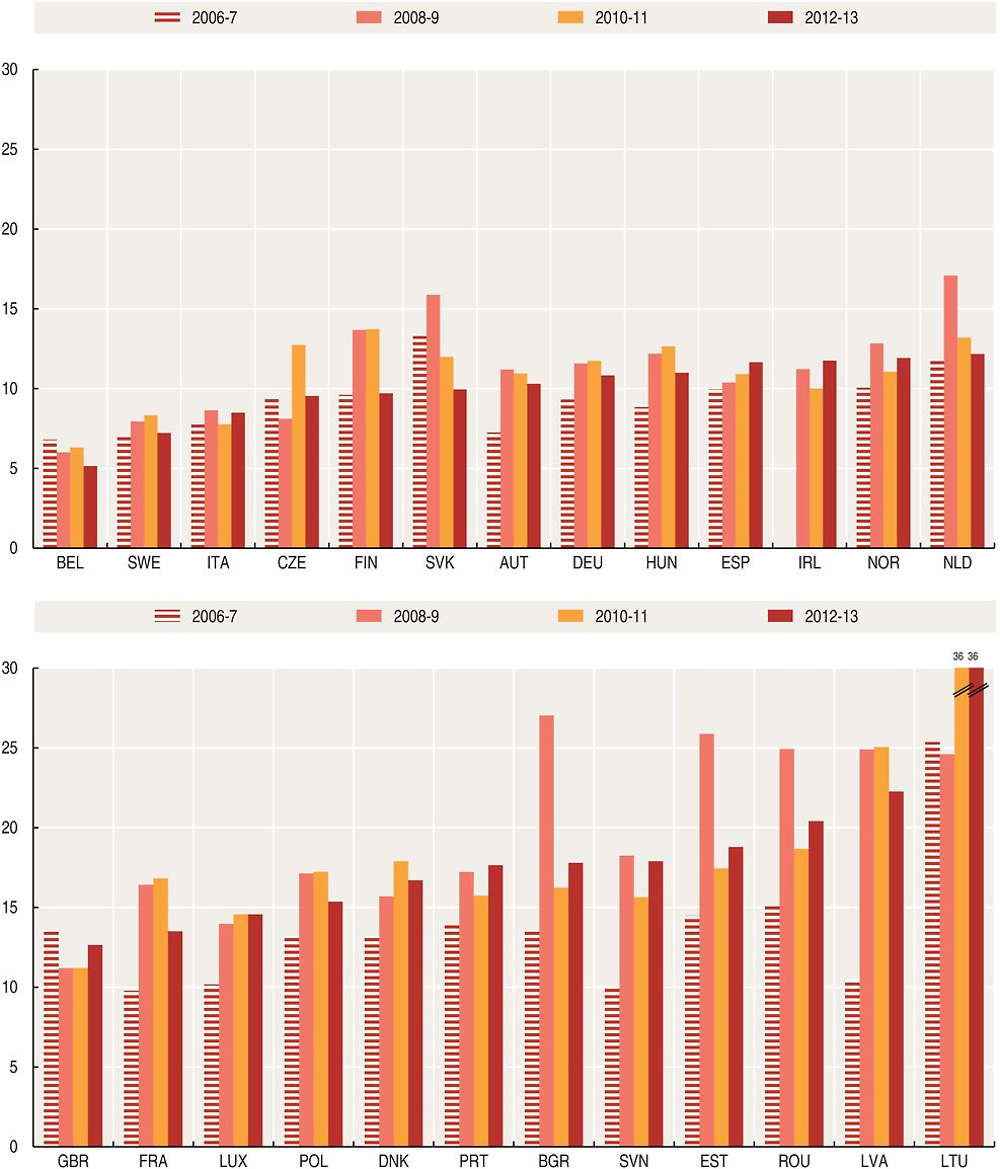
An employer enterprise birth refers to the birth of an enterprise with at least one employee. The population of employer enterprise births consists, first, of “new” enterprise births, i.e. new enterprises reporting at least one employee in the birth year; and second, of enterprises that existed before the year under consideration but were then below the threshold of one employee, and that reported one or more employees in the current, i.e. birth, year.
Employer enterprise births do not include entries into the population due to: mergers, break-ups, split-offs or restructuring of a set of enterprises. They also exclude entries into a sub-population resulting only from a change of activity.
The employer enterprise birth rate corresponds to the number of births of employer enterprises as a percentage of the population of active enterprises with at least one employee.
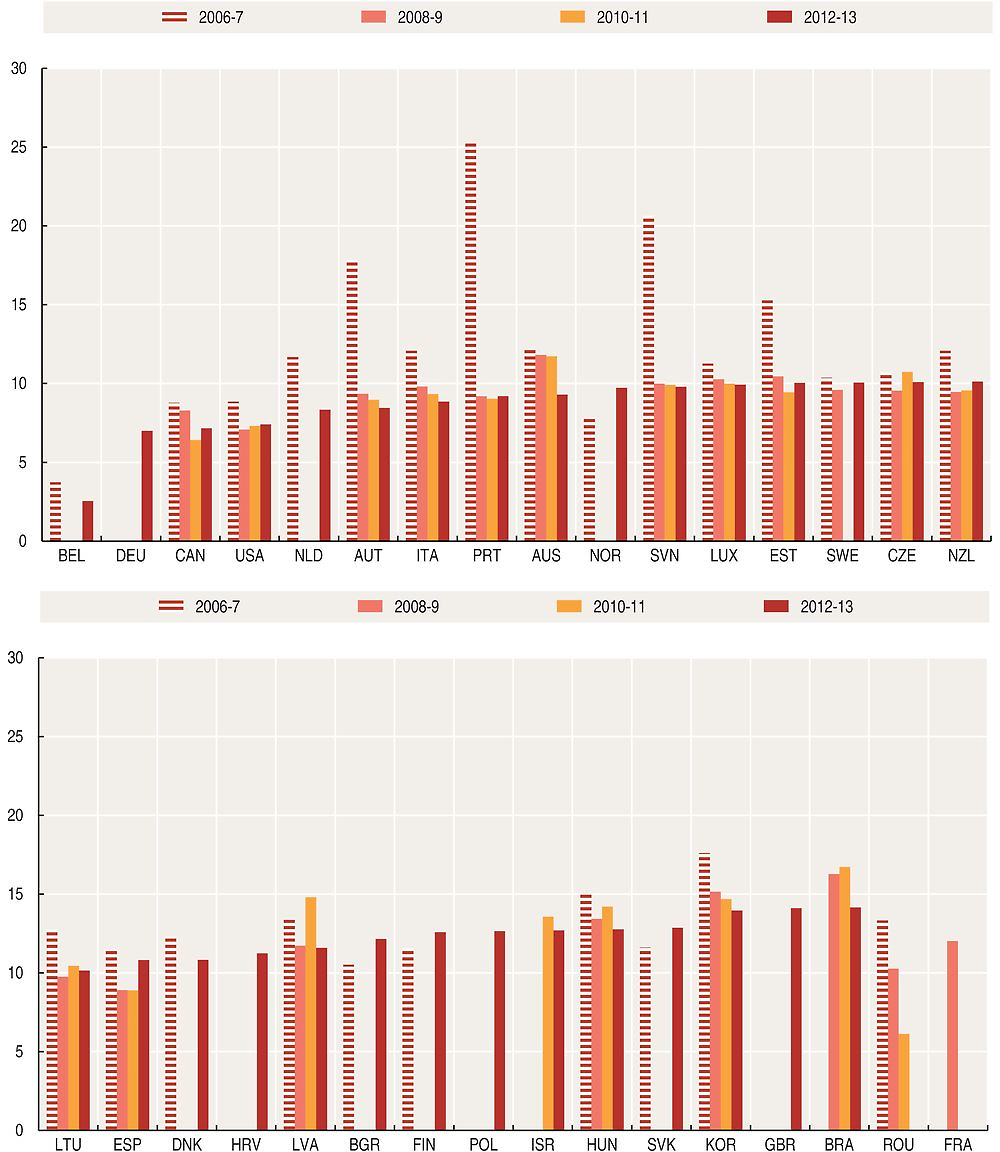
The non-employer enterprise birth rate corresponds to the number of births of non-employer enterprises as a percentage of the population of active non-employer enterprises.
Information on data for Israel: https://doi.org/10.1787/888932315602.
Relevance
Young enterprises are considered as key drivers of growth due to their disproportionate contribution to aggregate job creation and because of the productivity-enhancing effect associated with a rapid pace of firm entry and exit.
Comparability
“Employer” indicators are found to be more relevant for international comparisons than indicators covering all enterprises, as the latter are sensitive to the coverage of business registers. In many countries, the main sources of data used in business registers are administrative tax and employment registers, meaning that often only businesses above a certain turnover and/or employment threshold are captured. An economy with relatively high thresholds would therefore be expected to have lower birth statistics than similar economies with lower thresholds. An additional complication relates to changes in thresholds over time. Monetary-based thresholds change over time in response to factors such as inflation and fiscal policy, both of which can be expected to affect comparisons of birth rates across countries and over time. The use of the one-employee threshold improves comparability, as it excludes very small units, which are most subject to threshold variations.
However, the concept of employer enterprise birth is not without problems. Many countries have sizeable populations of self-employed. If a country creates incentives for the self-employed to become employees of their own company, the total number of employer enterprise births will increase. This can distort comparisons over time and across countries, even if from an economic and entrepreneurial perspective little has changed.
Data for employer and non-employer enterprise births exhibit breaks in the series in 2013 for Estonia, Finland and Portugal, in 2009 for the Netherlands, and in 2011 for Romania. In Estonian non-employer data, the 2008 increase in the birth rate was caused by the requirement for all sole proprietors to register in the Commercial Register.
Data for the United States follow ISIC Rev. 3; also, in Figures 4.1 and 4.2, data for the period 2006-2007 are compiled according to ISIC Rev. 3 for European countries.
For Australia, Korea, and Mexico, enterprise births and indicators derived from enterprise births do not take into account the transition of enterprises from zero employees to one or more employees, i.e. the transition of a non-employer enterprise to an employer enterprise is not considered as an “employer enterprise birth”.
In Figure 4.1, for the United Kingdom data for two-year-old enterprises are estimates.
Source
OECD Structural and Demographic Business Statistics (SDBS) (database), https://doi.org/10.1787/sdbs-data-en.
Counts of Australian Businesses, including Entries and Exits. 8165.0, https://doi.org/10.1787/sdbs-data-en.
Further reading
Ahmad, N. (2006), “A Proposed Framework for Business Demography Statistics”, OECD Statistics Working Papers, No. 2006/3, OECD Publishing, Paris, https://doi.org/10.1787/145777872685.
OECD/Eurostat (2008), Eurostat-OECD Manual on Business Demography Statistics, OECD Publishing, Paris, https://doi.org/10.1787/9789264041882-en.