Chapter 1. How are we doing? A broad assessment of labour market performance1
This chapter develops a framework for assessing labour market performance and applies it to OECD countries and a number of emerging economies. The framework is multi-dimensional and is intended to help guide the reassessment and updating of the OECD Jobs Strategy. The framework covers not only the quantity and quality of jobs, but also different aspects of labour market inclusiveness, a topic that has received less attention from researchers. After a short review of the key indicators of the quantity and quality of jobs, the chapter analyses the measurement of labour market inclusion in much greater detail. In particular, three complementary indicators of different aspects of inclusiveness are proposed, namely, the low income rate for the working-age population, the gender gap in labour income, and the employment gaps for five disadvantaged groups. The performance of a number of countries shows that it is possible to do well in creating more and better jobs that benefit all segments of society.
Key findings
This chapter assesses labour market performance in OECD countries, along with countries in the process of accession to the OECD (Costa Rica, Colombia and Lithuania), and key partner countries (Argentina, Brazil, China, India, Indonesia and South Africa). Performance is measured along a number of dimensions encompassing the quantity and quality of jobs that are available and the overall inclusiveness of the labour market in providing good employment opportunities for all. It uses a measurement framework developed as part of the new OECD Jobs Strategy.2
Key findings include:
-
The short-term labour market outlook for OECD countries is subdued yet generally favourable. Employment and unemployment rates are expected to continue to slowly improve in most OECD countries in the context of moderate growth. The OECD average unemployment rate is projected to inch downwards from 6.2% in Q4 2016 (39 million unemployed persons) to 5.7% in Q4 2018. While employment is projected to grow at an annualised rate of just over 1%, a considerable part of this growth will be absorbed by rising labour force participation, muting the impact in lowering the unemployment rate. Nevertheless, ten years after the onset of the global financial and economic crisis, the unemployment rate for the OECD area will have returned to approximately its pre-crisis level, while the employed share of the working-age population will be moderately higher.
-
Despite these positive developments, not all segments of society are benefitting from the labour market recovery. A broader and deeper benchmarking of labour market performance is needed, going beyond aggregate developments in employment and unemployment. Therefore this chapter presents a conceptual framework that has been developed for the new OECD Jobs Strategy which defines labour market performance along three dimensions: the quantity and quality of employment (dimension 1); labour market inclusiveness (dimension 2); and resilience and adaptability (dimension 3). This chapter presents the framework and a performance scoreboard showing how countries compare based on the first two dimensions. The performance scoreboard will be updated regularly to monitor future progress in improving labour market performance.
-
The three indicators adopted for the quantity of jobs are the overall employment rate, the full-time equivalent employment rate and the unemployment rate, all of which have long served as key measures of labour utilisation. The three indicators adopted for job quality are taken from the OECD Job Quality framework that was first presented in the 2014 Employment Outlook and subsequently adopted also by the G20. These are the indicators for earnings quality, labour market security and the quality of the working environment. As proposed in the 2015 Employment Outlook, an alternative measure of the quality of the working environment is also considered, so as to allow better coverage of emerging economies.
-
The chapter develops a new measurement framework for labour market inclusiveness that captures the multi-dimensional character of this concept while being operational. Three inclusiveness indicators are proposed:
-
The low income rate for the working-age population;
-
The gender gap in labour income;
-
The average employment gap for five disadvantaged groups.
-
-
The three indicators, each, for the quantity of employment, job quality and labour market inclusiveness are combined in a scoreboard of labour market performance. Based on data for 2015 and changes in those indicators over the previous decade (i.e. since the last reassessment of the Jobs Strategy in 2006), the following elements emerge:
-
Countries do not face strong trade-offs between performing well in one dimension and less well in another. For example, high rates of employment do not come at the expense of job quality. Generally, most countries perform at a similar level (in terms of their cross-country ranking) across the nine performance indicators. Nonetheless, there are a few notable exceptions where certain countries perform very well on some indicators and near the bottom of the distribution on others.
-
The Nordic countries score relatively well on most or all indicators along with Switzerland, while Germany and the Netherlands score in the upper third of the distribution on more than one-half of the indicators. Among the OECD countries scoring in the bottom third of the distribution on the majority of indicators are a number of Mediterranean (Greece, Italy, Spain and Turkey) and Latin American (Chile and Mexico) countries. Belgium, Korea, Japan and several Central European countries combine strong performance in several areas with much weaker performance in other areas.
-
Over the past decade, the deep and prolonged economic crisis led to a worsening of labour market security that has not yet fully reversed and low income rates increased. At the same time, however, most countries managed to narrow the gender labour income gap, better integrated disadvantaged groups into the labour market and raised the quality of the working environment, while earnings quality was more or less stable. Those European countries that were badly hit by the financial crisis and had to exercise significant fiscal restraint experienced worsening performance in many indicators. By contrast, Germany, Israel and Poland stand out for having achieved significant improvements along at least five of the nine performance dimensions, while being approximately stable along the other dimensions. Finally, many Anglo-Saxon countries are characterised by the stability of their performance over time.
-
Introduction
The OECD is currently reviewing and expanding its Jobs Strategy, a comprehensive set of employment policy guidelines for national governments. A precondition for analysing labour market policy choices is to accurately assess labour market performance. This, in turn, requires a conceptual framework for measuring performance in order to study how outcomes are affected by policy choices and the changing economic, technological and demographic context. In order to meet this need, this chapter develops such a framework and applies it to assess recent labour market performance in OECD countries, along with accession and key partner countries.
This chapter is organised as follows. Section 1 provides a brief overview of aggregate labour market conditions, both current conditions and the short-term outlook according to OECD projections. However, this only provides a very partial picture of labour market performance and therefore the rest of the chapter focusses on the presentation and empirical application of a measurement framework capable of providing a broader and more detailed analysis which can inform the reassessment and updating of the OECD Jobs Strategy. Section 2 presents the conceptual framework that has been adopted for the new Jobs Strategy. The framework adopts a multi-dimensional concept of labour market performance that encompasses the quantity and quality of employment, labour market inclusiveness, and the resilience and adaptability of labour markets. Section 3 continues with a succinct review of the key indicators of the quantity and quality of jobs, which are already well established in the policy research literature. Section 4 then analyses the measurement of labour market inclusion, which has hitherto received relatively little attention from researchers.3 Three complementary indicators of different aspects of inclusiveness are proposed. Section 5 pulls together the material in Sections 3 and 4 by proposing a scoreboard of nine labour market indicators that, taken together, provide a broad yet relatively parsimonious overview of labour market performance. Another advantage of the scoreboard is that it can be easily updated so as to monitor future progress in improving labour market outcomes. A short concluding section considers next steps.
1. Current labour market conditions and the short-term outlook
Global growth is set to improve modestly thanks to an upturn in investment, trade and manufacturing output. After having averaged only about 3% per year during 2012-16, real global GDP growth is projected to pick up modestly to 3.6% in 2018, mostly due to improving growth prospects of several non-OECD G20 countries, including Brazil and Russia (OECD, 2017d). Real GDP growth in the OECD area was just 1.8% in 2016 and is projected to rise only to 2.1% in 2018 (see Table 1.A1.1 in the online annex at OECD, 2017b). While this modest recovery remains vulnerable to financial risks and policy uncertainty, the baseline OECD projection implies a continuation of the slow improving trend in labour market conditions, albeit with considerable variation across countries.
The broad-based, but slow, economic recovery was reflected in employment growth in 2016 of 1.6% for the OECD area and somewhat more rapid growth of 1.8% in the euro area (see Table 1.A1.1 in the online annex at OECD, 2017b). The employed share of the population aged 15 to 74 years rose for the third consecutive year in 2016, reaching 61% in the fourth quarter of 2016, placing it above its business-cycle peak in Q4 2007 (60.8%). It is expected to increase further over the next two years to reach 61.8% by Q4 2018 (Figure 1.1, Panel A). Employment rates range from below 55% in Greece, Italy, Spain and Turkey to more than 70% in Iceland, New Zealand and Switzerland – and these differences are not projected to diminish much in the next two years.
Another indication of improving labour market conditions is the decline in the OECD average unemployment rate to 6.2% in the fourth quarter of 2016, corresponding to 39 million unemployed persons (Figure 1.1, Panel B). Unemployment rates were below 4% in the Czech Republic, Iceland, Japan, Korea and Mexico, and below 5% in a further eight OECD countries (see Table 1.A1.2 in the online annex at OECD, 2017b). By contrast, the unemployment rate was 23.4% in Greece and 18.7% in Spain, and also exceeded 10% in Italy, Portugal and Turkey, although it has been falling in all of these countries except Turkey. The OECD average unemployment rate is projected to decline further to 5.7% by the last quarter of 2018, which is slightly above its value in Q4 2007 (5.6%).4 The improving unemployment situation is likely to lead to a reduction in the incidence of long-term unemployment, which still represented nearly one in three unemployed persons in the OECD area the fourth quarter of 2016.
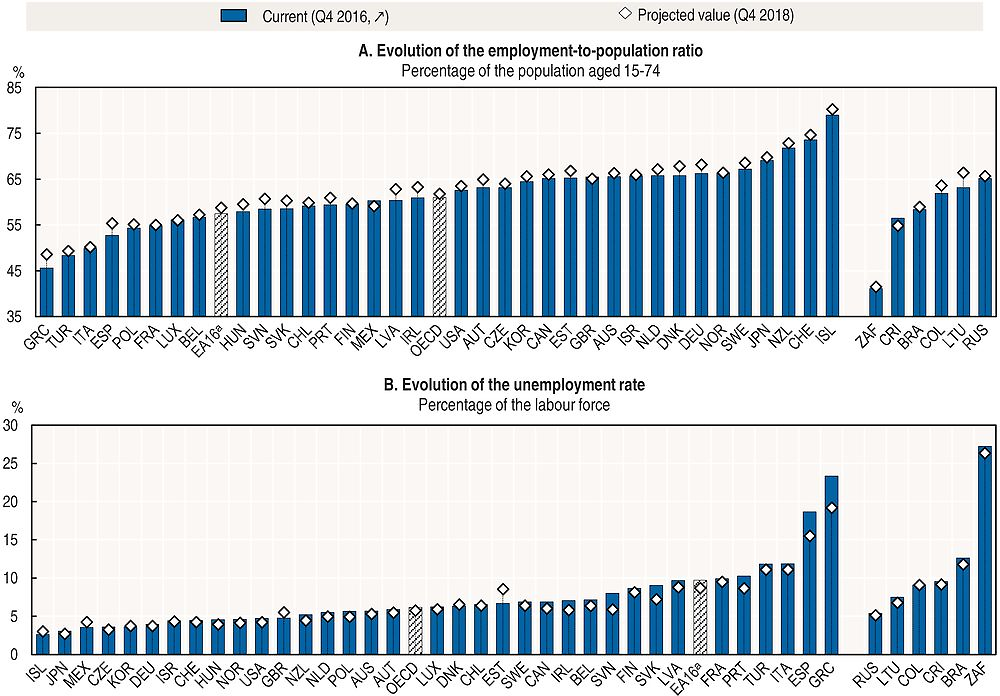
Note: OECD and euro area are weighted averages.
a. Aggregate of 16 OECD countries of the euro area.
Source: OECD calculations based on OECD Economic Outlook Database (https://stats.oecd.org/index.aspx?DataSetCode=EO).
2. Towards a broad assessment of labour market performance
Despite these positive developments, not all segments of society are benefitting from the ongoing labour market recovery. A broader and deeper assessment of labour market performance is needed which goes beyond aggregate employment and unemployment. Therefore, this section presents the conceptual framework for measuring and assessing labour market performance that has been developed for the new Jobs Strategy. Section 3 then begins the analysis of performance indicators by reviewing the already widely accepted indicators that are available for job quantity and job quality. The more novel issue of measuring labour market inclusiveness is deferred to Section 4.
Labour market performance within the new OECD Jobs Strategy framework
The principal objective of the OECD Jobs Strategy is to promote policies and institutions that can foster sustained improvements in individual and societal well-being through stronger labour market performance, inclusiveness and economic growth. As such, the OECD Jobs Strategy is an integral part of the OECD Inclusive Growth initiative which focuses on “economic growth that creates opportunity for all segments of the population and distributes the dividends of increased prosperity, both in monetary and non-monetary terms, fairly across society” (OECD, 2015a, pp. 84-85). The new OECD Jobs Strategy will be a key pillar of the OECD Inclusive Growth initiative given that labour market outcomes are crucial for ensuring the strength but also the inclusivity and social sustainability of economic growth.
For the purposes of the new OECD Jobs Strategy, labour market performance is characterised along three complementary dimensions that are key for inclusive growth and well-being more generally (see Figure 1.1):
-
More and better jobs. This captures the current labour market situation in terms of both the quantity of jobs (e.g. employment, working time) as well the quality of jobs by taking account of the three dimensions of the OECD Job Quality framework that are key for worker well-being: i) earnings quality; ii) labour market security; and iii) the quality of the work environment.
-
Inclusive labour markets. This dimension focuses on the distribution of outcomes and opportunities across individuals and households. This includes the share of income going to labour, the distribution of individual earnings and household incomes, and differences in access to jobs and job quality outcomes between different socio-economic groups, with a focus on gender equality. It also includes dynamic aspects of inequality related to the prospects for social mobility and career advancement.
-
Adaptability and resilience. This dimension relates to the effectiveness with which individuals and societies absorb, adapt to, and make the most out of, on the one hand, idiosyncratic, occupation/sector-specific and aggregate shocks, which arise as a result of economic crises, the continuous process of creation and destruction of jobs, firms and activities (creative destruction), and, on the other hand, long-term structural changes arising from a number of megatrends such as technological change, climate and demographic change and globalisation.
These three dimensions should be considered jointly when assessing labour market performance and the role of policies and institutions. The first two dimensions focus on current outcomes for individuals and their distribution. The third dimension contains a forward-looking element by focusing on the ability of workers and labour markets to withstand shocks and seize new opportunities. The experience of the recent global economic and financial crisis has highlighted the importance of fostering greater resilience to economic shocks (see Chapter 2 of this publication), while concerns about the labour market impacts of new technologies and globalisation (see Chapter 3 of this publication) underlie the importance of adaptability. More generally, adaptability and resilience are essential to ensure the sustainability of good labour performance in a constantly evolving world. They also help ensure that the labour market contributes to the achievement of sustained and inclusive growth.
The new OECD Jobs Strategy will identify the key policy packages that are required to obtain good labour market performance, defined in this manner. It will also build on and complement the other key strategies of the Organisation, including the OECD Growth Strategy, the OECD Skills Strategy, the OECD Innovation Strategy, the OECD Green Growth Strategy and the OECD Recommendations on Gender Equality, Mental Health and Ageing. However, the focus in this chapter is on the narrower question of how best to measure labour market performance as defined by this framework, albeit only as regards the first two of the three pillars of performance.5
3. The quantity and quality of employment
This section sets out a number of standard indicators to compare the performance of countries along the dimension of job quantity and job quality. The more novel and challenging issue of measuring labour market inclusiveness is discussed in the following section.
Jobs quantity
The most familiar goal of employment policies is to improve the quantity of jobs by promoting labour force participation and job creation. The two primary measures of employment quantity were already presented in Section 1, namely the employment and unemployment rates. The key question is whether these measures provide a sufficiently complete overview of the performance of the labour market in utilising the available potential labour supply. Figure 1.2 explores this question by juxtaposing the employment rate with two measures that take account of hours worked (Panels A and B) and the unemployment rate with two additional measures of labour market slack (Panels C and D). This simple exercise suggests the following conclusions:
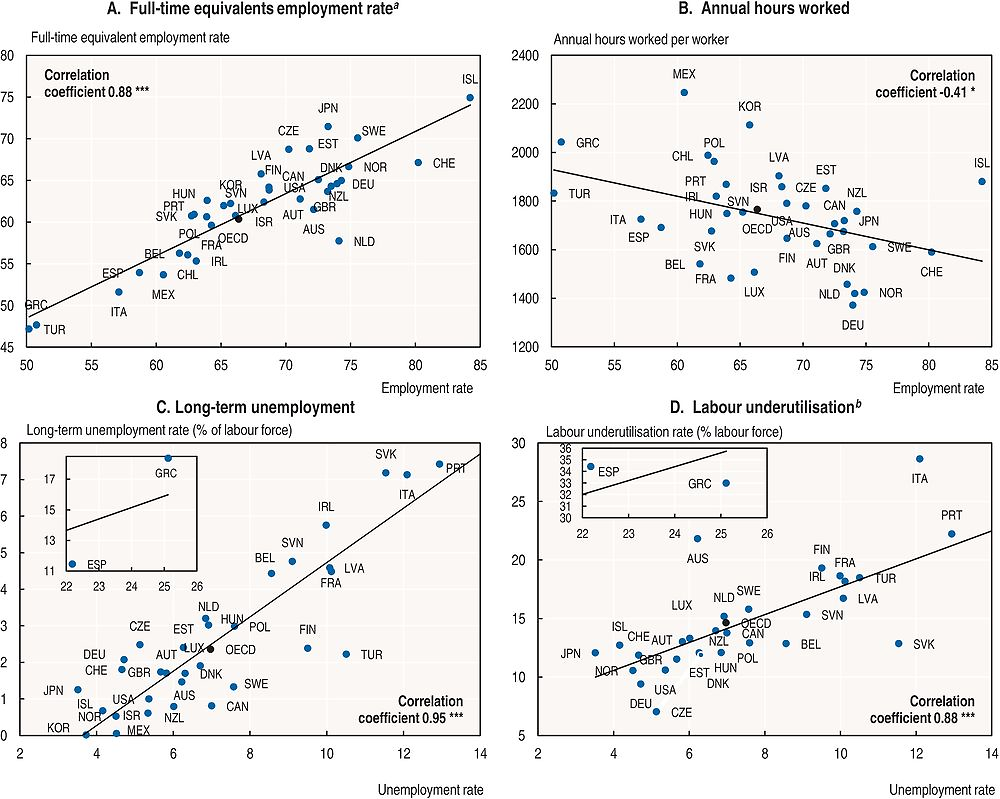
Note: Correlation coefficient is statistically significant at 0.1% level (***), at 1% level (**) or at 5% level (*). Data for the OECD are weighted averages.
a. Employment rate in full-time equivalent units is defined as employment rate of the working-age population adjusted by a ratio of average usual weekly hours worked by all workers and average weekly hours worked by full-time workers (according to national definition of full-time employment).
b. The labour underutilisation rate is defined as the combined number of persons who are unemployed, marginally attached (i.e. persons not in the labour force who did not look for work during the past four weeks but who wish and are available to work) or underemployed (full-time workers working less than usual during the survey reference week for economic reasons and part-time workers who wanted but could not find full-time work), expressed as a percentage of the labour force.
Source: OECD calculations based on Labour Force Survey results (full-time equivalent employment rate and labour underutilisation) and the OECD Employment Database (www.oecd.org/employment/emp/onlineoecdemploymentdatabase.htm) for the remaining indicators.
-
Data on hours worked provide an important supplement to the employment rate when benchmarking countries as regards their success in mobilising potential labour supply, since they take account of the intensity of employment. For example, Panel A shows that the employment rate is very similar in Japan and the Netherlands, but the full-time equivalent employment rate is considerably higher in Japan (71.5% as compared to 57.7%). Annual hours worked per worker is less strongly correlated with the employment rate than is the full-time equivalent employment rate and, thus, potentially offers more independent information (Panel B). However, a substantial part of the extra variation that this indicator adds reflects the tendency for annual working time to decrease as an economy develops and living standards improve. It follows that the relatively high hours of annual employment in e.g. Mexico do not provide a useful benchmark for how well higher-income countries are utilising the available labour supply.6 These considerations motivate the choice to add full-time equivalent employment rate as a third indicator of employment quantity.
-
The unemployment rate is a good summary indicator of labour market slack. In particular, the overall unemployment rate is very strongly correlated with the incidence of long-term unemployment (a cross-country correlation coefficient of 0.95 in Panel C). While labour market programmes often need to devote particular attention to the long‐term unemployed, cross-country differences in the overall unemployment rate in a country provide a good proxy measure of differences in the risk of long-term unemployment. The same argument applies to labour utilisation (Panel D) – a broader indicator of labour market slack that supplements unemployment with several types of not too dissimilar joblessness (e.g. discouraged workers and other people of working age marginally attached to the labour force) and involuntary part-time employment – albeit not quite so strongly (correlation coefficient of 0.88). In the interest of parsimony, the unemployment rate is the only measure of labour market slack that will be retained in the labour market performance scoreboards.
Jobs quality
Job quality is an inherently multi-dimensional concept that refers to those job attributes that contribute to the well-being of workers. Building on the influential report by the Stiglitz-Sen-Fitoussi Commission (Stiglitz et al., 2009), which identified eight dimensions of well-being, the OECD Job Quality framework was developed (OECD, 2014). It is structured around three of those eight dimensions that are closely related to people’s employment situation, namely material living standards, insecurity of an economic as well as physical nature, and personal activities including work. The development of the OECD Job Quality framework led to the construction of indicators for each of these dimensions, drawing on the existing literature in economics, sociology and occupational health, as well as pragmatic considerations of obtaining measures that could be easily obtained for most countries and were available at the individual level (Cazes et al., 2015). Since this framework has been widely endorsed (for example, by the G20 at the summit in Ankara in September 2015), it is also adopted here as a key component of the labour market performance measurement framework for the new Jobs Strategy.
The OECD Job Quality framework measures job quality along three dimensions:
-
Earnings quality. Earnings quality refers to the extent to which the earnings received by workers in their jobs contribute to their well-being by taking account of both the average level as well as the way earnings are distributed across the workforce.
-
Labour market insecurity. Labour market insecurity measures the risk of unemployment (the risk of becoming unemployed and the expected duration of unemployment) and the degree of public unemployment insurance (coverage of benefits and their generosity).
-
The quality of working environment. The quality of working environment captures non‐economic aspects of job quality and measures the incidence of job strain that is characterised by a combination of high job demands and few job resources to meet those demands. The incidence of very long hours of work is also used as an alternative indicator of the quality of the working environment since the data required to measure job strain are not available in most emerging economies (OECD, 2015d).
Figure 1.3 shows that the quality of jobs, as measured along all three dimensions, varies greatly across countries.7 Figure 1.3 also juxtaposes the four job quality indicators with the employment rate of the working-age population. Overall, higher employment rates are associated with better job quality,8 suggesting that there is no necessary trade-off between the quantity and quality of jobs.9 Despite this positive association, there tends to be a high variability of job quality levels among countries with similar employment levels. For example, Estonia and Denmark have similar employment rates, but earnings quality is much higher in Denmark.
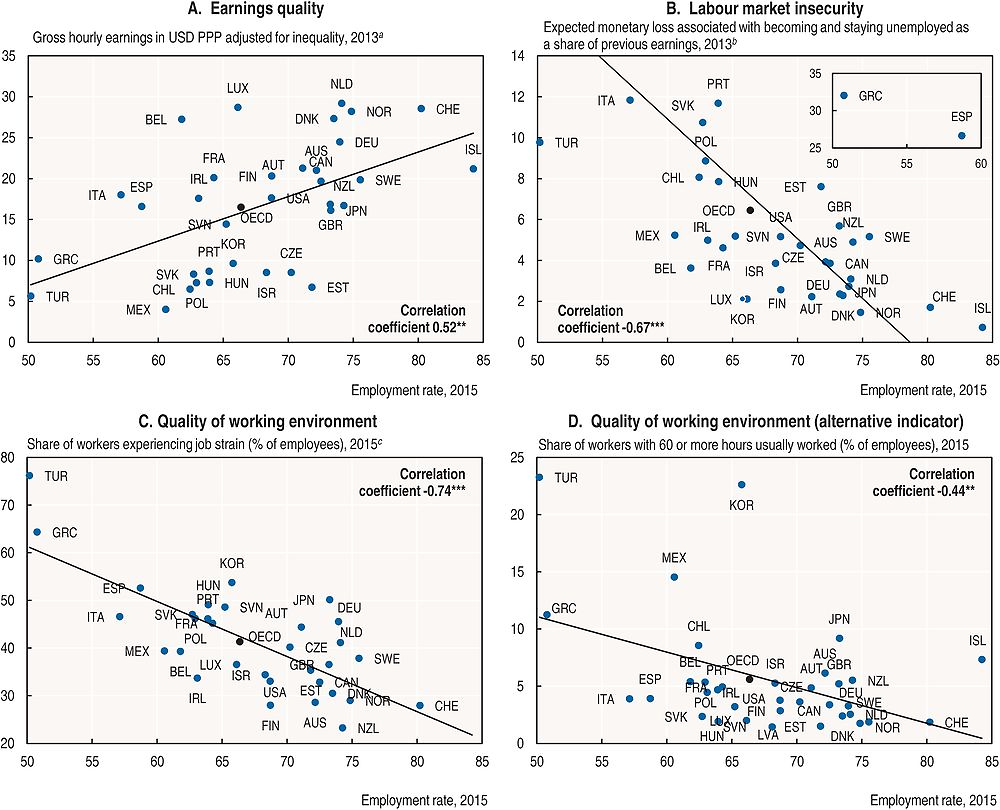
Note: Correlation coefficient is statistically significant at 0.1% level (***), at 1% level (**) or at 5% level (*). Data for the OECD are unweighted averages for job quality measures and a weighted average for the employment rate.
a. Data refer to 2013 except for Estonia, Luxembourg, the Netherlands and Turkey (2010); Israel (2011); France, Italy, Poland, Spain, Sweden and Switzerland (2012) and Canada, the Czech Republic, Hungary, Korea, Mexico, Norway, the Slovak Republic, the United Kingdom and the United States (2014).
b. Data refer to 2013 except for Chile (2011).
c. Data refer to 2015 except for Australia, Canada, Israel, Japan, Korea, Mexico, New Zealand, Switzerland and the United States (2005) and Norway and Turkey (2010). No data available for Chile and Iceland.
Source: OECD calculations based on the OECD Job Quality Database, www.oecd.org/statistics/job-quality.htm and the OECD Employment Database, www.oecd.org/employment/emp/onlineoecdemploymentdatabase.htm.
4. Labour market inclusiveness
While it is widely agreed that labour market inclusiveness represents a key component of labour market performance, there is no commonly agreed upon framework for measuring and assessing inclusiveness. Therefore, this section proposes three summary indicators of labour market inclusion that are intended to facilitate comparative assessments of performance, both internationally at a point in time and over time within the same country. As with job quality, a multi-dimensional approach is adopted that focusses on three important aspects of how successfully a national labour market fosters full and equal participation of all groups in the working-age population as well as access to good job opportunities.10 The three indicators are: i) the share of the working-age population with incomes below 50% of median income; ii) the gender gap in labour income; and iii) the gap in employment rates between selected disadvantaged groups and prime-age men. Each of these dimensions is discussed in turn.
Income disparities in the working-age population remain high
An inclusive society should ensure that every person of working age has a fair chance to benefit from labour market opportunities. Since labour income – along with unemployment and related out-of-work transfers and the taxation of employment-related income – is a key determinant of household disposable income for the working-age population, particularly for those with lower incomes (see e.g. OECD, 2011), an inclusive labour market can make an important contribution to assuring that everyone receives a fair share of the fruits of economic growth. This suggests that one important characteristic of an economy with an inclusive labour market is that the income share commanded by those at the bottom of the distribution will not be too low and relatively few working-age persons will have disposable incomes that lie far below the median income. In the present framework, low income is defined as below 50% of the median. Household disposable income is preferred here to before-tax income since unemployment benefits and related out-of-work transfers, and the taxation of employment-related income are key elements of labour market policy that have a key direct impact on inclusiveness. Alternative measures of the incidence of low income based on household market income or individual labour income are presented in online Annex 3.A2 (OECD, 2017b) and shown to be strongly correlated with the measure retained here.11
Figure 1.4 shows that, on average in the OECD area, 10.6% of people of working age had equivalised disposable household income12 lower than 50% of the median in 2013. This percentage – which will be called the low income rate13 in the remainder of this chapter – rose between 2006, when it was 9.5%, and 2013, probably due in part to the global financial crisis.14 The OECD average low income rate, however, masks wide cross-country differences in any given year and, in some cases, diverging trends. Among the best performers, the low income rate is below 7% in the Nordic countries, such as Iceland and Denmark, as well as in the Czech Republic and Switzerland. At the other extreme, more than 15% of the working-age population experience relatively low incomes in Greece, Spain and the United States. The low income rate increased by more than half a standard deviation in 15 of the 35 OECD countries, while decreasing by at least half a standard deviation in only Chile, Korea and New Zealand.15
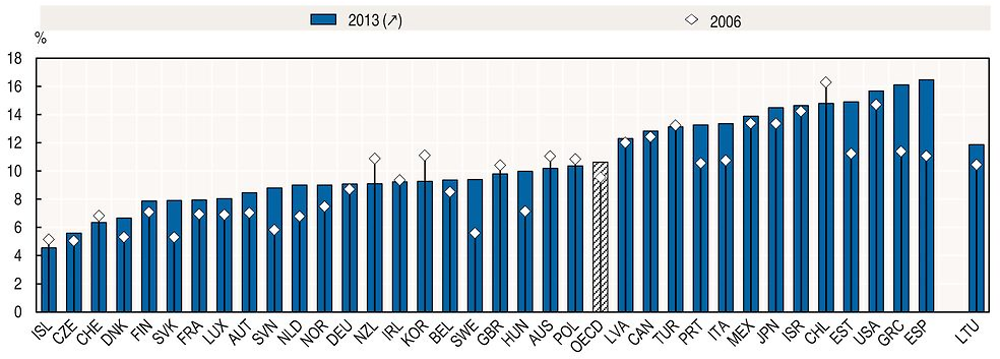
Note: Countries are sorted in order of inclusiveness in 2013 (i.e. best performer on the left). Data for the OECD is an unweighted average.
← a. Data refer to 2006 except for New Zealand (2003); Australia, Germany, Mexico, Norway and Sweden (2004); France, Hungary, Israel, Switzerland and the United States (2005).
← b. Data refer to 2013 except for Japan and New Zealand (2012); Australia, Finland, Hungary, Korea, Mexico, the Netherlands and the United State (2014).
Source: OECD calculations based on the OECD Income Distribution Database (IDD), http://oe.cd/idd.
In sum, inclusiveness in the sense of minimising low income exposure and intensity varies considerably across OECD countries and the share of working-age persons with disposable household incomes below 50% of the median provides a good indicator of this dimension of labour market inclusiveness.
Having more and better jobs is often the best way to avoid that people are left behind…
Access to good-quality employment is a major factor limiting the low income risk faced by households with a head of working age. In all countries, the low income rate among workless households – defined as households in which no member spent time in gainful employment during the survey year – is many times higher than the rate observed among households with at least some work during the year (Figure 1.5, Panel A). For example, the OECD average low income rate for workless households was 45.2% in 2013, as compared to 7.1% for households with at least some work.16 Moreover there is quite a strong negative cross-country correlation between employment rates and low income rates (Figure 1.5, Panel B). Taken together, these two facts clearly suggest that having a job is often the best antidote to poverty.
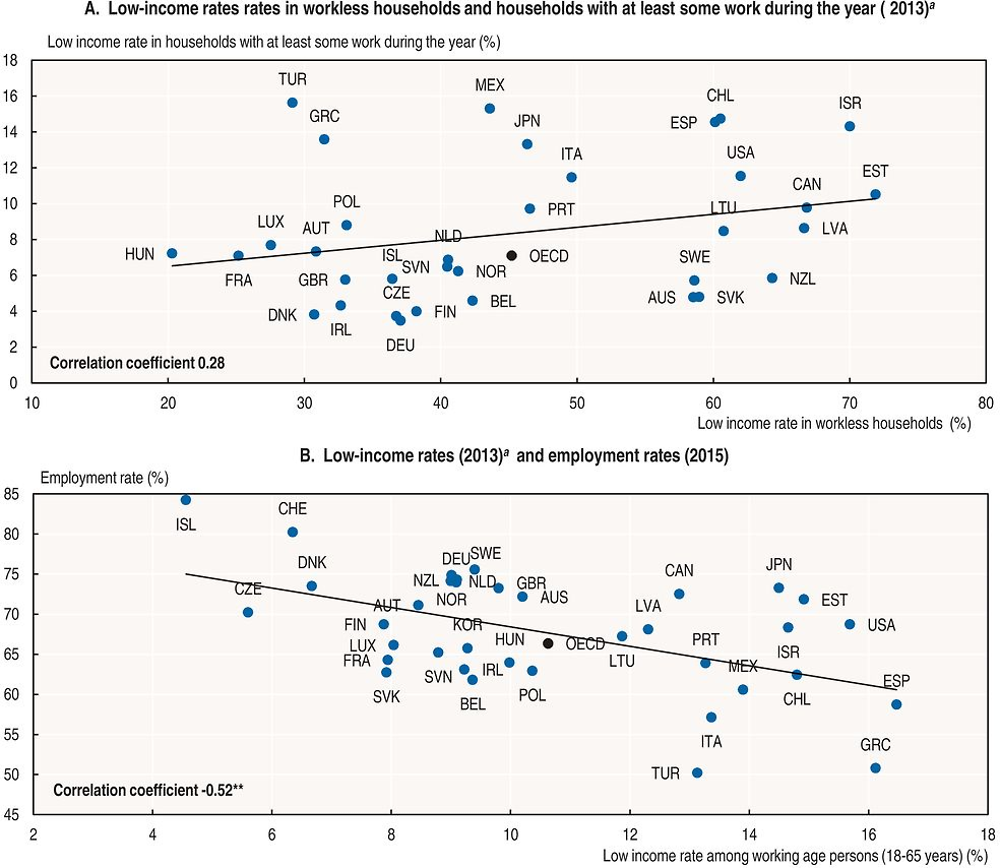
Note: Correlation coefficient is statistically significant at 0.1% level (***), at 1% level (**) or at 5% level (*). Data for the OECD are unweighted averages.
a. Data refer to: 2012 for Iceland (Panel A only), Japan and New Zealand; 2014 for Australia, Finland, Hungary, Korea (Panel B only), Mexico, the Netherlands and the United States.
Source: OECD calculations based on data from the OECD Income Distribution Database (IDD), http://oe.cd/idd, and the OECD Employment Database, www.oecd.org/employment/emp/onlineoecdemploymentdatabase.htm.
… but countries with similar employment rates may still have very different incidences of low income
However, high employment rates per se are no guarantee of greater inclusiveness, because many other factors also influence the disposable incomes of working-age households (e.g. the level of wage inequality, household structure and the tax/benefit system). Figure 1.5 illustrates the importance of these other factors. For example, the employment rates in Panel B are similar in the United States and Finland, but the low income rate is twice as large in the former country. The extent to which accessing some work reduces the risk of low household income also varies dramatically across countries in Panel A. For example, the low income risk for workless households is similar in Denmark and Turkey, but the low income rate for in-work households is far higher in Turkey. Similarly, the low income rate for in-work households is only a little higher in New Zealand than in Denmark, but is far higher for workless households. Equalising the access to employment is only one of the preconditions for lowering the risk of low incomes.
Gender disparities in labour income are decreasing but remain considerable
An inclusive labour market should also offer equal opportunities to men and women (OECD, 2013). The size of the gender gaps in employment rates, hours worked and hourly earnings are thus important indicators of the degree of labour market inclusion. The combined effect of gender disparities along all three of these dimensions is summarised by the gender gap in labour income, which is presented in Figure 1.6, Panel A. This gap is computed as the difference between men and women of their total before-tax annual labour income – including self-employment income.17 Labour income for both men and women is expressed in a per capita basis for persons of working age and the gender difference in these values is expressed as a percentage of the average per capita labour income of men.18
Gender gaps are falling in virtually all OECD countries. And this fall is significant: in 12 OECD countries, the gender gap in per capita labour income in 2014 is more than half of a standard deviation lower than it was in 2006. However, the gender gap in per capita labour income remains considerable in 2014, close to 40% on average. Nordic and Eastern European countries perform relatively well, with this gap being as low as 22% in Finland and Latvia. By contrast, gender gaps in labour income per capita are much larger in Greece and the Netherlands, as well as in German-speaking, Latin American and, especially, Eastern Asian countries, where they can be as large as 60%. These gaps are much larger than the more familiar gender wage gap, as published in the Statistical Annex of the OECD Employment Outlook (available online at OECD, 2017a). This difference illustrates how gender differences in employment rates and hours of work reinforce the impact of the gender wage gap in depressing the labour income of women relative to that of men.
In order to shed some light on the relative importance of different components of the gender gap in labour income, Panels B, C and D of Figure 1.6 show gender gaps in earnings of full-time employees, employment rates, and usual weekly hours worked per worker on the main job, respectively.19 There is considerable heterogeneity in the sources of gender disparities among the countries with relatively large overall gaps in labour income: large gaps in average hours worked play a key role in the Netherlands, Japan and German-speaking countries; whereas disparities in employment rates are the main source of gender income inequality in Greece, Turkey and Latin America; and gaps in earnings are important in Korea and Japan. In Estonia, a large earnings gap is counterbalanced by low disparities in employment and hours worked, thereby resulting in lower than average overall gender labour income inequality.
Employment of disadvantaged groups still lags behind in many countries
A number of workforce groups are often under-represented in the labour market because they face particular barriers to accessing good quality jobs and realising their work potential. These disadvantaged groups include both youth and older workers, especially those with low qualifications. They also include people with caring responsibilities, most often mothers with young children,20 people with disabilities and immigrants, especially those coming from outside the OECD area.21 These groups typically fare much less well in the labour market than prime-age men, although this observation by no means implies that the barriers faced by these groups are homogeneous.22
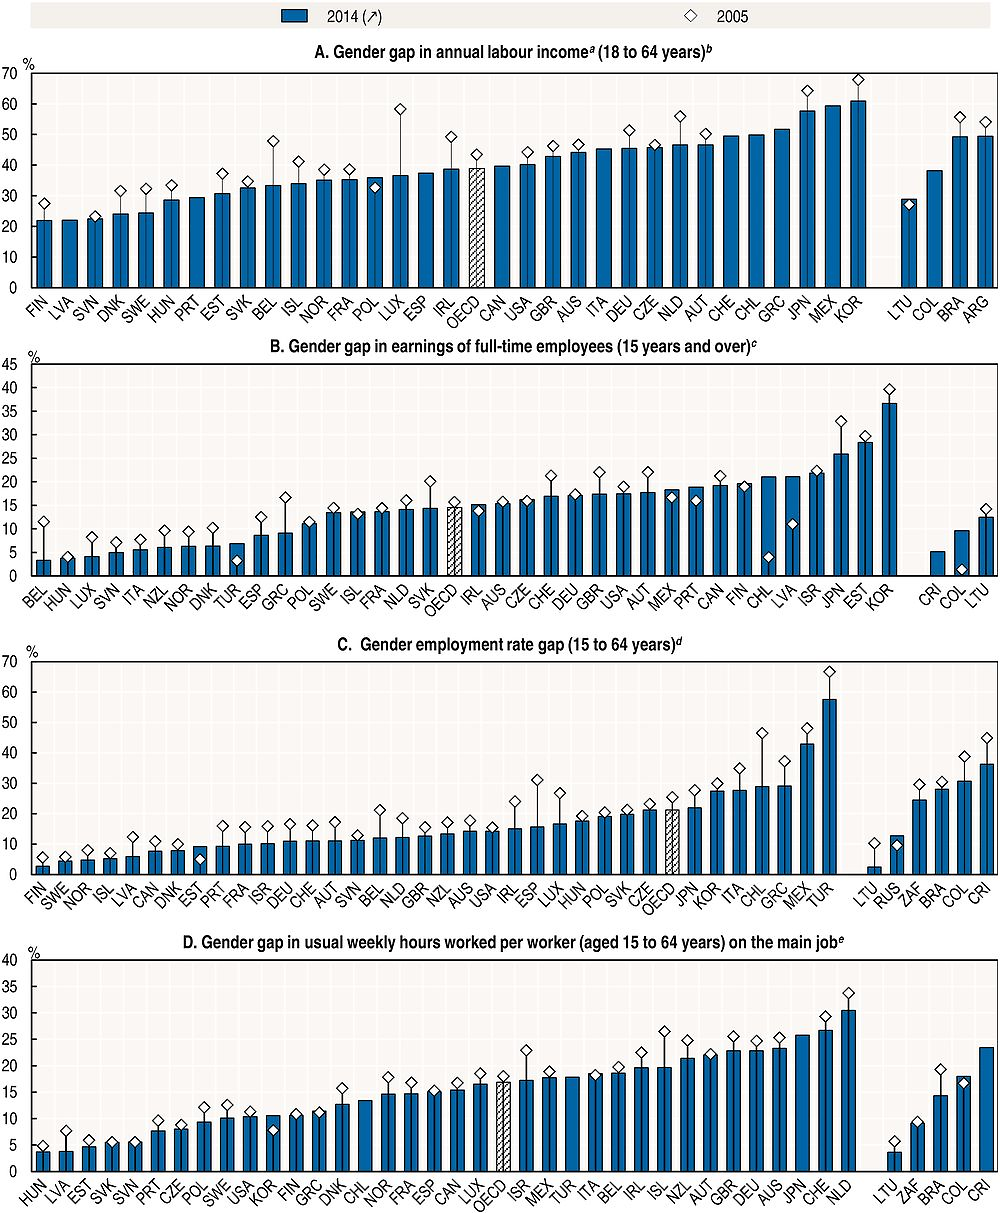
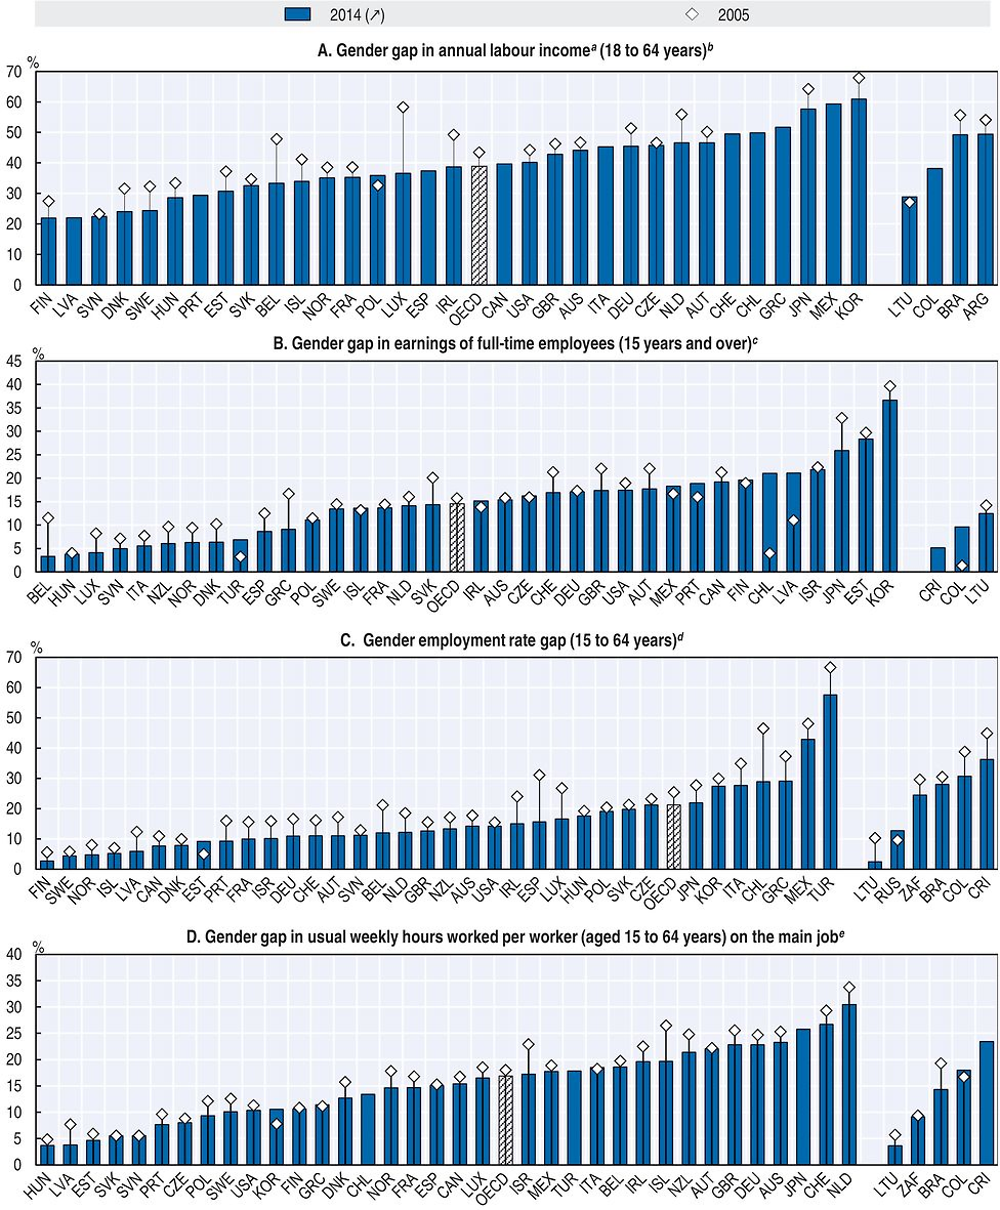
Note: Countries are sorted in ascending order representing increasingly poor performance. They are selected on the basis of data availability. Gaps computed as the difference of the relevant indicator for men and women expressed as a percentage of that of men.
a. Data for Japan exclude agriculture and forestry, fisheries, the public sector and firms with less than ten employees as well as self-employment and people aged less than 20 years. Data for Chile, Argentina and Brazil refer to monthly earnings and exclude self-employment.
b. Data for Japan refer to 2006 and 2015. Data for the OECD is an unweighted average.
c. Data refer to 2005 except for Chile, Estonia, Latvia, Lithuania, Luxembourg, the Netherlands, Poland, Slovenia, Switzerland and Turkey (2006), Colombia (2007) and Denmark (2008); and to 2013 except for Israel (2011), France and Spain (2012), Sweden (2013) and Chile (2015). Data for the OECD is an unweighted average.
d. Data refer to 2005 except for Colombia (2007). Data for the OECD is a weighted average.
e. Data for the OECD is a weighted average.
Source: Gender labour income gap: OECD calculations based on the European Union Statistics on Income and Living Conditions (EU-SILC) for European countries except Germany, Encuesta Permanente de Hogares (EPH) for Argentina, Household, Income and Labour Dynamics in Australia (HILDA) for Australia, Pesquisa Nacional por Amostra de Domicilio (PNAD) for Brazil, Labour Force Survey for Canada and the United States (CPS – Annual Social Economic Supplement), Encuesta de Caracterizacion Socioeconomica Nacional (CASEN) for Chile, Encuesta Nacional de Calidad de Vida (ECV) for Colombia, German Socio-Economic Panel (GSOEP) for Germany, Basic Survey on Wage Structure combined with Labour Force Survey results for Japan, Korean Labor and Income Panel Study (KLIPS) for Korea, and Encuesta Nacional de Ingresos y Gastos de los Hogares (ENIGH) for Mexico. For the remaining indicators, OECD Employment Database (www.oecd.org/employment/database) and OECD Earnings Distribution Database (www.oecd.org/employment/emp/employmentdatabase-earningsandwages.htm).
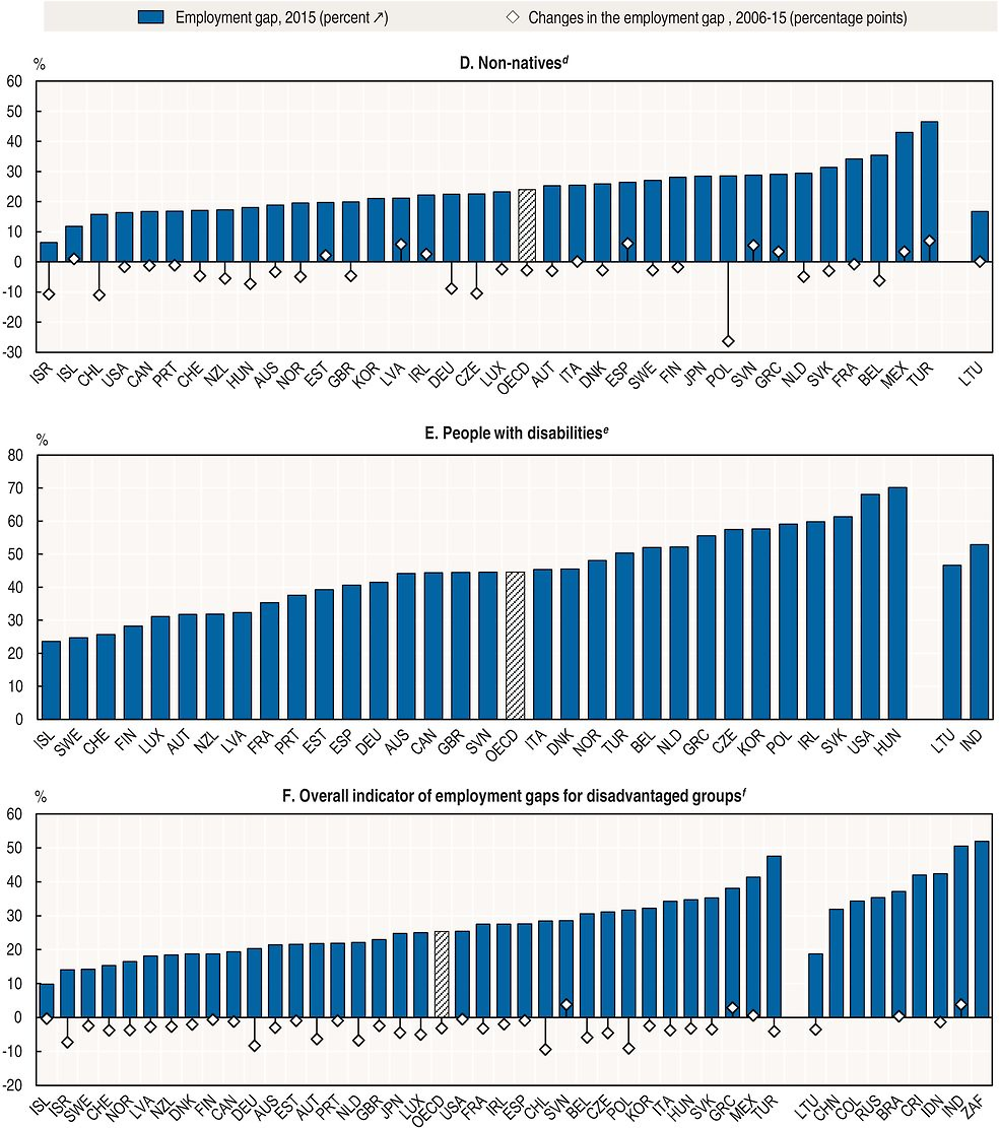
All five of the disadvantaged groups considered in Figure 1.7 (Panels A-E) fare worse in terms of employment rates than prime-age men (aged 25-54 years) in virtually all OECD member, OECD accession and G20 countries. Indeed, the only exception is youth in three countries.23 Employment rates are particularly low in the case of people with disabilities whose employment gap is 44% on average and can be as high as 70% (in Hungary). Interestingly, pairwise cross-country correlations of these employment gaps are always positive and they are significant in most cases.24 This suggests that countries that do well in integrating one disadvantaged group into employment typically do well in the integration of all other groups as well. Similarly, the employment gaps of all of the groups are significantly smaller in countries where the aggregate employment rate is higher,25 suggesting that these groups are the first to suffer from badly performing labour markets.
For most groups for which historical data are available, employment gaps with prime-aged men have narrowed since 2006. This is particularly evident for older workers, whose employment gap has shrunk by about 1 percentage point per year on average in the OECD area. Remarkable improvements in this respect are observed in Germany, Italy and the Netherlands. By contrast, the situation of youth is a worrisome exception. Indeed, youth were badly hit by the global recession and, in 2015, this group’s employment performance, adjusted for enrolment in full-time education, was still slightly worse than in 2007 in the OECD as a whole. The youth employment gap increased the most in Southern European countries, while Turkey exhibits the largest improvements, though from a very poor starting point. The evolution of the employment gap for mothers with children has been very disparate in Southern European countries, with Spain showing a reduction of more than 1.5 percentage points per year while Slovenia is the only country in which the employment gap for mothers with young children increased significantly. The evolution of the employment gap of immigrants varies substantially across countries, because the composition and size of the population of non-natives differs so much from one country to another (see e.g. OECD, 2015c). Considering only countries in which non-natives are more than 5% of the working-age population, it is noteworthy to observe that in Germany and Israel the employment gap of migrants fell by about 1 percentage point per year between 2006 and 2015, on average.26 By contrast, the employment gap of non-natives deteriorated by more than half of a percentage point per year during this period in Turkey27 and Spain.
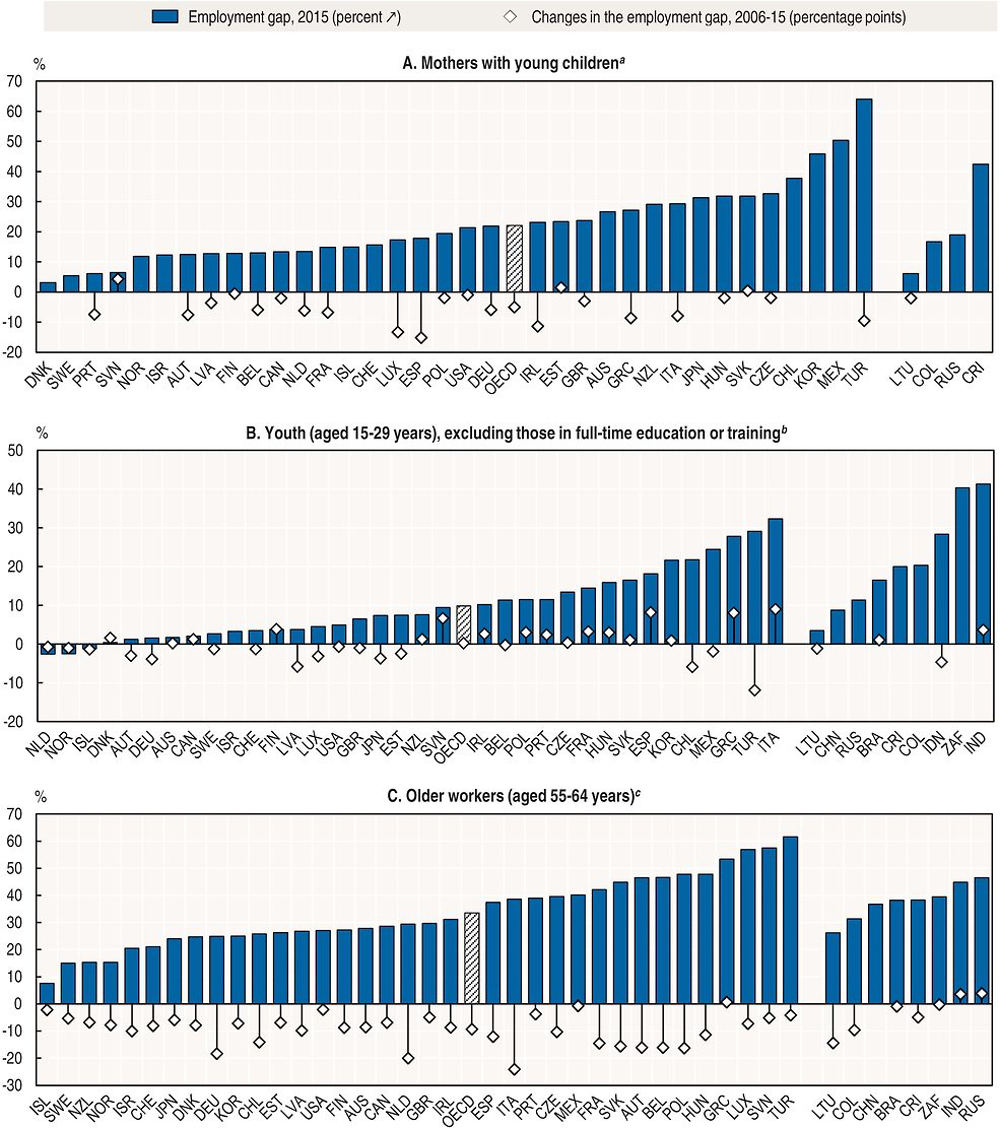
Note: Countries are sorted in ascending order of the employment gap (i.e. from best to worst performing). For each group, the employment gap is the difference between the employment rate of prime-age men (aged 25-54 years) and that of the group, expressed as a percentage of the employment rate of prime-age men.
a. Mothers with young children refer to working-age mothers with at least one child aged 0 to 14 years. The age of the youngest child is 0 to15 years in Canada, 0 to 18 years in Sweden and 0 to 17 years in the United States. In Canada, partnership status is based on civil status. For Costa Rica and Mexico, data cover mothers who are reported as the head of the household or the spouse/partner of the head of the household, only. In Japan, the employment status of mothers refers to households with a mother of all ages and at least one child aged 0 to 14 years. In Korea, data refer to mothers aged 25 to 54 years and in Sweden to mothers aged 15 to 74 years. Data refer to 2014 instead of 2015 except for Denmark, Finland and Korea (2012) and Chile, Germany and Turkey (2013). The starting year refers to 2006 except for the United States (2007).
b. In the case of youth, those that are in full-time education are excluded from the denominator of the employment rate. Data refer to 2015 except for China (2010), India (2011-12), Chile, Indonesia and Korea (2013) and Brazil and Israel (2014). The starting year refers to 2007 instead of 2006 except for Canada (2006) and Korea (2008).
c. Data refer to 2015 except for China (2010), India (2011-12), Indonesia (2013) and Brazil (2014). The starting year refers to 2006 except for Colombia (2005), India (2005-06) and China (2010).
d. Data refer to all foreign-born people with no regards to nationality and to 2015 except for Japan and Korea (2012-13) and Chile and the United States (2013). The starting year refers to 2006 except for Israel, Latvia and Lithuania (2006-07) and Canada and Turkey (2008).
e. Data refer to 2011 except for Canada and India (2012), New Zealand (2013), Australia and the United States (2015) and Norway (2016).
f. The overall indicator is a weighted average of the employment gaps for each group, adjusted for missing values.
Source: OECD calculations based on data from the OECD Employment Database (www.oecd.org/employment/emp/onlineoecdemployment database.htm), the OECD International Migration Database (www.oecd.org/els/mig/oecdmigrationdatabases.htm) and the OECD Family Database, (www.oecd.org/els/family/database.htm). Data for people with disabilities are OECD calculations.
The high pairwise correlations across the employment gaps for these five disadvantaged groups suggest that it is possible to construct a meaningful overall indicator of employment gaps for disadvantaged groups. Panel F presents such an indicator which is calculated as a weighted average of the employment gaps for each group, adjusting for missing values.28 This indicator shows that the average employment gap for groups at greater risk of labour market disadvantage was 25.4% in 2015, down by 3.2 percentage points since 2006.29 The overall indicator for disadvantaged groups ranges from an average of 10% in Iceland and around 15% in Israel, Sweden and Switzerland, at the low end, up to nearly 50% in Turkey, India and South Africa, at the high end.
5. A scoreboard of labour market performance in terms of job quantity, job quality and inclusiveness
Sections 3 and 4 presented various indicators of labour market performance that can be used to assess progress relative to the first two pillars of the new OECD Jobs Strategy framework, namely, more and better jobs, and labour market inclusiveness. Table 1.2 provides a summary overview of key indicators of job quantity, job quality and labour market inclusiveness that is intended to provide a parsimonious scoreboard of labour market performance. Table 1.2 includes:
-
Three indicators of employment quantity: the employment (headcount and full-time equivalent) and unemployment rates for the working-age population;
-
Three indicators of job quality: earnings quality, labour market security and the quality of working environment (including an alternative indicator of the quality of working environment, the incidence of very long working hours, that allows coverage to be extended to more emerging economies);30
-
Three indicators of labour market inclusiveness: the low income rate of the working-age population, the gender labour income gap and the employment gap for disadvantaged groups.
By providing a relatively concise yet broad summary of labour market performance, the scoreboard is intended to help ground the new OECD Jobs Strategy in a detailed understanding of how well different national labour markets are currently performing. Such a scoreboard can help to set policy priorities, by highlighting areas where performance is particularly weak. Another benefit of such a scoreboard is that it provides a clearer sense of how achieving a strong performance in one area, such as achieving a low unemployment rate, is related to other areas of performance. This can help to clarify whether certain policy packages can provide strong labour market performance along all dimensions or if certain trade-offs need to be confronted. Ideally, the scoreboard would also incorporate indicators of labour market resilience and adaptability, the policy goals highlighted by the third pillar of the OECD Jobs Strategy framework presented in Section 2. However, it was decided not to attempt such an extension until more research has been conducted on these complex topics. Chapters 2, 3and 4 of this publication represent precisely such research.31 Another limitation of the scoreboard is that it cannot capture very recent changes in performance in several areas (notably inclusiveness), as data for many variables become available with some delay. Last but not least, indicators of inclusiveness included in the scoreboard are static, while an inclusive labour market is also characterised by important dynamic aspects (e.g. high exit rate from low income status), which cannot be considered due to lack of comparable data for a sufficiently large number of countries (see e.g. OECD, 2015d for a life-cycle analysis ofearnings inequality and its determinants).
The choice of the three inclusiveness indicators that are included in Table 1.2 relies upon the discussion in Section 4. As is also the case for the three dimensions of job quality, the three inclusiveness measures are broadly complementary, while capturing distinct – albeit somewhat overlapping – dimensions of exclusion in the labour market (income inequality and poverty, gender disparities and poor labour market integration of disadvantaged groups). The robustness checks reported in Section 4 and online Annexes 1.A2 and 1.A3 (see OECD, 2017b) suggest that they provide a reliable indication of these three dimensions of inclusiveness, while making use of data sources that allow broad country coverage.32
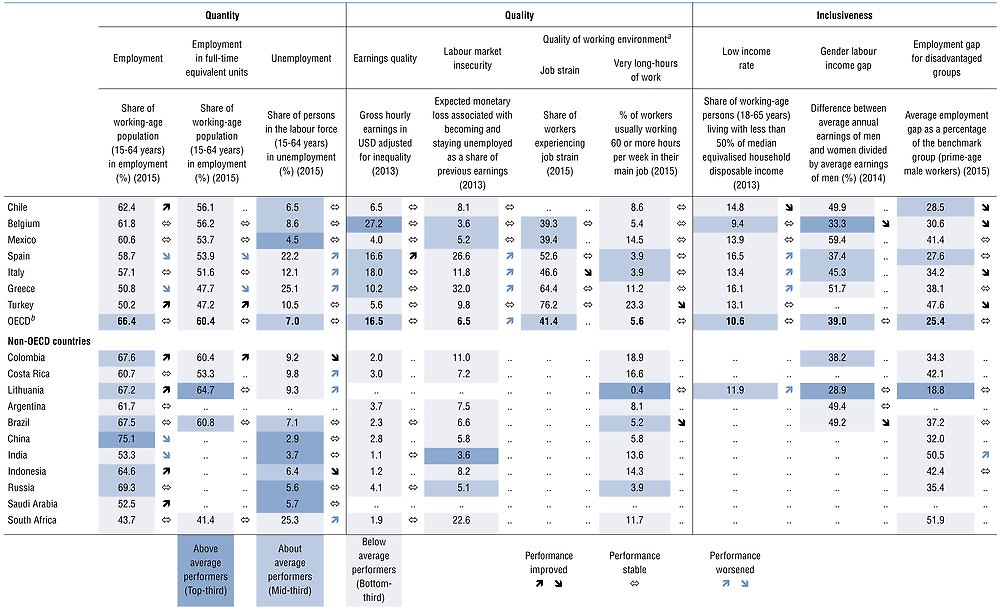
In order to facilitate a qualitative benchmarking of labour market performance along the nine different dimensions reported in Table 1.2, shading is used to indicate whether the data value in a particular cell falls in the top third of that variable’s distributions across OECD countries (dark blue), the middle third (medium blue) or the bottom third (light blue). OECD countries are also ordered, top to bottom, by the employment rate (as shown in column 1). A prevalence of dark blue cells is immediately evident in the upper part of the table, indicating that a substantial group of countries tend to be relatively strong performers across many of the nine dimensions. In particular, Nordic countries, such as Norway, Iceland, Denmark, but also, to a lesser extent, Sweden and Finland, are among the best performing countries across almost all the columns of the scoreboard. Switzerland and, to a somewhat lesser extent Germany and the Netherlands also score well in a number of areas, while at the other end of the performance spectrum a number of Mediterranean (Greece, Italy, Spain and Turkey) and Latin American countries (Chile and Mexico) as well as a few other emerging economies score relatively low on the majority of indicators. This visual impression is confirmed by pairwise correlations which are almost always statistically significant and confirm that countries that do well (poorly) in one dimension tend to do well (poorly) in many others.33
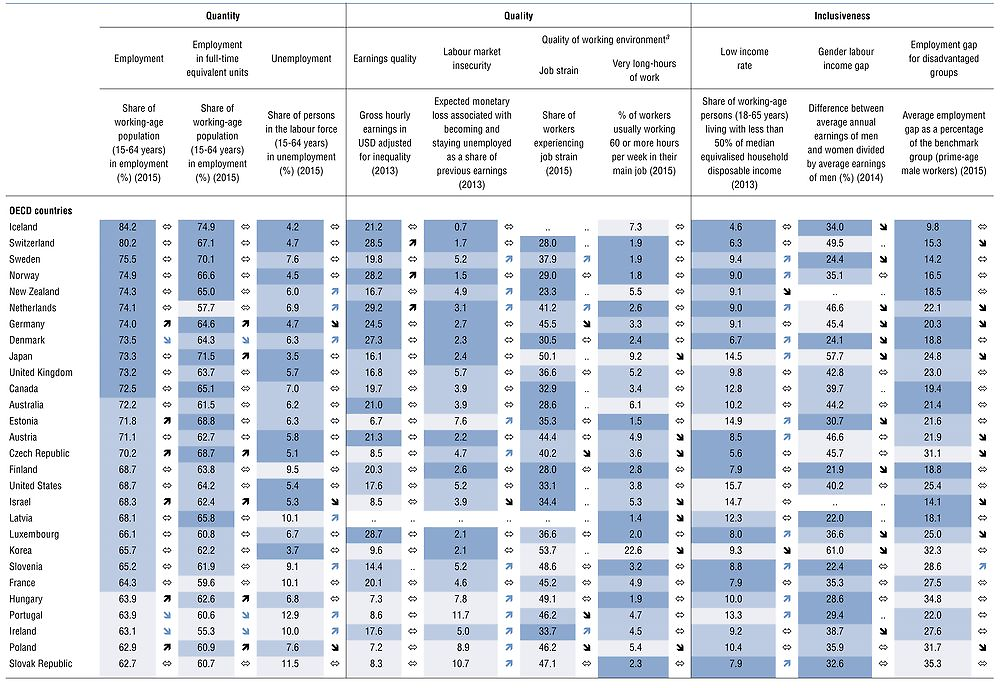
Note: The arrows to the right of each data cell indicate changes during 2006-15. Upward pointing, horizontal and downward pointing arrows represent, respectively, increasing, approximately stable and decreasing indicator values. The colour of the sloped arrows indicates whether the change for that indicator represented an improvement in performance (black) or worsening performance (blue). Depending on the indicator, an increase in its value may represent either improved performance (e.g. an increased employment rate) or worsened performance (e.g. an increased unemployment rate). A change in a performance indicator is considered to be significant when the absolute value of its annual average multiplied by ten is at least as large as one-half of the standard deviation of that indicator across OECD countries in 2015.
Job quantity: Data refer to 2015 except for Argentina and Brazil (2014), China (2010), India (2011-12) and Indonesia (2013).
Employment rate in full-time equivalent units is defined as employment rate of the working-age population adjusted by a ratio of average usual weekly hours worked by all workers and average weekly hours worked by full-time workers (according to national definition of full-time employment)
Job quality: Data on earnings quality refer to 2013 except for Estonia, Luxembourg, the Netherlands and Turkey (2010); Israel (2011); France, Italy, Poland, Spain, Sweden and Switzerland (2012); and Canada, the Czech Republic, Hungary, Korea, Mexico, Norway, the Slovak Republic, the United Kingdom and the United States (2014). Data on labour market security refer to 2013 except for Chile (2011). Data for job strain refer to 2015 except for Australia, Canada, Israel, Japan, Korea, Mexico, New Zealand, Switzerland and the United States (2005) and Norway and Turkey (2010).
Inclusiveness: Data on low income rate refer to 2013 except for Iceland, Japan and New Zealand (2012); and Australia, Finland, Hungary, Korea, Mexico, the Netherlands and the United States (2014). Data on labour income gap per capita refer to 2014 except for Korea (2012) and Canada and Japan (2015). For the employment gap for disadvantaged groups, see footnotes to Figure 1.7.
a. The share of workers experiencing job strain is the conceptually superior indicator of the quality of the working environment, but the scoreboard also includes the incidence of very long working hours as an alternative indicator because this allows the country coverage to be extended to more emerging economies.
b. OECD unweighted average except for employment and unemployment rates.
Source: Job quantity and very long hours of work: OECD Employment Database (www.oecd.org/employment/emp/onlineoecdemploymentdatabase.htm); Job quality: OECD Job Quality Database (www.oecd.org/statistics/job-quality.htm). Low income rate: Estimates and calculations based on the OECD Income Distribution Database (IDD), http://oe.cd/idd. Gender labour income gap per capita: OECD calculations based on the European Union Statistics on Income and Living Conditions (EU-SILC) for European countries, Encuesta Permanente de Hogares (EPH) for Argentina, Household, Income and Labour Dynamics in Australia (HILDA) for Australia, Pesquisa Nacional por Amostra de Domicilio (PNAD) for Brazil, Labour Force Survey for Canada, India (National Sample Survey), Indonesia (SAKERNAS), Turkey and the United States (CPS – Annual Social Economic Supplement), Encuesta de Caracterizacion Socioeconomica Nacional (CASEN) for Chile, Encuesta Nacional de Calidad de Vida (ECV) for Colombia, German Socio-Economic Panel (GSOEP) for Germany, Basic Survey on Wage Structure combined with Labour Force Survey results for Japan, Korean Labor and Income Panel Study (KLIPS) for Korea, Encuesta Nacional de Ingresos y Gastos de los Hogares (ENIGH) for Mexico and General Household Survey (GHS) for South Africa. Employmentgap for disadvantaged groups: OECD Employment Database (www.oecd.org/employment/emp/onlineoecdemploymentdatabase.htm) and OECD International Migration Database (www.oecd.org/els/mig/oecdmigrationdatabases.htm).
Despite the general tendency for countries to perform at a similar level across the different performance dimensions, there are a number of notable exceptions. One striking example is that countries’ performance in reducing the gender labour income gap is largely independent of their performance along the other eight performance dimensions. Indeed, the gender gap is significantly correlated only with the incidence of very long hours and the employment gap for disadvantaged groups. There are also quite a few countries that are in the top third in at least a few dimensions but are also in the bottom third in at least another couple of dimensions (e.g. Belgium and many countries in Asia and Central Europe). These patterns suggest that policies and institutions can be designed in such a way to simultaneously promote job quality, job quantity and inclusiveness, but getting all of them right can be challenging.
Table 1.2 also provides information on changes in labour market performance between 2006 and 2015.34 Recent trends vary considerably across the indicators. There was overall stability in terms of the quantity of employment, with about as many countries seeing significant improvements and significant reductions in performance. Job quality presents a mixed picture in that more countries progressed than regressed in terms of earnings quality and the quality of the working environment, but the opposite was true for labour market insecurity. The three inclusiveness indicators also provide a mixed picture: while low income rates increased in many countries and decreased in only few, the other two indicators show many more countries making progress than regressing. Many countries also experienced both rising performance along some dimensions and declining performances along others. Despite the overall tendency for a country’s performance to be similar across the different indicators, as noted above, there is a lot of scope for medium-term changes in these indicators to diverge.
There is also considerable cross-country heterogeneity in the evolution of labour market performance during the past decade. European countries that were badly hit by the financial crisis and had to undergo important fiscal restraint (Greece, Ireland, Italy, Portugal and Spain) experienced worsening performance for many indicators, emphasising how the effects of the crisis are still being felt in these countries, not only in terms of job quantity and quality (see Chapter 2) but also in terms of inclusiveness. Several of the top performing countries (Denmark, the Netherlands and Sweden) also experienced worsening performance in a number of indicators. In some cases, this may reflect unsustainably buoyant labour market conditions in 2006 having overstated long-run performance (e.g. the Danish unemployment rate in 2006), but these countries may also have encountered new difficulties, such as large influxes of refugees (e.g. Sweden) or declining cost competitiveness. By contrast, Germany, Israel and Poland stand out for having achieved significant improvements along at least five of the nine performance dimensions, while being approximately stable on the other dimensions. The Czech Republic, Turkey and many Latin American countries also showed considerable, if somewhat less widespread, improvement. Finally, those Anglo-Saxon countries that belong by and large to the middle third according to most indicators (Australia, Canada, the United Kingdom and the United States) are characterised by a striking stability of their performance over time.
Conclusions
This chapter contributes to the new OECD Jobs Strategy by proposing a set of indicators intended to provide a broad but relatively concise overview of labour market performance in terms of the quantity and quality of jobs and labour market inclusiveness. Much of the attention focusses on the development of inclusiveness indicators, since the measurement of inclusiveness has received considerably less attention from researchers than has the measurement of the quantity and quality of employment. The three inclusiveness indicators proposed here, as grouped in a summary scoreboard with three indicators each of employment quantity and job quality, provide a useful empirical baseline for assessing employment policy priorities and monitoring future progress. With a view to those applications, the indicators were chosen with an eye to selecting those that have broad country coverage and are easily updated.
One important extension of the analysis presented in this chapter would be to develop additional indicators of labour market resilience and adaptability. Chapters 2, 3and 4 of this edition of the Employment Outlook shed new light on resilience and adaptability which will help to prepare the ground for developing summary indicators. Whether or not it will prove possible to incorporate reliable indicators of resilience and adaptability into the scoreboard, it will be essential that the OECD’s revised guidelines for employment policy be forward looking and identify policies that can help to sustain strong labour market performance in the face of negative shocks and the need to adapt to megatrends such as digitalisation, globalisation and population ageing.
References
Cazes, S., A. Hijzen and A. Saint-Martin (2015), “Measuring and Assessing Job Auality: The OECD Job Quality Framework”, OECD Social, Employment and Migration Working Papers, No. 174, OECD Publishing, Paris, https://doi.org/10.1787/5jrp02kjw1mr-en.
Fernandez, R. et al. (2016), “Faces of Joblessness”, OECD Social, Employment and Migration Working Papers, No. 192, OECD Publishing, Paris, www.oecd-ilibrary.org/social-issues-migration-health/oecd-social-employment-and-migration-working-papers_1815199x.
OECD (2017a), “Statistical Annex” to the OECD Employment Outlook 2017, available online at www.oecd.org/employment/employment-outlook-statistical-annex.htm.
OECD (2017b), “How Are We Doing? A Broad Assessment of Labour Market Performance”, Annexes of Chapter 1 of the OECD Employment Outlook 2017, available online at www.oecd.org/employment/oecd-employment-outlook-19991266.htm.
OECD (2017c), Dare to Share: Germany’s Experience Promoting Equal Partnership in Families, OECD Publishing, Paris, https://doi.org/10.1787/9789264259157-en.
OECD (2017d), OECD Economic Outlook Vol. 2017, Issue 1, No. 101, OECD Publishing, Paris, www.oecd.org/eco/economicoutlook.htm.
OECD (2016), OECD Employment Outlook 2016, OECD Publishing, Paris, https://doi.org/10.1787/empl_outlook-2016-en.
OECD (2015a), All on Board: Making Inclusive Growth Happen, OECD Publishing, Paris, https://doi.org/10.1787/9789264218512-en.
OECD (2015b), How’s Life? 2015: Measuring Well-being, OECD Publishing, Paris, https://doi.org/10.1787/how_life-2015-en.
OECD (2015c), Indicators of Immigrant Integration, 2015: Settling In, OECD Publishing, Paris, https://doi.org/10.1787/9789264234024-en.
OECD (2015d), OECD Employment Outlook 2015, OECD Publishing, Paris, https://doi.org/10.1787/empl_outlook-2015-en.
OECD (2014), OECD Employment Outlook 2014, OECD Publishing, Paris, https://doi.org/10.1787/empl_outlook-2014-en.
OECD (2013), “Recommendation of the Council on Gender Equality in Education, Employment and Entrepreneurship”, Adopted by the OECD Council on 29 May 2013, www.oecd.org/gender/C-MIN(2013)5-ENG.pdf.
OECD (2011), Divided We Stand: Why Inequality Keeps Rising, OECD Publishing, Paris, https://doi.org/10.1787/9789264119536-en.
OECD (2008), OECD Employment Outlook 2009, OECD Publishing, Paris, https://doi.org/10.1787/empl_outlook-2008-en.
Stiglitz, J., A. Sen and J.P. Fitoussi (2009), “Report by the Commission on the Measurement of Economic Performance and Social Progress”, www.stiglitz-sen-figoussi.fr/documents/rapport_anglais.pdf.
Database references
OECD Earnings Distribution Database, www.oecd.org/employment/emp/employmentdatabase-earningsand wages.htm.
OECD Economic Outlook Database, https://stats.oecd.org/index.aspx?DataSetCode=EO.
OECD Employment Database, www.oecd.org/employment/emp/onlineoecdemploymentdatabase.htm.
OECD Family Database, “2. The labour market position of families”, www.oecd.org/els/family/database.htm.
OECD Income Distribution Database (IDD), http://oe.cd/idd.
OECD International Migration Database, www.oecd.org/els/mig/oecdmigrationdatabases.htm.
OECD Job Quality Database, www.oecd.org/statistics/job-quality.htm.
Notes
← 1. The statistical data for Israel are supplied by and under the responsibility of the relevant Israeli authorities. The use of such data by the OECD is without prejudice to the status of the Golan Heights, East Jerusalem and Israeli settlements in the West Bank under the terms of international law.
← 2. The OECD Jobs Strategy has been a key reference for guiding national labour market policies in OECD countries since it was first adopted in 1994. It is currently being reassessed an updated and the new Jobs Strategy is expected to be presented to member country governments for their adoption in June 2018.
← 3. Different aspects of labour market inclusiveness – for example, in-work poverty and the gender pay gap – have been the object of much study, but there appears to have been little research aimed at measuring overall labour market inclusiveness.
← 4. Rising participation rates in the majority of OECD countries explains why the unemployment rate remains slightly above its pre-crisis level even though the employment rate now exceeds its pre‐crisis level.
← 5. The OECD is currently exploring the feasibility of developing robust indicators of labour market resilience and adaptability.
← 6. The full-time equivalent employment rate implicitly norms for the level of economic development because national definitions of full-time employment are used in the calculation. That is, it assumes that shifting social norms about socially desirable working hours are incorporated into the national definition of full-time employment.
← 7. When interpreting Figure 1.3, it is important to note that higher values of the indicators for labour market insecurity and the quality of working environment correspond to worse performance. That is, Panel B reports an indicator of insecurity and Panels C and D indicators of poor working conditions.
← 8. The Pearson linear correlation coefficients reported in Figure 1.3 are all statistically significant at 1% level. This is also the case for Spearman rank correlations that are similarly strong: 0.57 for earnings quality, -0.70 for labour market insecurity and -0.62 for job strain, but substantially weaker for long working hours at -0.37.
← 9. However, there is some evidence of a trade-off between job quantity and quality across emerging economies. Indeed, the main issue for emerging economies is not the lack of jobs, as such, since open unemployment tends to be low. Rather, it is the lack of quality jobs that raises the greatest concerns. This partly reflects the inadequacy of social security, which pushes workers into subsistence-level occupations.
← 10. In contrast with the job quality indicators, the three inclusiveness indicators are partially overlapping.
← 11. In particular, for the countries for which data are available, the correlation coefficient of the low income rates computed on household disposable income and those computed on individual gross labour income (see online Annex Figure 1.A2.4) is 0.56.
← 12. The equivalised disposable income of a household is its total after-tax-and-transfer income divided by the square root of the headcount of its members.
← 13. This definition corresponds to what is often called the relative poverty rate, in which people are classified as poor when their equivalised disposable household income is less than a given percentage of the median prevailing in each country.The term “low income” is preferred to “poverty”, since the latter often refers to material deprivation, which is not necessarily implied by being below the low income threshold considered here – which is higher in richer countries.
← 14. The increase in the low income rate between 2006 and 2013 was particularly sharp in countries hard hit by the crisis, such as Greece and Spain.
← 15. Alternative indicators of overall and bottom-end dispersion of the income distribution for the working-age population are shown in online Annex Figure 1.A2.1 (disposable income), Annex Figure 1.A2.2 (market income), Annex Figure 1.A2.3 (gross full-time earnings), Annex Figure 1.A2.4 (gross labour income, including self-employed income). The additional indicators provide a similar picture insofar as they are all significantly correlated with the low income rate, with one exception: the correlation of the ratio of the first decile to the median of gross earnings of full-time employees with the low income rate is not significant at standard levels. Note, however, that standard measures of earnings disparities based on gross earnings of full-time employees are good proxies of wage dispersion but are the least suited to provide useful measures of inclusiveness since they limit comparisons to full-time employees and do not account for income differences coming from days and hours worked.
← 16. The data in Panel A underestimate the impact of steady employment in lowering the risk of low employment, since the definition of households with employment includes some households that had only a little employment during the year.
← 17. It could be argued that gaps in post-taxlabour income would provide a better measure of gender disparities. Unfortunately, this measure is available only for few countries on a comparable basis. It should also be noted that large labour income gaps need not constitute evidence of gender discrimination (See OECD, 2008, for a detailed analysis of gender discrimination).
← 18. Data for Japan are calculated by combining employment rates obtained from the Labour Force Survey with average earnings differentials obtained from the Basic Survey on Wage Structure (BSWS), and using a standard aggregation formula, that is: GLIG = EG + (1 – EG) * IG, where GLIG, EG and IG stands for the overall gender gap in labour income, the gender gap in employment rate and the gender gap in labour income among the employed, respectively. The Japanese income data exclude agriculture and forestry, fisheries, the public sector and firms with fewer than ten employees, as well as self-employment. However similar calculations using data from the Keio Households Panel Survey (KHPS), which include all individuals and types of labour income, yield similar estimates. Nevertheless, calculations obtained from the LFS and BSWS are preferred in Figure 1.6, since the KHPS sample is very small.
← 19. Gaps in full-time earnings in Panel B are measured using hourly, weekly, monthly or annual earnings, depending on data availability. To the extent that the variability of contractual hours among full-time is limited, the gaps presented in Panel B can be assumed to proxy gaps in hourly earnings. Tests made on a limited group of countries for which both hourly and monthly earnings are available validatethis assumption.
← 20. As shown in OECD (2017c), gaps in labour income per capita are particularly large when comparing fathers and mothers with young children. In this case, in virtually all countries, the gender gap is greater than what shown in Figure 1.6.
← 21. This list of groups at risk of disadvantage is not exhaustive because it reflects limits to data availability. For instance, certain ethnic minorities are important disadvantaged groups in a number of countries. However, comparable data on employment performance of ethnic minorities are not available in many countries, as collection of this type of data is illegal.
← 22. The barriers faced by these groups may include lack of adequate education, skills and/or work experience, health problems, care responsibilities, lack of transportation, lack of suitable information on job vacancies and how to qualify for them as well as lack of access to new job search tools and technology, discrimination, or other social problems, and insufficient financial incentives due to a high tax burden on in-work income or the loss of benefits upon gaining in-work income and other sources of out-of-work income, including income of other household members. As shown by Fernandez et al. (2016), the prevalence and intensity of these barriers can be very heterogeneous both across and within each of the groups considered here.
← 23. In order to get a more meaningful comparison, youth who are in full-time education have been excluded from the reference population in the case of youth. If the employment rate of youth were used instead, the gap would have been positive in all countries.
← 24. Insignificant correlations occur only between the employment gaps for non-natives and people with disabilities. However, the insignificance of the latter is driven by the particular characteristics of the non-native population in certain countries (e.g. Chile and the United States), which drives up their employment rate. The correlation between the employment gaps of older workers and mothers with children is significant only at the 10% level. All other pairwise correlations are significant at the 5% or 1% levels.
← 25. The pairwise correlation of the aggregate employment rate and each of these employment gaps is always negative and significant at the 1% level. One may worry that these high pairwise correlations – as well as those between different disadvantaged groups – are driven by the fact that gaps are expressed in percentage of the employment rate of prime-age men. In principle, this introduces a common term at the denominator which is also a key determinant of the aggregate employment rate. However, the correlation coefficients are equally large and significant when the gaps are expressed as simple differences between employment rates. This suggests that these high pairwise correlations are not a spurious statistical artefact.
← 26. The composition of the non-native population in Israel is, however, much different from that of many other countries. Large reductions in the employment gap for migrants are also observed in Chile, the Czech Republic and Poland, where immigrants represent a very small share of the population.
← 27. The deterioration in the employment status of non-natives in Turkey likely reflects the large inflow of refugees from Syria.
← 28. Thecalculation of the overall indicator for employment gaps is discussed in detail in the online Annex 1.A3. The employment gap of each group is weighted by the cross-country average size of the population of each group divided by the cross-country range of variation of each group’s employment gap. This is equivalent to standardising each gap by subtracting the cross-country mean and dividing by the cross-country range and then imputing any missing standardised gap by setting it equal to the average of the other standardised gaps for the same country. It should be noted, however, that there is some double counting, to the extent that certain individuals belong to more than one of the groups considered here. This indicator appears very robust to the choice of weights and the exclusion of one group altogether, even when the comparison is limited to the countries with no missing values – which justifies the adopted treatment of missing values.
← 29. Changes in the indicator are computed on the basis of a sub-indicator considering, for each country, only groups whose gaps are not missing in both 2006 and 2015, or nearby dates. The levels of these gaps are presented in the online Annex Table 1.A3.1.
← 30. When available, the share of workers experiencing job strain is the preferable measure of the quality of the working environment.
← 31. Chapter 2 presents an in-depth analysis of labour market resilience since the global financial crisis, while Chapter 3 analyses the adaptive challenge that new technologies, such as digitalisation, and globalisation pose for labour markets. Chapter 4 provides a fuller description of collective bargaining and other forms of worker voice than has previously been available. The organisation and operation of these forms of representation appear to play a major role in determining labour market resilience and adaptability, a topic that the OECD will address using its new database on collective bargaining that underlies Chapter 4.
← 32. Two observations are in order. First, while the low income rate is used as the first inclusiveness indicator in the scoreboard, the discussion in Section 4 shows that results would be robust to replacing this indicator with another inequality indicator that places particular weight on persons at the bottom of the income distribution. Second, the employment gaps indicator for disadvantaged groups (i.e. the third inclusiveness indicator in the scoreboard) provides only a partial measure of the lack of integration of disadvantaged groups into the labour market. It might be argued that a better indicator could be obtained by taking a weighted average of overall indicators for low income and employment gaps, weighting by the inverse of each variable’s cross-country range of variation. This more comprehensive approach has not been adopted in Table 1.2 because low income gaps are not available for many countries (in particular in time series). Using the more comprehensive indicator would thus significantly limit country coverage. It is reassuring that the more comprehensive indicator is highly correlated with the indicator for employment gaps (online Annex Figure 1.A3.1), in particular in terms of country ranking (the Spearmanrank correlation coefficient is 0.90, while the linear correlation coefficient is 0.80; both are significant at the 1% level). The indicator for employment gaps was thus chosen for the scoreboard, because the gain in country coverage appeared to more than compensate for the loss of information from not considering gaps in low income rates.
← 33. This remains true even if the comparison is restricted to OECD countries.
← 34. The colours of the arrows to the right of each data cell indicate changes during 2006-15, where black denotes a significant improvement in performance, horizontal arrow indicates approximate stability and blue indicates a significant deterioration. A change in a performance indicator is considered to be significant when the absolute value of its annual average multiplied by ten is at least as large as one-half of the standard deviation of that indicator across OECD countries.