Chapter 6. Innovation in practices to develop higher order skills in science and reading
This chapter presents the change in teaching and learning practices in science and in reading aimed at developing student’s higher order skills. They include observing, imagining, designing an experiment, drawing conclusions and making inferences and making connections with real life, including one’s own experience. The change within countries is presented as an increase or decrease in the share of students exposed to the practice. The percentage point change is also expressed as a standardised effect size in the final table.
The statistical data for Israel are supplied by and under the responsibility of the relevant Israeli authorities. The use of such data by the OECD is without prejudice to the status of the Golan Heights, East Jerusalem and Israeli settlements in the West Bank under the terms of international law.
27. Observing and describing natural phenomena
Why it matters
Observing carefully what one sees and being able to describe it constitutes one of the foundations of the scientific mindset (and of domains such as the arts). This is also a key skill for personal improvement. Observing with empathy, with different lenses on, is also one habit of mind that is critical to develop students’ creative and critical thinking skills.
Primary education
Change at the OECD level: large
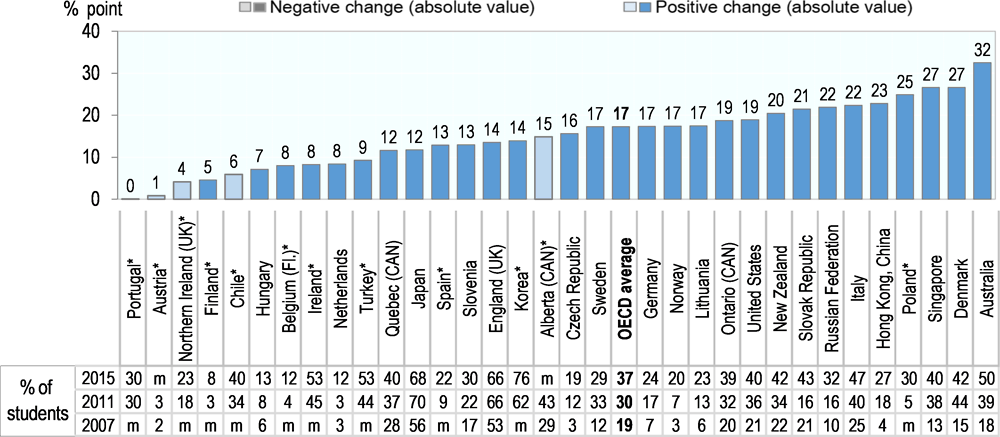
Between 2007 and 2015, the share of 4th grade students observing and describing natural phenomena in at least half of their science lessons has increased by 27 percentage points. The absolute change was also 27 percentage points (changes in both directions taken into account), corresponding to a large effect size of 0.59. There has thus been substantial innovation in this domain. In 2015, on average half of the 4th grade students practised their observation skills, with a span ranging from 26% in Norway to 76% in the Slovak Republic.
Countries where there has been the most change
Singapore stands out with an increase in the use of this practice by 44 percentage points between 2007 and 2015, followed closely by the Czech Republic, Germany and Hungary (40 percentage points). Poland also recorded a substantial increase by 44 percentage points between 2011 and 2015. In all these countries, the spread of this practice has been an innovation.
Secondary education
Change at the OECD level: large
As in primary education, the share of secondary students regularly observing and describing natural phenomena during science lessons saw a net increase and an absolute change of 26 percentage points, corresponding to a very large effect size of 0.57. This has also been a substantial innovation. In 2015, 55% of students were asked to observe and describe natural phenomena in science lessons on average, with a span ranging from 81% in Turkey to 26% in Sweden.
Countries where there has been the most change
Innovation in this practice took the form of a large expansion in the adoption of this pedagogical activity. In particular, Hong Kong, China, Hungary and Australia registered notable increases in the share of students exposed to the practice (over 40 percentage points).

Notes: Darker tones correspond to statistically significant values.
* refers to calculations based on other years, based on data availability.
The OECD average is based on OECD countries with available data in 2007, 2011 and 2015.
Source: Authors' calculations based on TIMSS Databases.

Notes: Darker tones correspond to statistically significant values.
* refers to calculations based on other years, based on data availability.
The OECD average is based on OECD countries with available data in 2007, 2011 and 2015.
Source: Authors' calculations based on TIMSS Databases.
28. Asking students to design and plan science experiments
Why it matters
Scientists use experiments as a key tool to test their assumptions and just to observe natural phenomena. Acquiring scientific skills or understanding the nature of science includes the ability to design and plan science experiments, to take measures and understand which experiments could cast light on specific scientific questions. This is a key practice in both teacher- and student-centred science learning environments.
Primary education
Change at the OECD level: large
Between 2007 and 2015, the practice gained ground in all OECD systems, with a net increase and absolute change of 17 percentage points in the proportion of 4th grade students systematically being asked to design and plan science experiments. This corresponds to a large absolute effect size of 0.43, a big change in the use of this practice. In 2015, 37% of 4th grade students were regularly using this pedagogical activity on average.
Countries where there has been the most change
This practice particularly spread in Australia, where the share of students doing this exercise in at least half the lessons increased by 32 percentage points between 2007 and 2015. During the same time period, Denmark and Singapore also strongly innovated and recorded increases of 27 percentage points.
Secondary education
Change at the OECD level: moderate
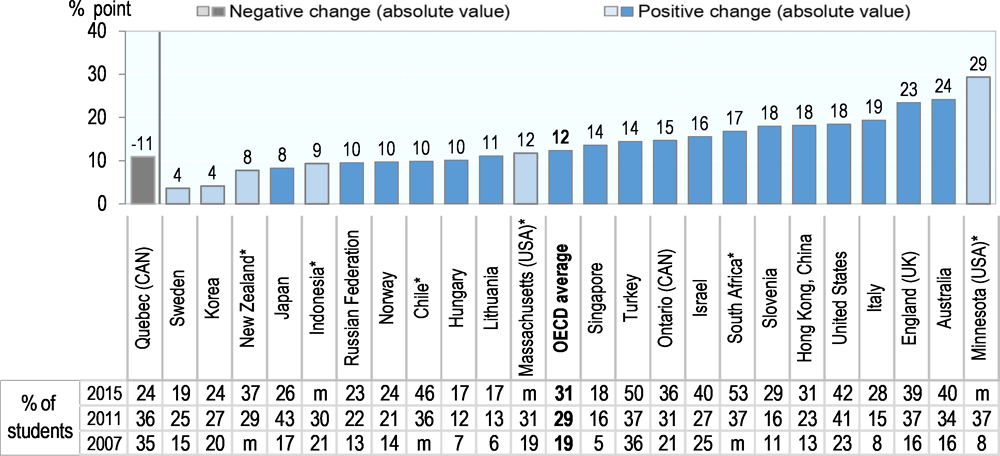
At the secondary level, the practice has also spread across OECD systems with the average share of 8th grade students regularly designing or planning experiments in science going from 19% in 2007 to 31% in 2015. The absolute change, taking into account expansions and retractions, amounted to 14 percentage points, corresponding to a moderate effect size of 0.33. In most OECD countries, the use of this pedagogy is low or moderate. Turkey stands out with 50% of the 8th grade students constantly exposed to these science exercises.
Countries where there has been the most change
Innovation has mainly taken the form of a dissemination of this science practice. Between 2007 and 2015, important increases of 29, 24 and 23 percentage points were witnessed in Minnesota (United States), Australia and England (United Kingdom). The only contraction of the practice was experienced by Quebec (Canada) where it declined by 11 percentage points.
Notes: Darker tones correspond to statistically significant values;
* refers to calculations based on other years, based on data availability.
The OECD average is based on OECD countries with available data in 2007, 2011 and 2015.
Source: Authors' calculations based on TIMSS Databases.
Notes: Darker tones correspond to statistically significant values.
* refers to calculations based on other years, based on data availability.
The OECD average is based on OECD countries with available data in 2007, 2011 and 2015.
Source: Authors' calculations based on TIMSS Databases.
29. Asking students to draw conclusions from an experiment in science
Why it matters
Hands-on, experiential education is not just about doing things. The most important step of a science experiment lies in its conclusion (including the impossibility to conclude). While classes commonly involve experiments done by students, exercising this last step is key to better conclude. To make it interesting and challenging, conclusions should not be straightforward though, which they sometimes are in teacher-directed learning practices.
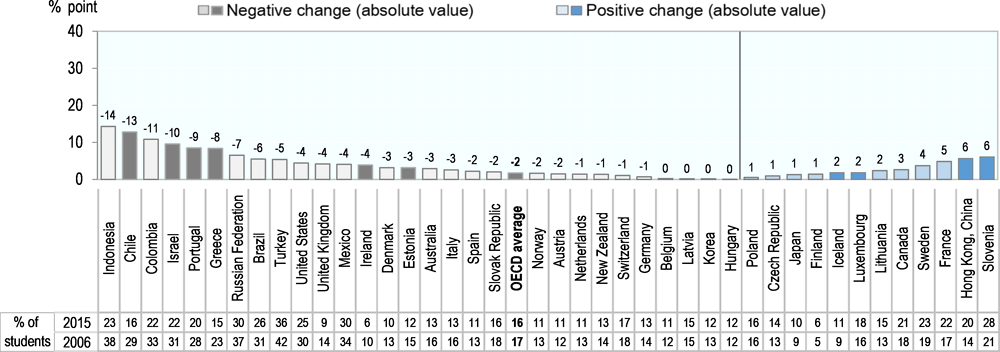
Change at the OECD level: moderate
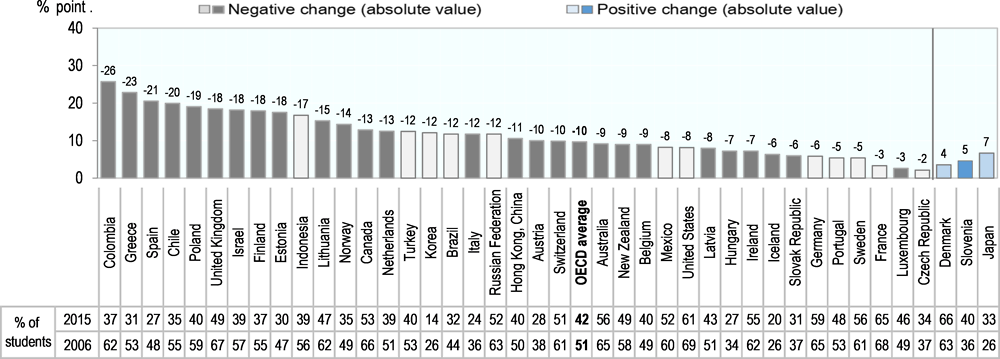
Innovation in OECD countries resulted in the reduced use of this practice. Between 2006 and 2015, the share of 15 year old students asked to draw conclusions from an experiment in all or most of their science lessons decreased by 10 percentage points on average. Together, negative and positive variations amounted to an absolute change of 11 percentage points, corresponding to a modest effect size of 0.22. The extent to which 15 year old students are regularly exposed to this science pedagogy varies considerably between OECD countries: from less than 14% of the students in Korea to 66% in Denmark in 2015.
Countries where there has been the most change
Colombia, Greece and Spain recorded substantial contractions in this practice, above 20 percentage points in each case. Japan, Slovenia and Denmark registered the only three positive changes in the sample, albeit small ones.
Note: Darker tones correspond to statistically significant values.
Source: Authors' calculations based on PISA Databases.
30. Teacher explaining relevance of broad science topics in everyday life
Why it matters
Students learn better science if they see the point of what they learn. Relating the scientific concepts learnt in class to the everyday life of children or, more generally, showing the relevance of what is taught to everyday life problems makes science more attractive – and its teaching and learning more effective. This good pedagogical practice should be as widespread as possible.
Change at the OECD level: small
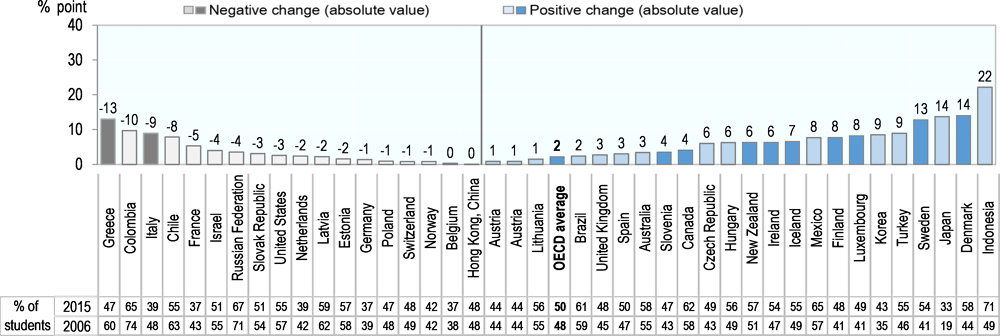
Between 2006 and 2015, the share of 15 year old students whose science teacher regularly explained the relevance of broad science topics in everyday life increased by 2 percentage point on average. Increases and reductions taken into account, the absolute change amounted to 5 percentage points, corresponding to a very small effect size of 0.1. In 2015, half of the students were exposed to this practice, which is particularly widespread in Mexico and Canada among OECD countries.
Countries where there has been the most change
Students in Indonesia experienced an increase of 22 percentage points in this science practice. In Denmark, Sweden and Japan, it also expanded by around 14 percentage points. On the contrary, Colombia and Greece registered declines of over 10 percentage points.
Note: Darker tones correspond to statistically significant values.
Source: Authors' calculations based on PISA Databases.
31. Teacher explaining practical application of school science topics
Why it matters
Some science topics cannot be easily related to students’ daily life. To make the topics more relevant and interesting to them, teachers should at the very least explain what the practical applications of these science ideas are, what they allow doing or producing in real life, if not in everyday life.
Change at the OECD level: small
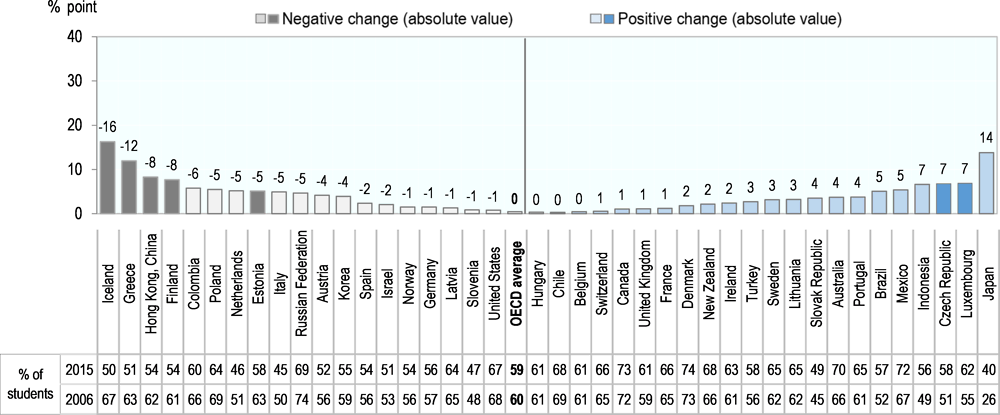
While positive and negative changes have cancelled each other across OECD countries, students experienced an absolute change in this practice of about 4 percentage points on average, corresponding to a small absolute effect size of 0.08. This practice is common across countries and concerned 59% of students in 2015, although significant differences can be observed across countries, touching 74% of students in Denmark compared to 40% in Japan.
Countries where there has been the most change
Innovation was minor in this area and only manifested through small and modest increases and reductions in the use of this practice. Between 2007 and 2015, Japan experienced the largest diffusion of the practice (14 percentage points) whereas Iceland and Greece experienced the largest contraction (16 and 12 percentage points respectively).
Note: Darker tones correspond to statistically significant values.
Source: Authors' calculations based on PISA Databases:
32. Students comparing read text with their own experiences
Why it matters
Connecting teaching and learning to students’ everyday life and experiences drives their interest in learning. While reading need not be limited to what we have experienced, making connections between one’s experiences and a read text helps to understand it, and also to learn to observe one’s environment, be it internal (emotions and behaviour) or external (society). A good practice for text comprehension and social and behavioural skills.
Change at the OECD level: moderate-low
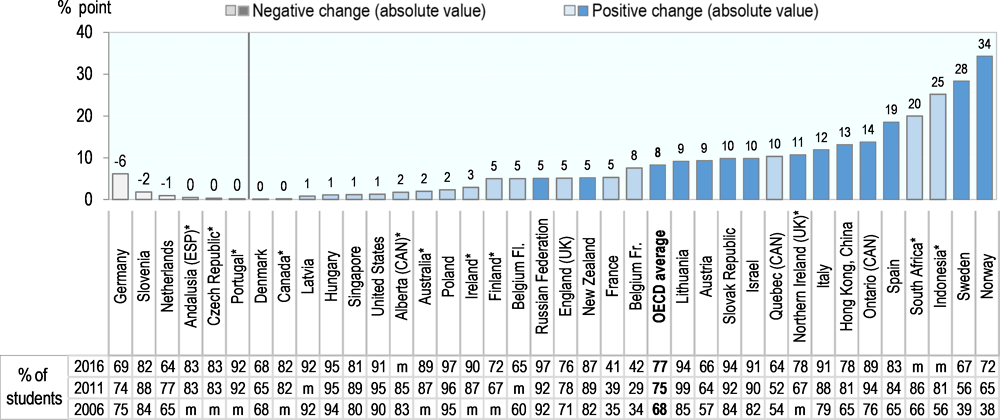
The share of primary students regularly comparing read text with their own experience rose by 8 percentage points on average between 2006 and 2016 in OECD systems. The practice spread in a majority of OECD countries. Looking at both negative and positive changes, the absolute change amounted to 9 percentage points, corresponding to a moderate-low effect size 0.22. Apart from Belgium (Fr.) and France where only around 40% of 4th grade students compared read text with their own experiences at least once a week in 2016, the practice is common in OECD countries touching at least two thirds of students, and 77% of students on average.
Countries where there has been the most change
Norway and Sweden experienced the largest expansion of this practice, by 34 and 28 percentage points respectively. Reductions were few and not statistically significant.
Notes: Darker tones correspond to statistically significant values.
* refers to calculations based on other years, based on data availability.
The OECD average is based on OECD countries with available data in 2006, 2011 and 2016.
Source: Authors' calculations based on PIRLS Databases.
33. Opportunities for students to explain their ideas
Why it matters
Most education systems aim to develop children’s critical thinking, creativity and communication skills. This requires that children are given enough room to express and explain their ideas, and that they are able to confront them with those of their peers. This “active” pedagogical practice should be part of the mix of learning activities, with teachers defining the right dosage for their teaching and learning context.
Change at the OECD level: small
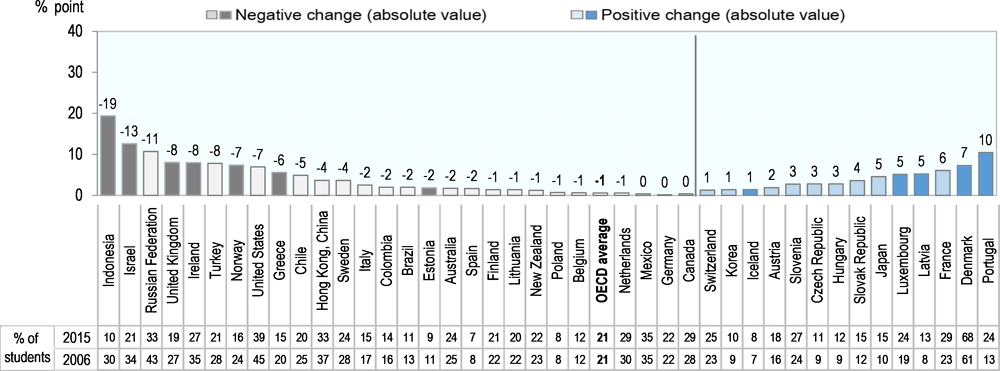
Most OECD countries saw little change in the use of this practice. Overall, negative changes slightly surpassed positive ones resulting in an average decline of 1 percentage point in the share of 15 year old students systematically given the opportunities to explain their ideas in science lessons. Accounting for increases and decreases, the mean absolute change amounted to 4 percentage points, corresponding to a small effect size of 0.1. In 2015, only 21% of secondary students were frequently given the opportunity to express their ideas in science lessons on average, with a span ranging from 8% in Poland to 68% in Denmark.
Countries where there has been the most change
Innovation in this domains took the form of a strong meant a decrease in the use of this practice in Indonesia (-19 percentage points) and Israel (-13). On the other hand, Portugal and Denmark experienced increases by 10 and 7 percentage points respectively. In most places, there was no innovation in this domain.
Note: Darker tones correspond to statistically significant values.
Source: Authors' calculations based on PISA Databases.
34. Making predictions about what will happen next in read text
Why it matters
Imagining and envisioning are key sub-dimensions of higher order skills such as creativity and critical thinking. When the teacher is aware of this, making predictions about what will happen next in a read text can stimulate these skills. In any case it helps to learn to draw conclusions and thus to understand what is implied in a text. This teaching strategy for text comprehension can go beyond this mere objective.
Change at the OECD level: moderate
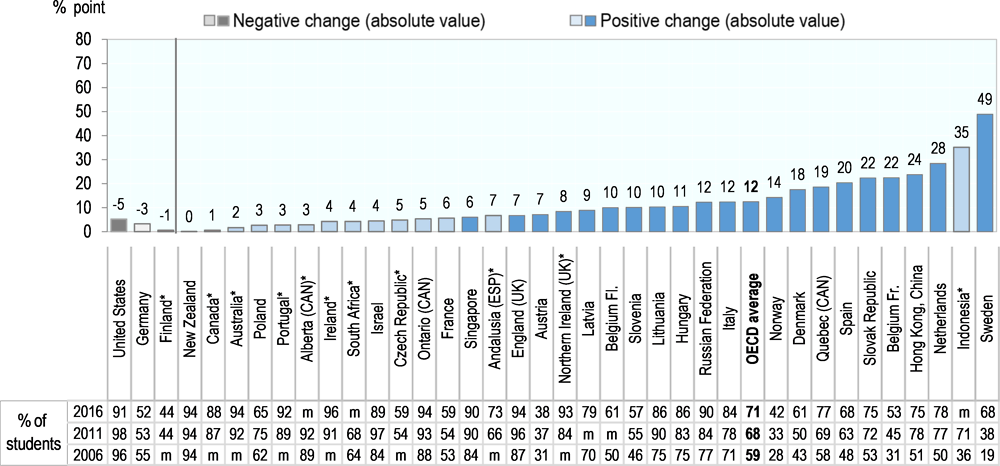
Most countries in the sample saw an expansion of the use of this practice, the OECD average rising by 12 percentage points between 2006 and 2016. Ignoring the direction of country-level changes, the average absolute change was a little over 13 percentage points which translated to a moderate effect size of 0.3. This practice was fairly common across OECD education systems in 2016, with 71% primary students concerned on average, the span going from 96% of students in Ireland to 38% in Austria.
Countries where there has been the most change
This teaching and learning practice scaled up significantly in Sweden (49 percentage points), the Netherlands (28) and Hong Kong, China (24) between, 2006 and 2016, as well as in Indonesia (35 percentage points) between 2006 and 2011.
Notes: Darker tones correspond to statistically significant values.
* refers to calculations based on other years, based on data availability.
The OECD average is based on OECD countries with available data in 2006, 2011 and 2016.
Source: Authors' calculations based on PIRLS Databases.
35. Using digital devices for playing simulations at school
Why it matters
One of the virtues of computers for learning lies in their power for simulations: they allow students to practice and to become experts in specific tasks without the real-life consequences of failure. Playing simulations (or learning in simulated environments) is thus one of the smart uses of computers for learning, and an interesting pedagogical practice to adopt, both in mathematics and other domains – although it will typically have to be supplemented by other non-simulated practices.
Change at the OECD level: small
Across the OECD area, the use of this practice has more often increased than decreased. Overall, 4% more of the students reported to be doing these simulations at school at least once a month in 2015 than in 2009. The absolute change was around 6 percentage points, representing a small effect size of 0.15. The use of this IT-based practice is often low or moderate in OECD countries, with 26% of students concerned on average, with a span going from 41% in Italy to 10% in Japan.
Countries where there has been the most change
Innovation occurred in both directions. Between 2009 and 2015 the Russian Federation saw the greatest increase in this practice (23 percentage points), while Germany experienced the most substantial decline (23 percentage points). An innovation in both places, but in opposite direction.

Note: Darker tones correspond to statistically significant values.
Source: Authors' calculations based on PISA Databases.
36. Allowing students to design their own experiments
Why it matters
Designing their own experiments is one of the learning strategies for students to think as scientists and to get a deeper understanding of scientific phenomena. This pedagogical practice should be part of a mix of pedagogical practices in science and requires subtle guidance and feedback from teachers and peers. Allowing students to choose their own experiment also supports their student agency.
Change at the OECD level: small
Between 2006 and 2015, negative changes slightly outweighed positive ones across OECD countries, leading to a net decrease of almost 2 percentage points in the share 15 year old students allowed to design their own experiments in most science lessons. The absolute change was 3 percentage points, with a small absolute effect size of 0.08. This practice is uncommon in OECD countries, with 16% students concerned on average in 2015, and a span going from 6% in Ireland and Finland to 36% in Turkey.
Countries where there has been the most change
Negative changes trump positive ones in this practice. Slovenia and Hong Kong, China experienced a small increase (6 percentage points) between 2006 and 2015, but innovation mainly occurred in Chile, Colombia and Indonesia with contractions over 10 percentage points.
Note: Darker tones correspond to statistically significant values.
Source: Authors' calculations based on PISA Databases.
|
Table 6.1. Effect sizes for changes in practices to develop creative and critical thinking skills in science and reading
|
|||||||||||||
|---|---|---|---|---|---|---|---|---|---|---|---|---|---|
|
Observing and describing natural phenomena |
Students designing and planning science experiments |
Students drawing conclusions from an experiment |
Teacher explaining relevance road science topics |
Teacher explaining practical application of school science topics |
Students comparing read text with their own experiences |
Opportunities for students to explain their ideas |
Making predictions about what will happen next in read text |
Using digital devices for playing simulations at school |
Scope for students to design their own experiments |
||||
|
|
4th grade |
8th grade |
4th grade |
8th grade |
8th grade |
8th grade |
8th grade |
4th grade |
8th grade |
4th grade |
8th grade |
8th grade |
|
|
Australia |
0.83 |
0.83 |
0.71 |
0.55 |
-0.19 |
0.07 |
0.08 |
0.06 |
-0.04 |
0.07 |
-0.04 |
-0.08 |
|
|
Austria |
0.26 |
m |
0.05 |
m |
-0.21 |
0.02 |
-0.08 |
0.19 |
0.05 |
0.15 |
0.04 |
-0.05 |
|
|
Belgium |
m |
m |
m |
m |
-0.18 |
-0.01 |
0.01 |
m |
-0.02 |
m |
0.04 |
-0.01 |
|
|
Belgium (Fl.) |
0.21 |
m |
0.30 |
m |
m |
m |
m |
0.10 |
m |
0.20 |
m |
m |
|
|
Belgium (Fr.) |
m |
m |
m |
m |
m |
m |
m |
0.16 |
m |
0.46 |
m |
m |
|
|
Canada |
m |
m |
m |
m |
-0.26 |
0.08 |
0.02 |
0.00 |
0.01 |
0.02 |
m |
0.07 |
|
|
Canada (Alberta) |
0.66 |
m |
0.31 |
m |
m |
m |
m |
0.05 |
m |
0.10 |
m |
m |
|
|
Canada (Ontario) |
0.45 |
0.62 |
0.41 |
0.33 |
m |
m |
m |
0.37 |
m |
0.19 |
m |
m |
|
|
Canada (Quebec) |
0.55 |
0.41 |
0.25 |
-0.24 |
m |
m |
m |
0.21 |
m |
0.40 |
m |
m |
|
|
Chile |
0.26 |
0.16 |
0.12 |
0.20 |
-0.40 |
-0.16 |
-0.01 |
m |
-0.12 |
m |
0.10 |
-0.31 |
|
|
Czech Republic |
0.85 |
m |
0.55 |
m |
-0.05 |
0.12 |
0.14 |
-0.01 |
0.09 |
0.10 |
0.00 |
0.03 |
|
|
Denmark |
0.48 |
m |
0.60 |
m |
0.07 |
0.28 |
0.04 |
0.00 |
0.15 |
0.35 |
0.06 |
-0.10 |
|
|
Estonia |
m |
m |
m |
m |
-0.36 |
-0.03 |
-0.10 |
m |
-0.06 |
m |
0.20 |
-0.09 |
|
|
Finland |
0.40 |
m |
0.20 |
m |
-0.36 |
0.16 |
-0.16 |
0.11 |
-0.03 |
-0.01 |
0.06 |
0.06 |
|
|
France |
m |
m |
m |
m |
-0.07 |
-0.11 |
0.03 |
0.11 |
0.14 |
0.11 |
m |
0.12 |
|
|
Germany |
0.91 |
m |
0.50 |
m |
-0.12 |
-0.03 |
-0.03 |
-0.14 |
0.00 |
-0.07 |
-0.54 |
-0.02 |
|
|
Greece |
m |
m |
m |
m |
-0.47 |
-0.26 |
-0.24 |
m |
-0.15 |
m |
0.10 |
-0.21 |
|
|
Hungary |
0.85 |
0.89 |
0.25 |
0.32 |
-0.16 |
0.13 |
-0.01 |
0.05 |
0.09 |
0.27 |
0.19 |
0.00 |
|
|
Iceland |
m |
m |
m |
m |
-0.15 |
0.13 |
-0.33 |
m |
0.05 |
m |
0.07 |
0.06 |
|
|
Ireland |
0.23 |
m |
0.17 |
m |
-0.15 |
0.13 |
0.05 |
0.09 |
-0.17 |
0.18 |
-0.10 |
-0.14 |
|
|
Israel |
m |
0.75 |
m |
0.33 |
-0.37 |
-0.08 |
-0.04 |
0.29 |
-0.28 |
0.13 |
0.18 |
-0.22 |
|
|
Italy |
0.76 |
0.54 |
0.47 |
0.52 |
-0.26 |
-0.18 |
-0.10 |
0.34 |
-0.07 |
0.30 |
0.26 |
-0.07 |
|
|
Japan |
0.14 |
0.38 |
0.24 |
0.20 |
0.15 |
0.31 |
0.30 |
m |
0.14 |
m |
0.10 |
0.04 |
|
|
Korea |
0.67 |
0.09 |
0.30 |
0.10 |
-0.31 |
0.18 |
-0.08 |
m |
0.05 |
m |
0.13 |
0.00 |
|
|
Latvia |
m |
m |
m |
m |
-0.16 |
-0.05 |
-0.03 |
0.03 |
0.17 |
0.21 |
0.48 |
-0.01 |
|
|
Lithuania |
0.39 |
0.60 |
0.52 |
0.37 |
-0.31 |
0.03 |
0.07 |
0.30 |
-0.03 |
0.26 |
0.29 |
0.07 |
|
|
Luxembourg |
m |
m |
m |
m |
-0.05 |
0.17 |
0.14 |
m |
0.13 |
m |
m |
0.05 |
|
|
Mexico |
m |
m |
m |
m |
-0.17 |
0.16 |
0.12 |
m |
-0.01 |
m |
m |
-0.09 |
|
|
Netherlands |
0.71 |
m |
0.33 |
m |
-0.25 |
-0.05 |
-0.10 |
-0.02 |
-0.01 |
0.60 |
-0.08 |
-0.04 |
|
|
New Zealand |
0.69 |
-0.06 |
0.44 |
0.16 |
-0.18 |
0.13 |
0.05 |
0.15 |
-0.03 |
0.00 |
0.21 |
-0.04 |
|
|
Norway |
0.43 |
0.57 |
0.60 |
0.25 |
-0.29 |
-0.02 |
-0.03 |
0.70 |
-0.18 |
0.30 |
m |
-0.05 |
|
|
Poland |
0.91 |
m |
0.70 |
m |
-0.38 |
-0.02 |
-0.12 |
0.12 |
-0.02 |
0.06 |
0.10 |
0.01 |
|
|
Portugal |
0.23 |
m |
0.00 |
m |
-0.11 |
0.02 |
0.08 |
-0.01 |
0.27 |
0.09 |
0.12 |
-0.20 |
|
|
Slovak Republic |
0.60 |
m |
0.47 |
m |
-0.13 |
-0.06 |
0.07 |
0.32 |
0.10 |
0.47 |
0.32 |
-0.05 |
|
|
Slovenia |
0.49 |
0.61 |
0.31 |
0.46 |
0.10 |
0.07 |
-0.02 |
-0.05 |
0.06 |
0.20 |
0.11 |
0.14 |
|
|
Spain |
0.13 |
m |
0.37 |
m |
-0.43 |
0.06 |
-0.05 |
0.43 |
-0.06 |
0.42 |
0.13 |
-0.07 |
|
|
Spain (Andalusia) |
m |
m |
m |
m |
m |
m |
m |
-0.01 |
m |
0.15 |
m |
m |
|
|
Sweden |
0.45 |
0.31 |
0.43 |
0.10 |
-0.11 |
0.26 |
0.07 |
0.58 |
-0.08 |
1.03 |
0.31 |
0.09 |
|
|
Switzerland |
m |
m |
m |
m |
-0.20 |
-0.02 |
0.01 |
m |
0.03 |
m |
-0.03 |
-0.03 |
|
|
Turkey |
0.58 |
0.66 |
0.19 |
0.29 |
-0.25 |
0.18 |
0.05 |
m |
-0.18 |
m |
m |
-0.11 |
|
|
United Kingdom |
m |
m |
m |
m |
-0.38 |
0.05 |
0.02 |
m |
-0.19 |
m |
m |
-0.13 |
|
|
UK (England) |
0.39 |
0.81 |
0.28 |
0.54 |
m |
m |
m |
0.12 |
m |
0.23 |
m |
m |
|
|
UK (Northern Ireland) |
0.18 |
m |
0.10 |
m |
m |
m |
m |
0.24 |
m |
0.27 |
m |
m |
|
|
United States |
0.47 |
0.48 |
0.42 |
0.40 |
-0.17 |
-0.05 |
-0.02 |
0.04 |
-0.14 |
-0.22 |
m |
-0.10 |
|
|
US (Massachusetts) |
m |
0.26 |
m |
0.27 |
m |
m |
m |
m |
m |
m |
m |
m |
|
|
US (Minnesota) |
m |
0.64 |
m |
0.74 |
m |
m |
m |
m |
m |
m |
m |
m |
|
|
OECD (average) |
0.56 |
0.54 |
0.39 |
0.29 |
-0.19 |
0.04 |
-0.01 |
0.19 |
-0.01 |
0.26 |
0.09 |
-0.05 |
|
|
OECD (av. absolute) |
0.59 |
0.57 |
0.43 |
0.33 |
0.22 |
0.11 |
0.08 |
0.22 |
0.10 |
0.30 |
0.15 |
0.08 |
|
|
Brazil |
m |
m |
m |
m |
-0.24 |
0.05 |
0.10 |
m |
-0.06 |
m |
m |
-0.12 |
|
|
Colombia |
m |
m |
m |
m |
-0.52 |
-0.21 |
-0.12 |
m |
-0.06 |
m |
m |
-0.24 |
|
|
Hong Kong, China |
0.76 |
0.88 |
0.69 |
0.45 |
-0.21 |
0.00 |
-0.17 |
0.29 |
-0.08 |
0.50 |
0.24 |
0.15 |
|
|
Indonesia |
m |
0.54 |
m |
0.21 |
-0.34 |
0.46 |
0.13 |
0.55 |
-0.50 |
0.72 |
m |
-0.31 |
|
|
Russian Federation |
0.18 |
0.50 |
0.55 |
0.25 |
-0.24 |
-0.08 |
-0.10 |
0.23 |
-0.22 |
0.34 |
0.51 |
-0.14 |
|
|
Singapore |
0.95 |
0.78 |
0.62 |
0.45 |
m |
m |
m |
0.03 |
m |
0.18 |
0.20 |
m |
|
|
South Africa |
m |
0.41 |
m |
0.34 |
m |
m |
m |
0.48 |
m |
0.09 |
m |
m |
|
|
|
|||||||||||||
|
|
|||||||||||||
|
|
|||||||||||||
|
Source: Authors' calculations based on TIMSS (2007, 2011 and 2015), PISA (2006, 2009 and 2015) and PIRLS (2006, 2011 and 2016). |
|||||||||||||
 Effect size from -0.5 to -0.2 and from 0.2 and 0.5
 Effect size from -0.8 to -0.5 and from 0.5 and 0.8
 Effect size equals or less than -0.8 and equals or greater than 0.8